Running queries
Query console
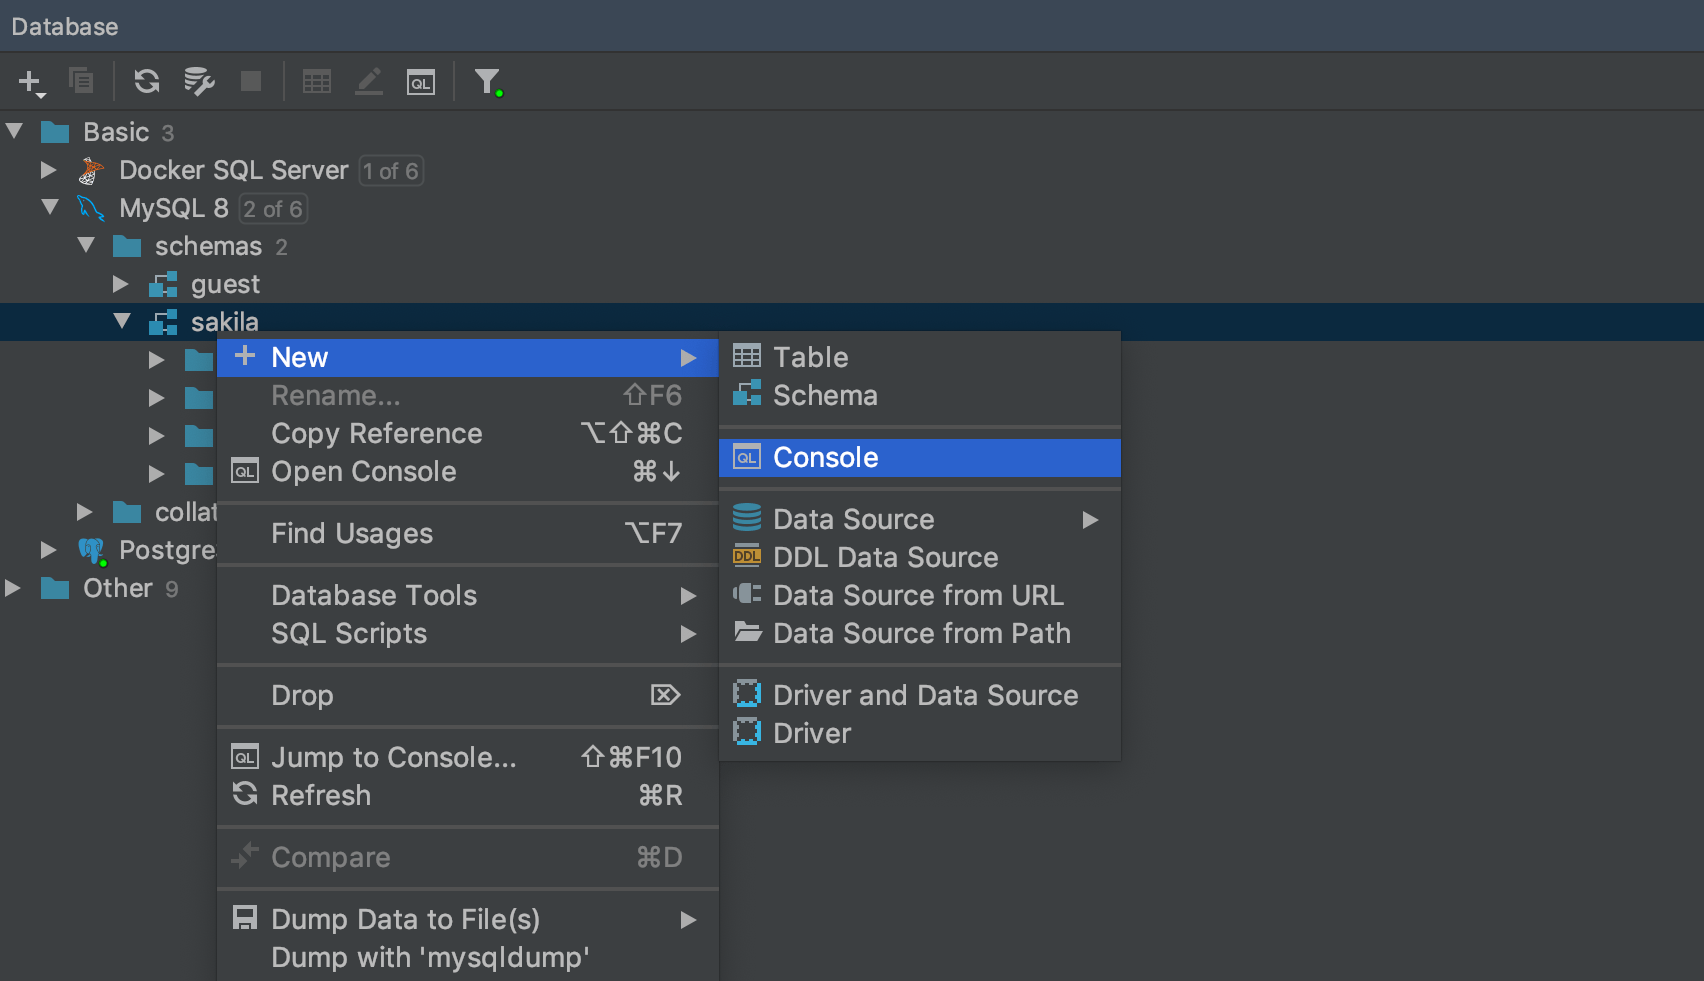
From our experience, the query console is the best place to write normal everyday SQL. Every data source has its own default console. To open it, go the context menu and click Open Console. Or use the shortcut F4.
You can write SQL here, then run it and get the result! It is as simple as that.
If for any reason you want to create another console for a data source, this is also possible: Context menu → New → Console
Schema switcher
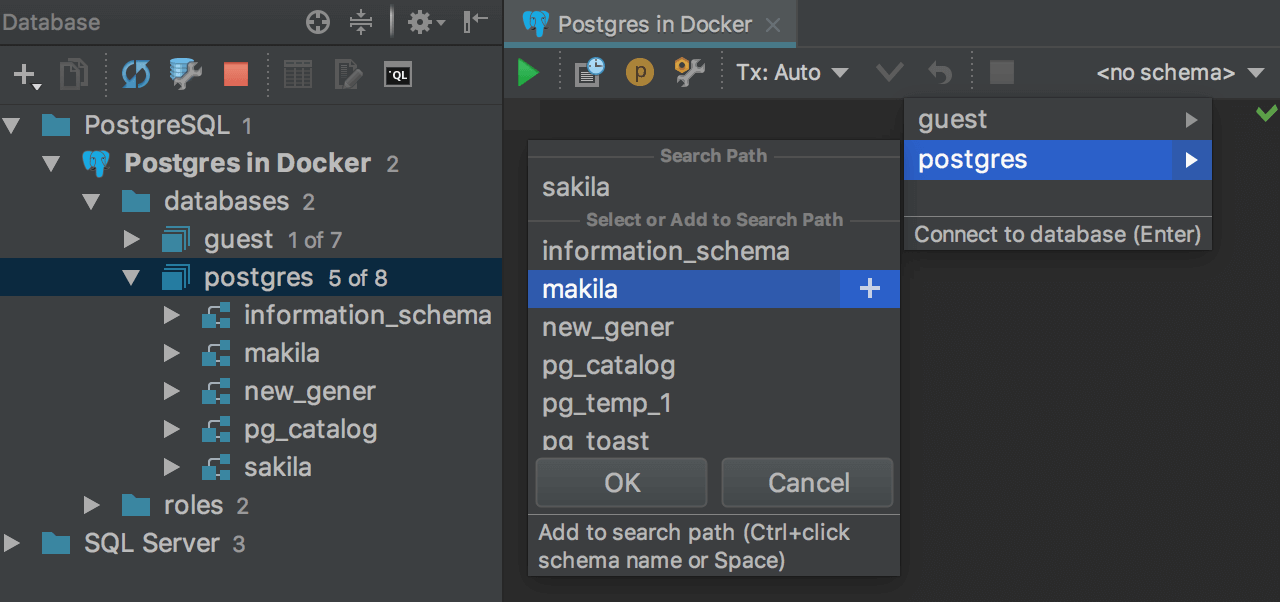
Create multiple consoles to manage lots of queries at the same time. Each console has a database/schema switcher. If you work with PostgreSQL define the search path here.
Execute selection
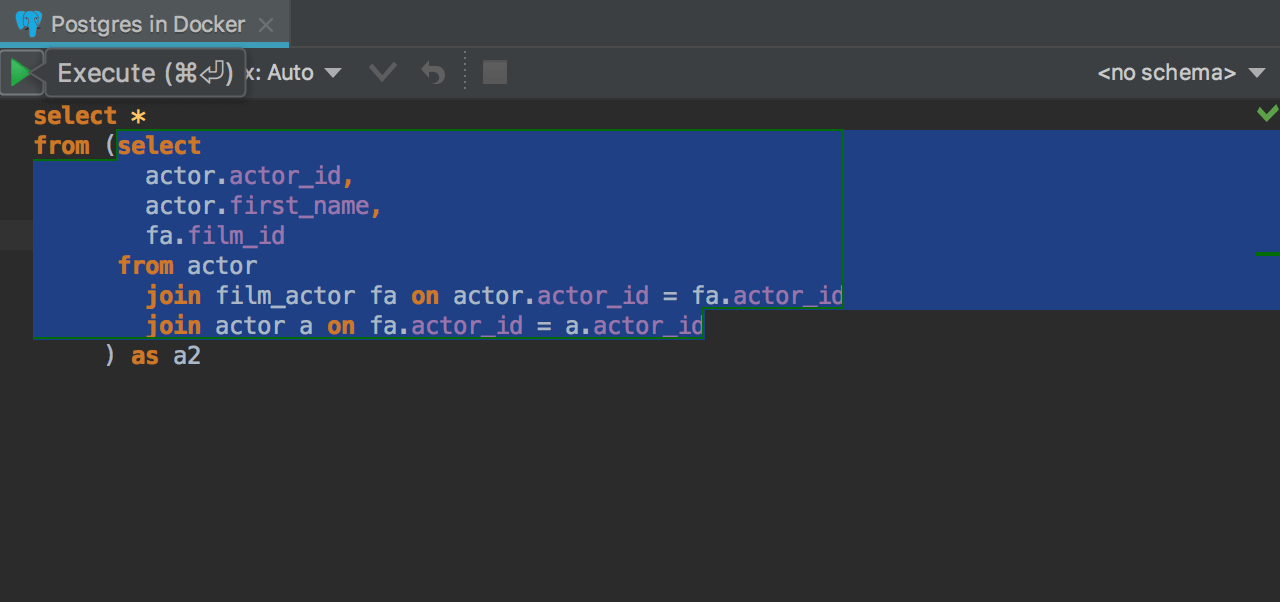
Select some code and execute only that selection. Note that the selected query is run as is: DataGrip just sends this string to the database and gets the result. It can be useful when the IDE incorrectly detects errors in queries.
Execution options
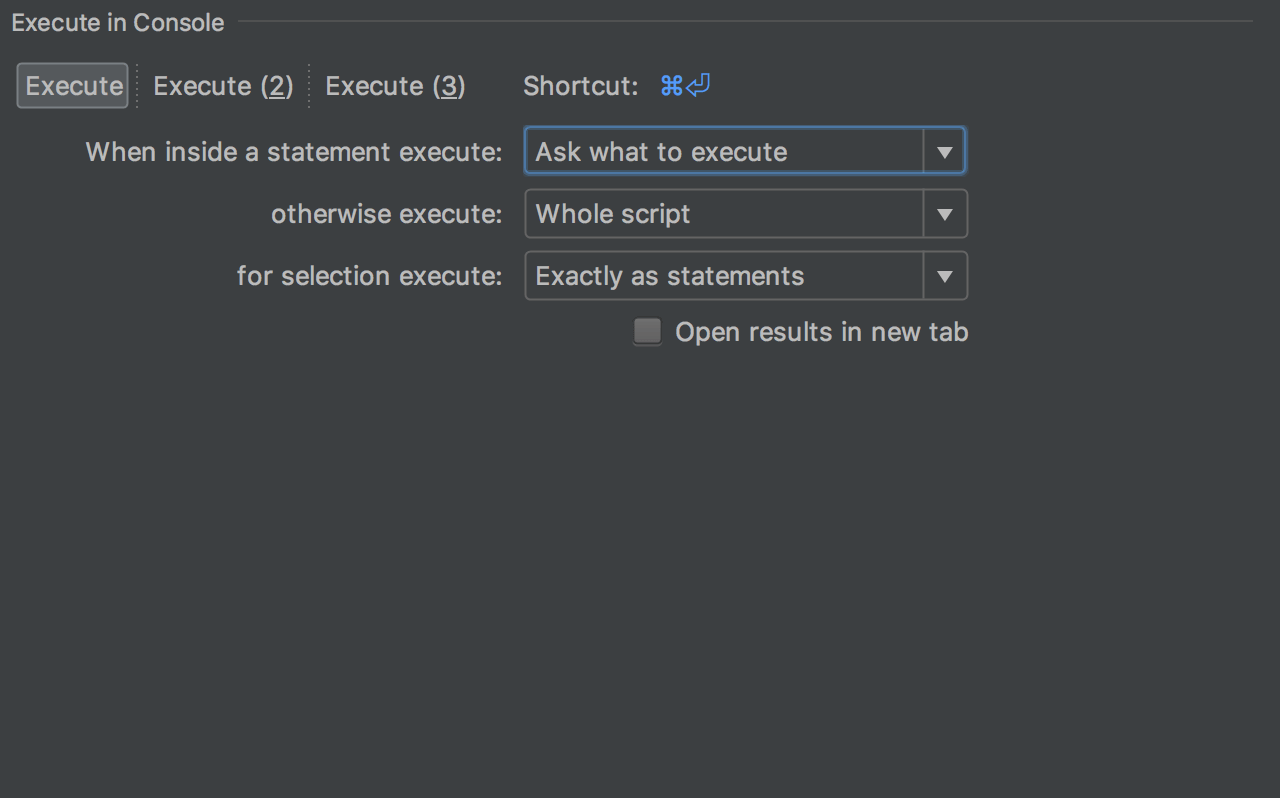
DataGrip provides smart options for executing queries. When the cursor is inside a query, the execution can be customized with several possible options available. Define its intended behavior: execute the smallest statement, the largest statement, ask you to choose what to execute, or execute the whole script.

Moreover, there are Execute actions. Change the behavior, and assign shortcuts: they are completely independent. For example, you can create an action which will execute the whole script, without having to choose the exact query from the script.
That's how it works.
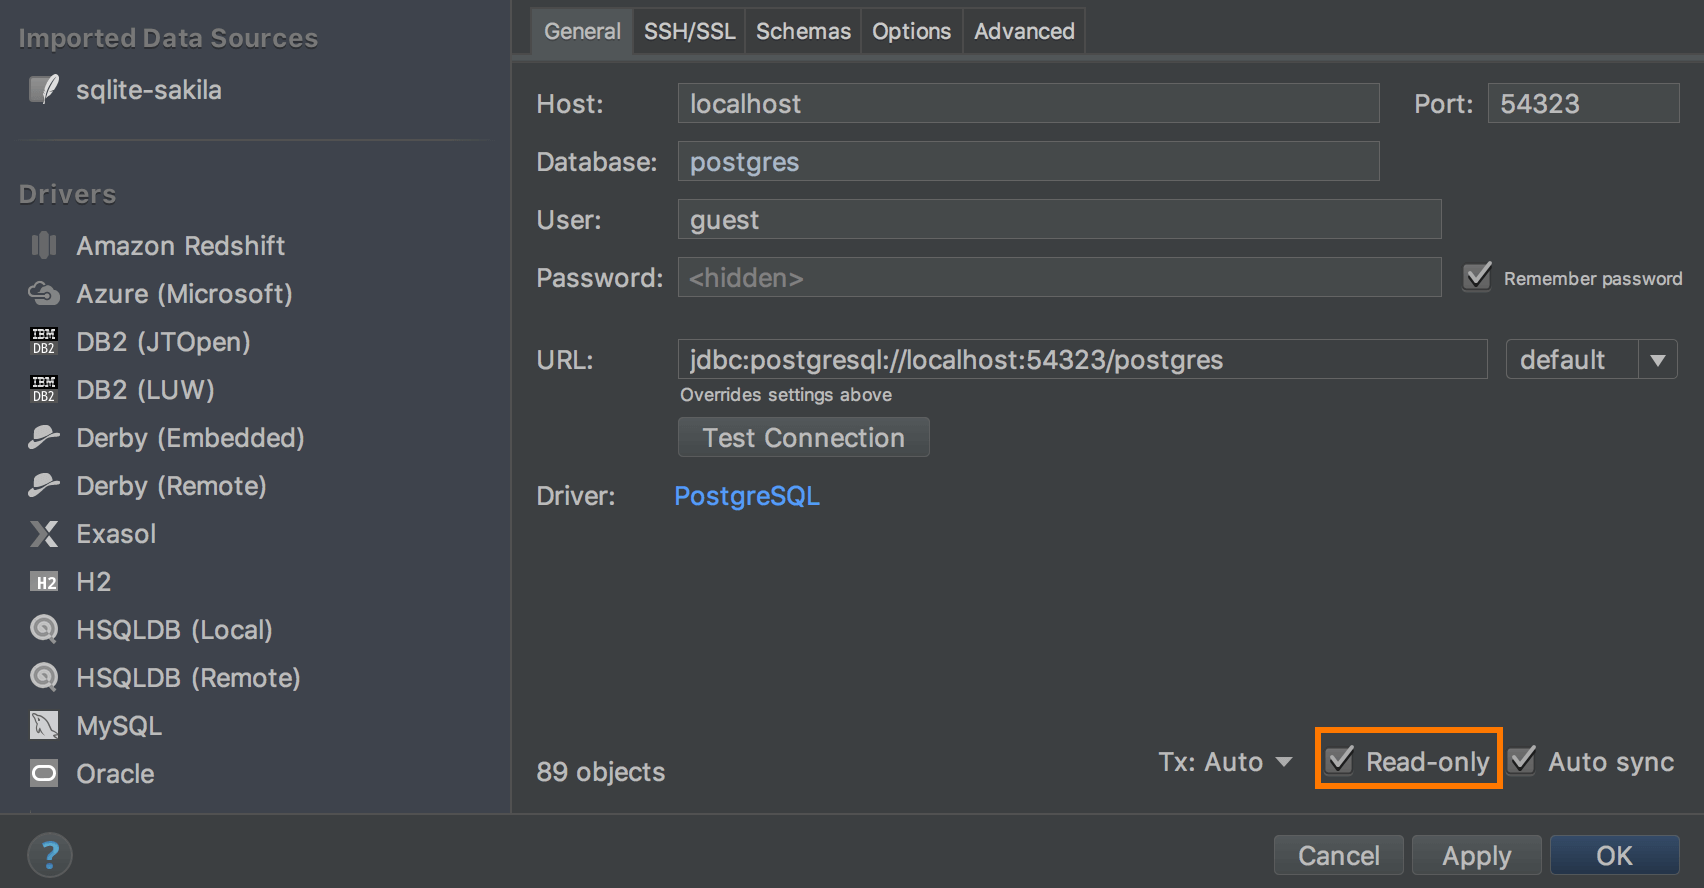
Read-only mode
Read-Only can be turned on in the data source properties. In fact, it turns on two read-only modes at the same time: read-only mode in the corresponding jdbc-driver and the IDE-level read-only mode.
Jdbc-driver read-only mode will refuse to run modification queries in MySQL, PostgreSQL, AWS Redshift, H2and Derby. In other DBMS’s it does nothing.
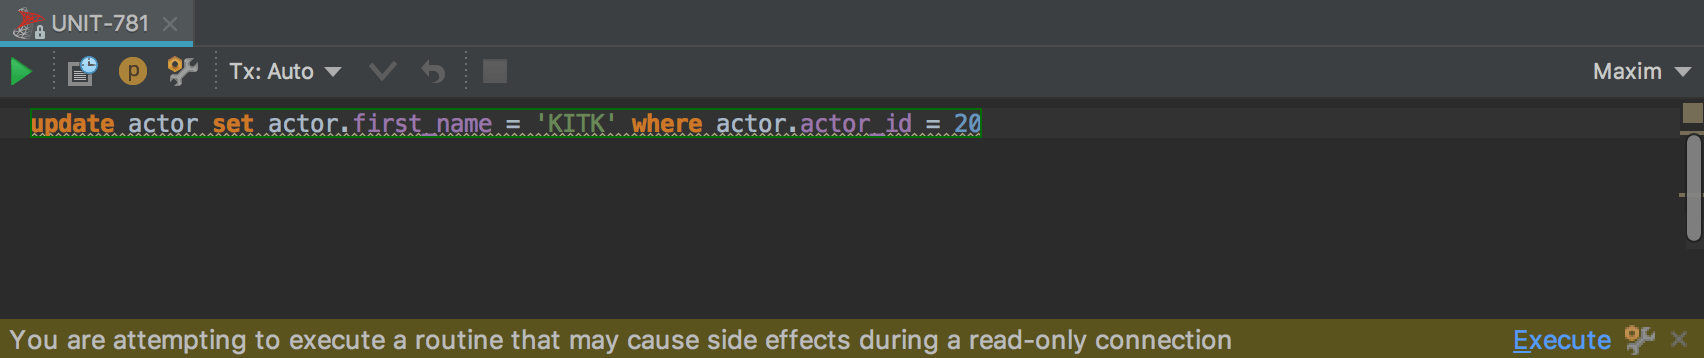
That's why we have an IDE-level read-only mode. It is activated along with the jdbc-level one. Thus, in read-only mode every DDL or DML query will be underlined. If you execute it, there will be a warning. It is possible to press Execute on this bar if you’re totally confident in what you are doing.
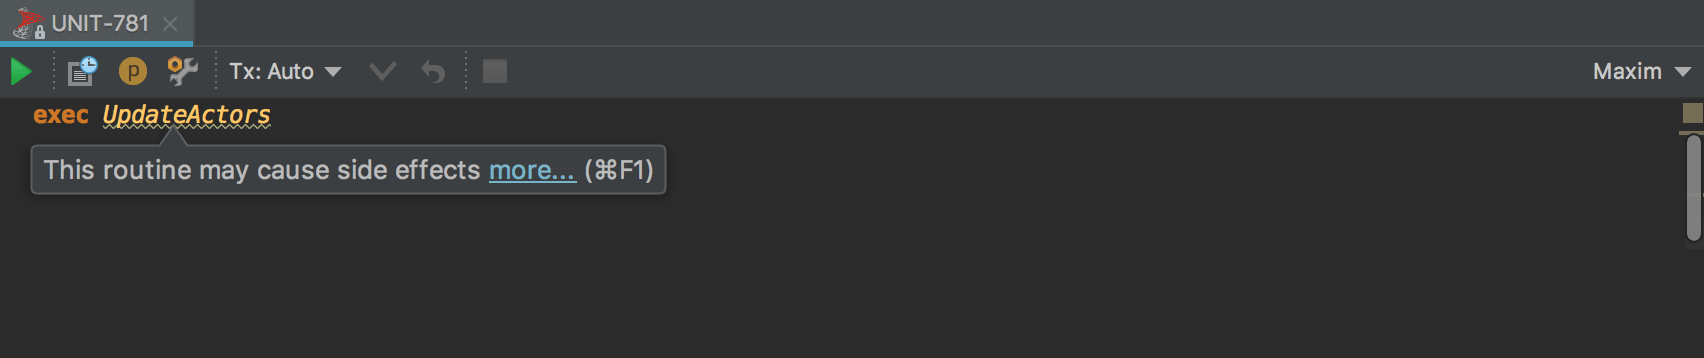
We also now index the source code of the functions and procedures, and build a call-tree in the background. It means that if a function executes another function (repeat n times) which executes DDL or DML statements, you’ll also see a warning.
Transaction control
Define what kind of transaction control you want to use when working with a particular data source. This option is available in data source properties. In the Auto mode you don’t need to commit any transactions executing the commit statement, while in the Manual mode, you, obviously do need to.
Evaluate expression
This will help you see data without having to write a query to the console. In other IntelliJ-based IDEs, Ctrl+Alt+F8 on an object gives you a quick evaluation. In DataGrip, invoke it on a table in a query to see the data of that table. Ctrl+Alt+F8 on a column name will show the values of that column in the expected result-set. If you invoke the same quick evaluate on the keyword of a query (or subquery), the pop-up will show you the result. Note that Alt+Click will also work for this.
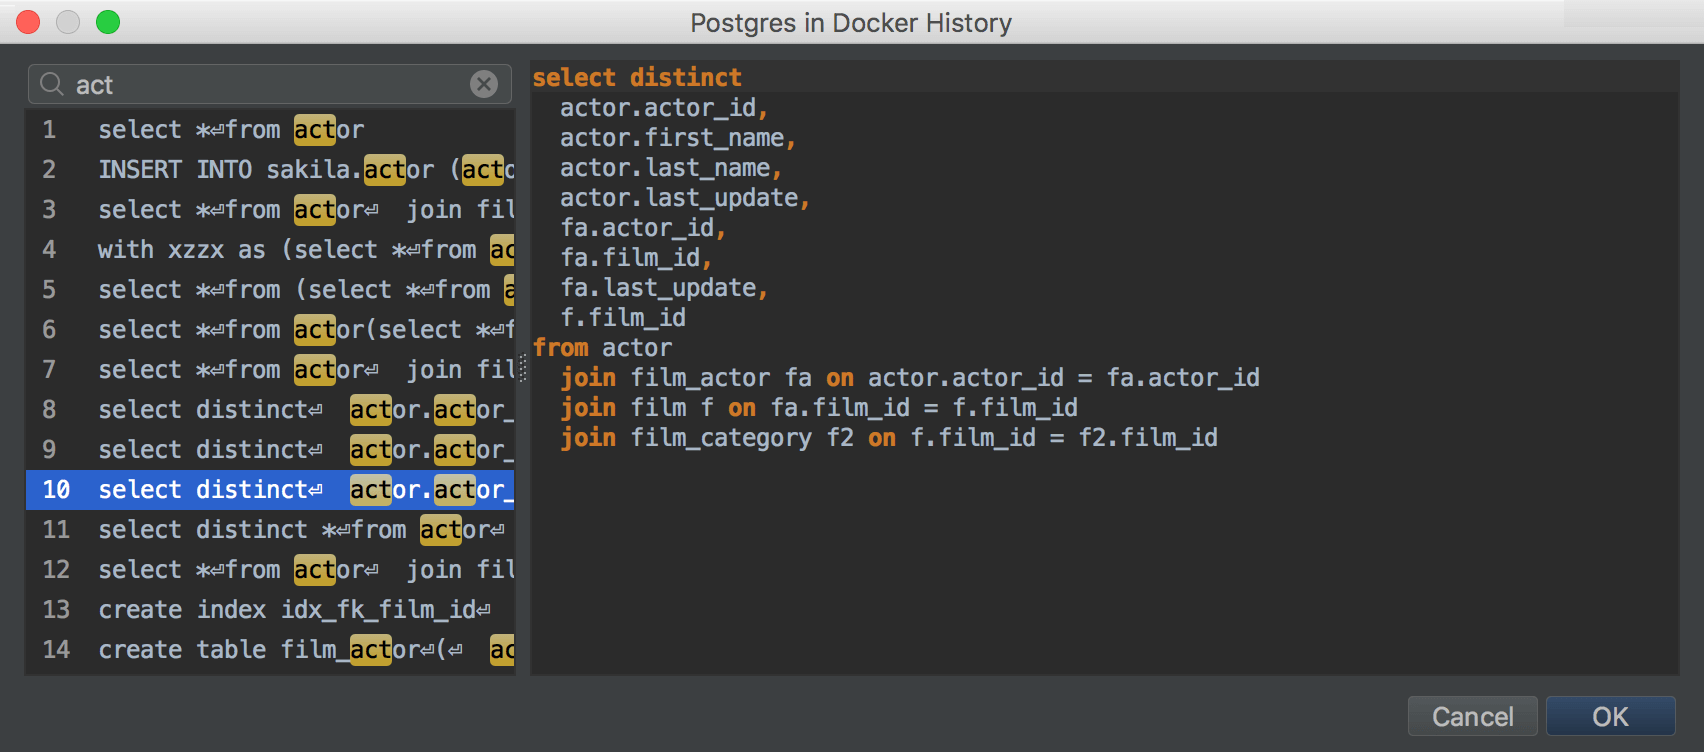
History of run queries
On the toolbar of every console there is a button:
![]() . Press it to see
the history of all the
queries which were run against this data source. Speed search also works!
. Press it to see
the history of all the
queries which were run against this data source. Speed search also works!
Also, don't forget about the Local History of each file.

Full SQL log
Literally, all queries from the IDE are logged in a text file. To open this file, go to Help | Show SQL log.

Running stored procedures
DataGrip can generate the code for running stored procedures. Put in the values of the parameters you need and click OK.
Note that you can run the procedure by clicking the Run button in the toolbar when opening the source code. Or just use Execute… from the context menu of the procedure in the database tree.

Unsafe queries
DataGrip will show a cautionary notice if you use the DELETE or
UPDATE statement without WHERE clause.
Explain plan

An execution plan for statements visually represents the operations the database performs in order to return the data required by your query. It helps you to optimize the query.

Graphically, the plan can be presented as a table or as a diagram.
User parameters
When you get an SQL query from another application, it can be parameterized. DataGrip supports running these kinds of queries.
The UI for editing parameter patterns is available in Settings/Preferences → Database → User Parameters. Regular expressions are highlighted and you can choose the dialect these patterns are valid.
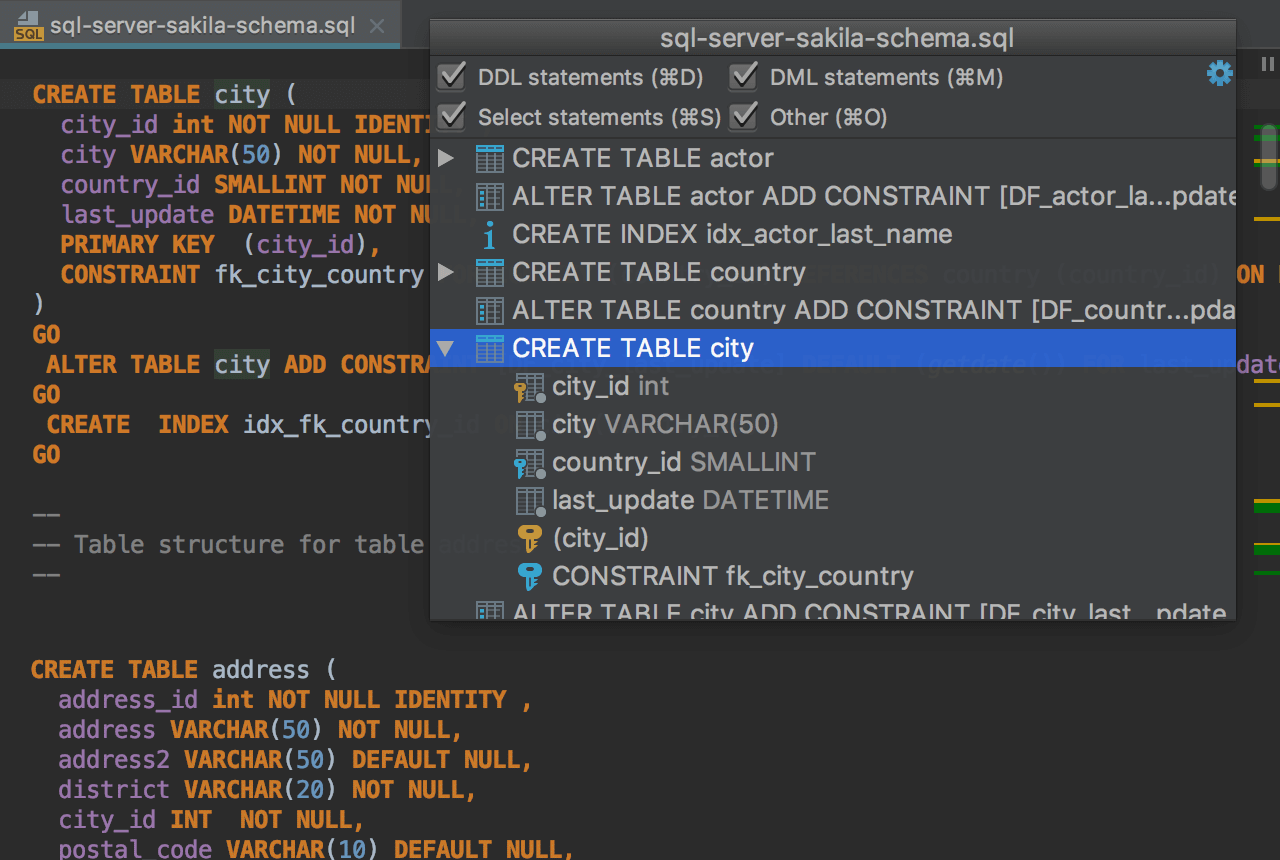
Structure view
For each console or SQL file you have a pop-up where all the statements are submitted as a structure. You can run queries just from this Structure pop-up (Ctrl+F12 ) which will be useful when you need to run several of them in a big script.
Query result

Result-set
In DataGrip the result-set is modifiable, so you can change data returned after you execute a query. It is the similar to the data editor with the same options available including auto-commit, adding/deleting rows, text search, and data navigation.

Compare results
Two result-sets can be compared in Diff Viewer. DataGrip will highlight the differences and let you manage the comparison criteria via the Tolerance parameter. For instance, if you want to consider two rows as equal if their data differs in a single column only, enter the corresponding value in the Tolerance field. Any column can be excluded from the comparison if needed.
Click the Compare button ![]() on the result's toolbar and choose which another result-set you want to compare it with.
on the result's toolbar and choose which another result-set you want to compare it with.

The results tabs can be named
A handy feature for results: tab naming! Just use the comment before the query.
If you only want certain comments to become tab names, use the Treat text as title after field in the settings to specify the prefix word. Then only the words coming after that word will be used as titles.

The page size is easy to change
To define how many lines you want to retrieve from the database, you can do it from the result-set’s toolbar.