dotCover Features
dotCover is a .NET unit testing and code coverage tool that works right in Visual Studio and in JetBrains Rider, helps you know to what extent your code is covered with unit tests, provides great ways to visualize code coverage, and is Continuous Integration ready. dotCover calculates and reports statement-level code coverage in applications targeting .NET Framework, .NET Core, Mono, and Mono for Unity.

Integration with Visual Studio and JetBrains Rider
dotCover is a plugin to Visual Studio and JetBrains Rider, giving you the advantage of analyzing and visualizing code coverage without leaving the code editor. This includes running unit tests and analyzing coverage results right in the IDEs, as well as support for different color themes, new icons and menus.
dotCover supports Visual Studio 2010–2026 and JetBrains Rider 2018.2 or later.

Works on Windows, macOS, and Linux
As part of Visual Studio or JetBrains Rider on Windows, dotCover supports projects targeting any supported version of .NET Framework, .NET Core, .NET, Mono 5.10 or later, and Unity 2018.3 or later. On macOS and Linux, dotCover can be used only as part of JetBrains Rider.
Running and managing unit tests
dotCover comes bundled with a unit test runner that it shares with another JetBrains tool for .NET developers, ReSharper.
The runner works in Visual Studio / JetBrains Rider, allows managing unit tests through sessions, and supports multiple unit testing frameworks, namely MSTest, NUnit, xUnit (all out of the box) and MSpec (via a plugin).

Continuous testing
dotCover supports continuous testing: a modern unit testing workflow whereby dotCover figures out on-the-fly which unit tests are affected by your latest code changes, and automatically re-runs the affected tests for you.
Based on your preferences, dotCover can run affected tests on saving a file, on building your solution or soon as you explicitly tell dotCover to do so.
The continuous testing mode can be switched on for any unit test session: this way you can choose which tests you want to run continuously and which to run in a traditional way.
Unit test coverage
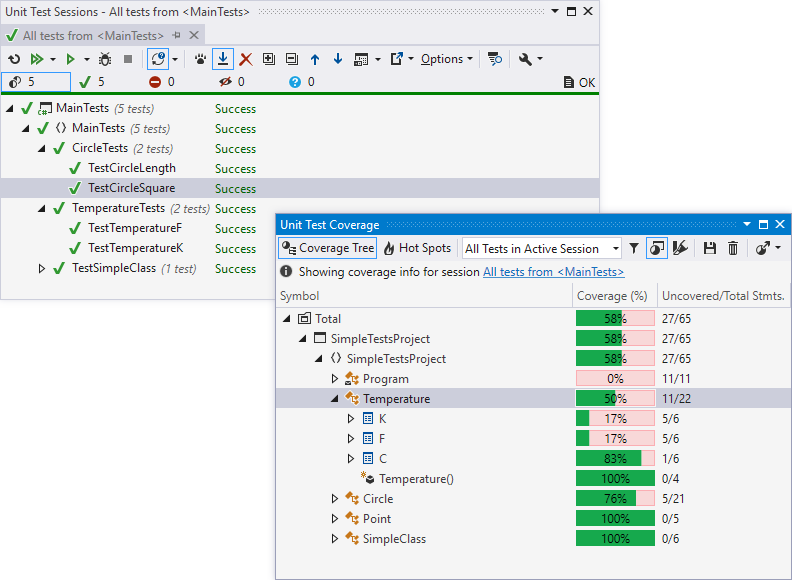
A major use case of dotCover is analyzing unit test coverage — that is, finding out which parts of application business logic are covered with unit tests, and which are not.
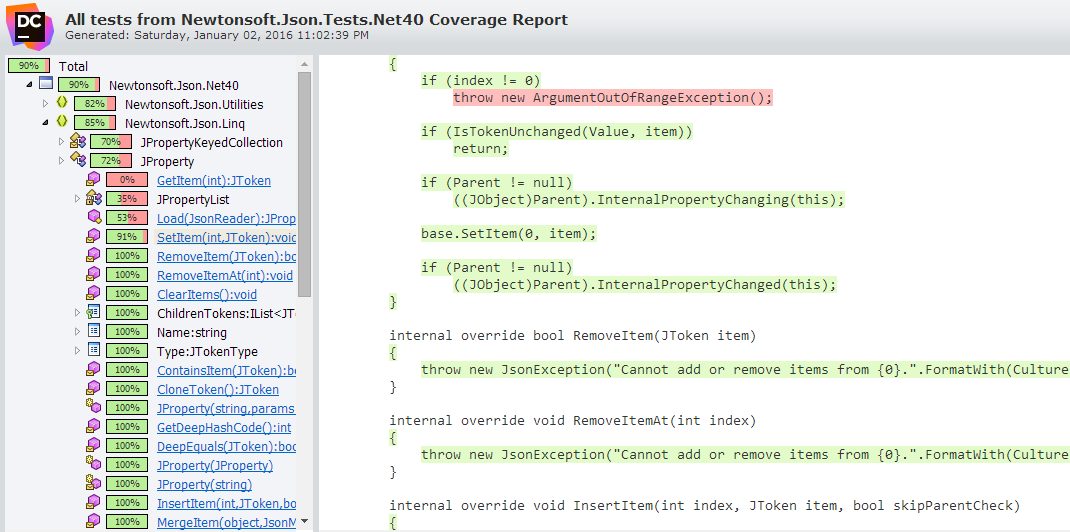
Along with unit test run results, dotCover displays a coverage tree showing how thoroughly a particular project, namespace, type, or type member is covered with unit tests.


Coverage highlighting in Visual Studio and JetBrains Rider
To visualize coverage data, dotCover can highlight lines of code right in the code editor. There's an option to switch between highlighting markers and colored background or to display both.
Note that highlighting shows not only covered and uncovered code but the results of the covering unit tests as well. Green color means that tests pass while red color indicates that at least one test that covers the statement fails. Grey color shows uncovered code.
Navigation to covering tests
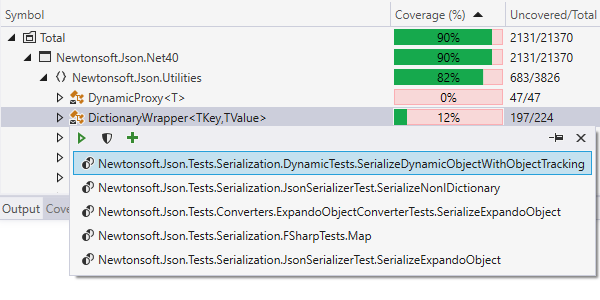
dotCover provides a command (and a keyboard shortcut) to detect which tests cover a particular location in code, be it a class, method, or property.
You can invoke the command from Visual Studio text editor or from dotCover's Coverage Tree view.
You can navigate from a pop-up that lists covering tests to any of these tests. Additionally, you can instantly run them or add to an existing unit test session.

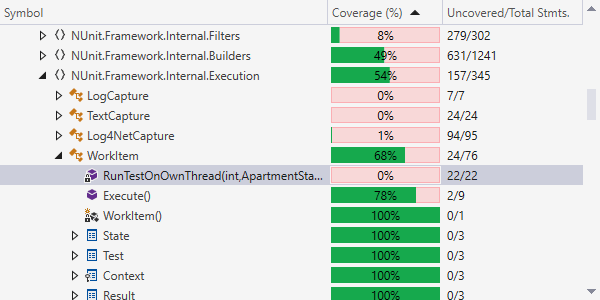
Hot Spots view
The Hot Spots view was designed to help you identify the most risky methods in your solution. Hot Spots are calculated in terms of high cyclomatic complexity and low unit test coverage of the methods.
Coverage filters
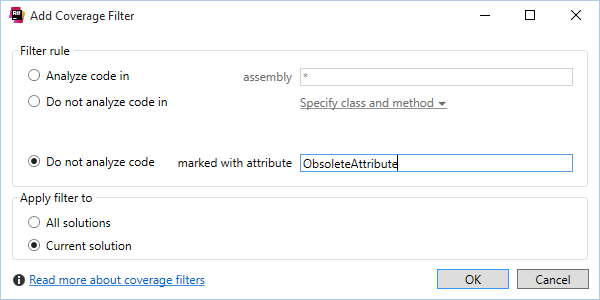
Sometimes, you don't want to know coverage data solution-wide. For example, you may not be
interested in coverage statistics for code marked with
ObsoleteAttribute or a specific legacy project.
In this case you can set global or solution-specific coverage filters based on project, namespace, type, or type member names. Attribute filters are also available that restrict gathering coverage information to code marked (or not marked) with certain attributes.
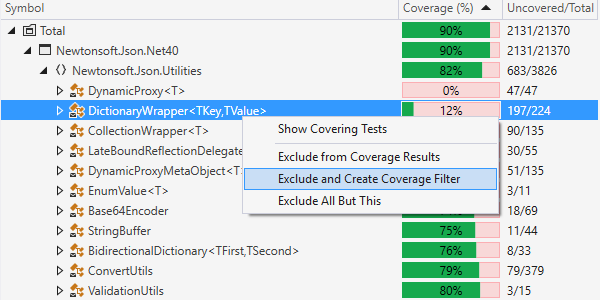
Excluding nodes from coverage tree
As an alternative to filters that you set up in advance or that you apply to any solutions you open, you can exclude items from coverage results as you work with them.
When you already have coverage data collected, you can choose to exclude a specific node from the coverage tree (and optionally create a permanent coverage filter). As soon as you do this, dotCover will instantly recalculate coverage statistics.
Multiple report formats
dotCover helps process coverage data the way you need.
Exporting to several formats, including HTML, XML, JSON, and XML for NDepend enables you to share coverage reports with the rest of the team or pass coverage information to external services.
Code coverage for manual testing
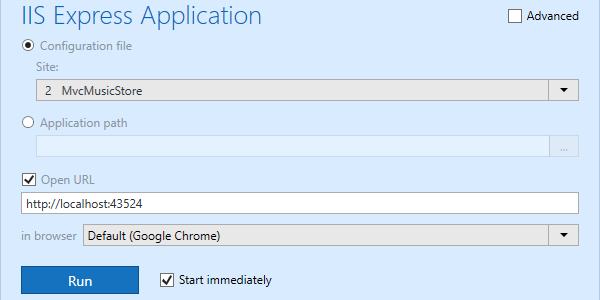
As an alternative to unit test coverage, dotCover can run coverage analysis upon .NET applications executed from Visual Studio.
This enables a QA engineer to execute a use-case scenario and examine what parts of the code where actually executed during this use-case. Saving and merging coverage snapshots supports executing non-trivial test cases.

Coverage analysis as part of Continuous Integration
dotCover is a great fit with Continuous Integration servers, most prominently JetBrains' own product, TeamCity.
First of all, via TeamCity add-in to Visual Studio, dotCover is able to obtain coverage data from a TeamCity server — without running coverage analysis on a local machine.
On the other hand, dotCover coverage analysis engine is bundled with into a free version of TeamCity, which helps schedule coverage runs as part of Continuous Integration process and generate server-side coverage reports. TeamCity understands the output of dotCover console runner and highlights its errors and warnings in the build log.