dotMemory Features
dotMemory is a .NET memory profiler that can be launched right from Visual Studio, used as a plugin in JetBrains Rider, or used as a standalone tool.
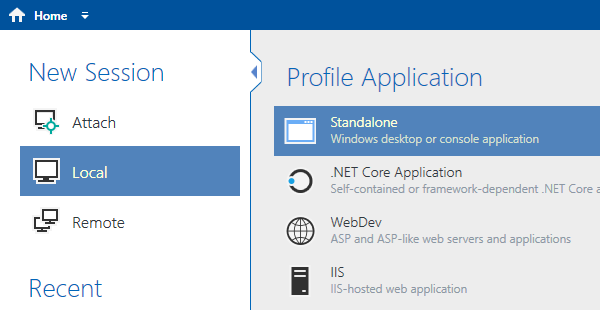
Support for various .NET applications
dotMemory lets you profile applications based on any supported version of .NET Framework, .NET Core, .NET, ASP.NET web applications, IIS, IIS Express, Windows services, Universal Windows Platform applications, and more. On macOS and Linux, dotMemory can be used only as part of JetBrains Rider or as a command-line profiler.
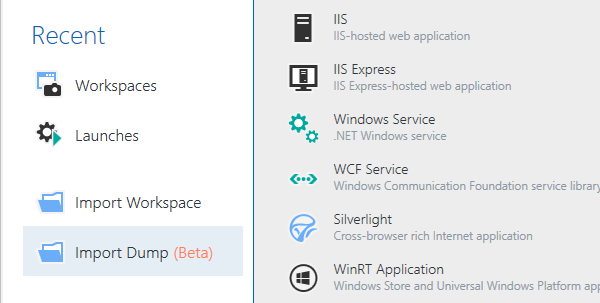
Support for raw memory dumps
dotMemory lets you import raw Windows memory dumps obtained using the Task Manager or Process Explorer, and analyze them as regular memory snapshots. By doing so, you can take advantage of automatic inspections, retention diagrams, and other sophisticated dotMemory features.
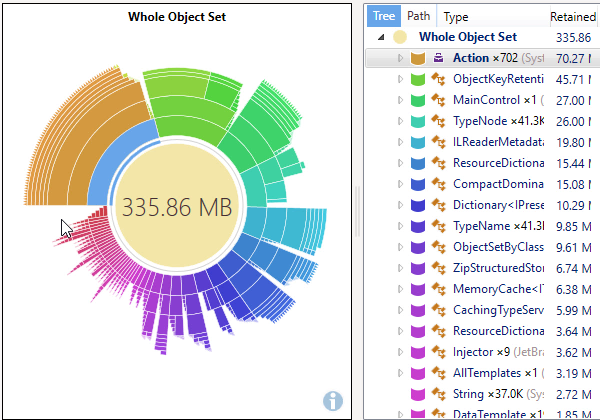
Sunburst diagram
Understanding of how memory is retained in your application is essential in order to successfully optimize it. In this view, the hierarchy of dominators (objects that exclusively retain other objects in memory) is shown on a sunburst chart.
Just a quick look at the chart allows you to find out what objects are crucial for your application and evaluate the largest structures: the more memory a dominator retains, the larger the central angle.
To get the retention path of the particular dominator click on the corresponding arc. Double-click on a dominator will zoom in the chart allowing you to see the objects retained by this dominator in more details.
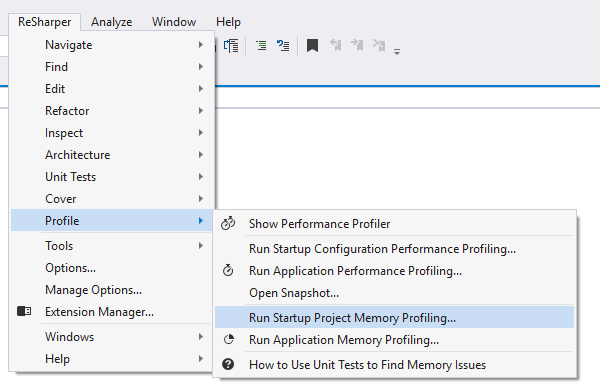
Visual Studio and Rider integration
dotMemory is integrated with JetBrains Rider, allowing you to do real-time memory allocation tracking, allocation analysis for specified time intervals, and much more. You can also start a memory profiling session from Visual Studio whenever necessary.
Later on, you can navigate from a type in a dotMemory object set to the type's declaration in Visual Studio.
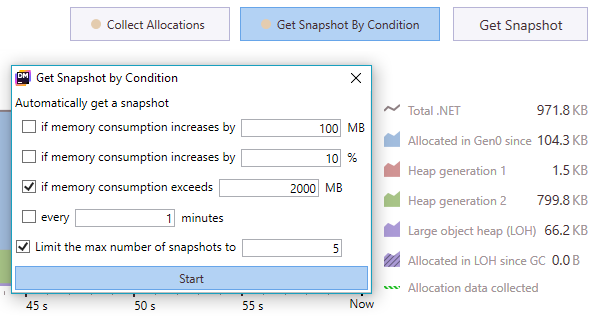
Automatic snapshots
Sometimes you may be interested in taking snapshots only when a certain condition is true. This is why dotMemory makes it possible to automate the process of getting snapshots. This is especially helpful when the memory consumption of your application is dramatically increased, or when taking a snapshot manually gets tricky. Simply set a particular condition and have snapshots collected automatically after the condition is satisfied.
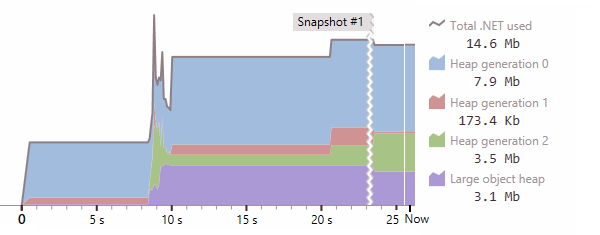
Timeline view with real-time data collection
Monitor memory consumed by your application, get snapshots and drop them to compare in one click.

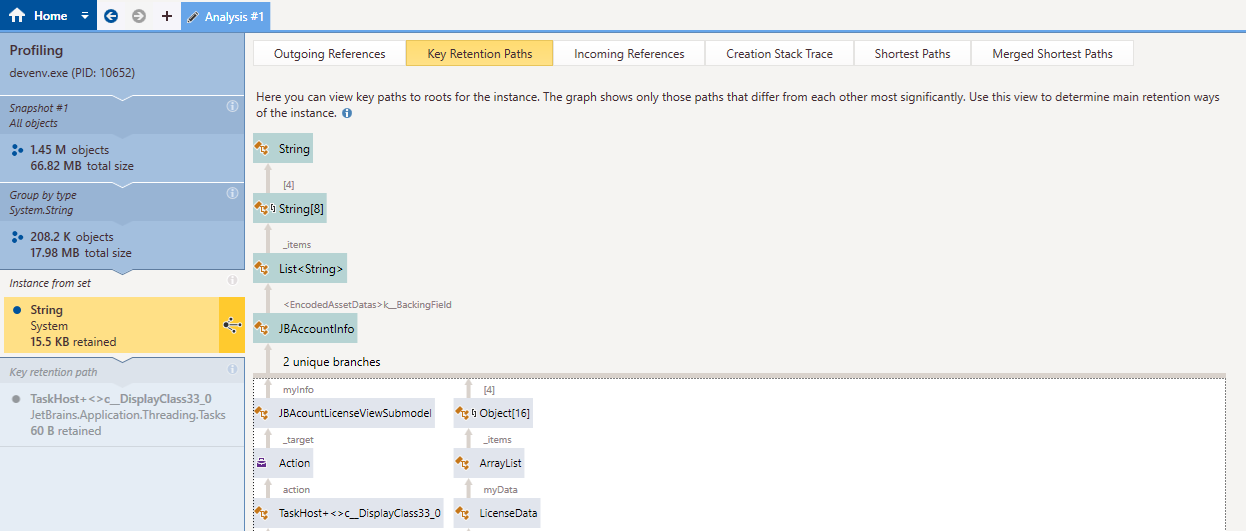
Multiple views on data
Examine objects in the heap from multiple views. Want to know how objects relate to each other? What objects do they reference and through what fields? Want to know which calls created these objects? No problem! dotMemory has a view for everything.

Comparing memory snapshots
Comparing two snapshots is the main way to find objects that are causing a memory leak. Use the comparison view to find out how many objects were created between snapshots and how many objects were collected.
Easy and comprehensive UI
While memory profiling has the reputation of being for pros only, dotMemory's unique user interface lowers that entry barrier dramatically and makes memory profiling straightforward. You simply move from top to bottom, from a set of objects down to particular instances, until you identify the real cause of memory issues.
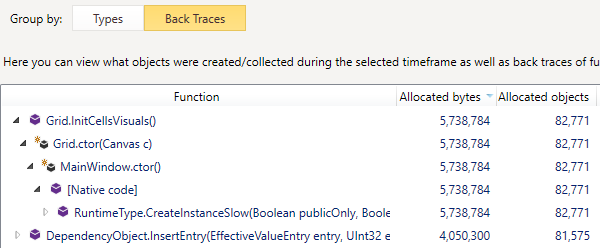
Analyzing memory traffic
Excessive allocations and garbage collections may imply significant memory management overhead. Use the traffic view to understand what objects are created/collected most intensively in your application and what functions are causing this memory traffic.
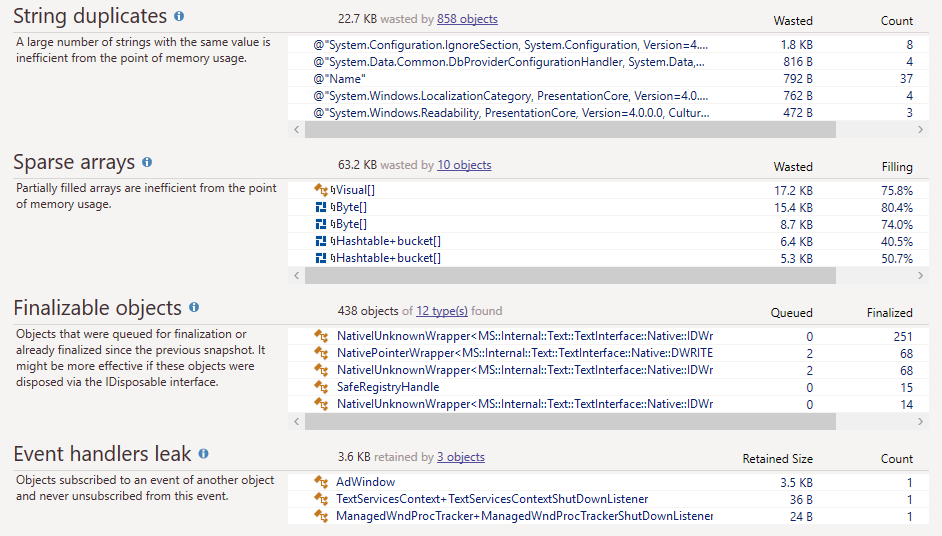
Powerful automatic inspections
dotMemory automatically scans your snapshot for common types of memory issues, such as string duplicates, sparse arrays, leaking event handlers or WPF bindings. These inspections can be a great starting point in analyzing a snapshot if you don't know where to begin.
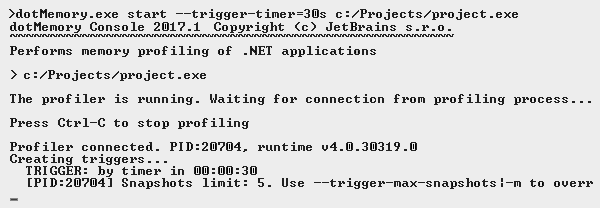
Command-line profiler
dotMemory comes bundled with the dotMemory.exe command-line profiler. Use this tool to automate profiling: make profiling a part of your continuous integration builds or simply speed up your profiling routines (e.g., if you have to regularly profile the same application and do not want to start the dotMemory user interface each time).