Visualize Code Coverage
To visualize coverage and test results data, dotCover can highlight statements in the current snapshot right in Visual Studio editor.
Visualize code coverage in the editor
Open the snapshot that you want to analyze in the Coverage Results Browser window or in the Unit Test Coverage window .
Click Highlight code
.png "Highlight code") on the toolbar of the window where the current snapshot is open.
on the toolbar of the window where the current snapshot is open.dotCover will highlight code in all assemblies that are included in the current coverage snapshot (see the gutter):

To disable highlighting of the current snapshot, press Control+Alt+K H or choose from the main menu
If you switch between several snapshots in the Coverage Results Browser window or in the Unit Test Coverage window , the highlighting does not switch automatically. To switch the highlighting for a particular snapshot, click Highlight code ![]() on the toolbar of the window where the current snapshot is open.
on the toolbar of the window where the current snapshot is open.
How the highlighting works
To indicate the state of the code statement, dotCover uses colored markers in the gutter of Visual Studio:
Marker | Description |
|---|---|
| Unit tests don't cover any statements in a line. |
| Unit tests don't cover at least one statement in a line. |
| Unit tests cover all statements in a line. All tests pass. |
| Unit tests cover all statements in a line. At least one test fails. |
Note that if you enable the Use shaped markers (colorblind mode) setting in dotCover's highlighting options, markers will indicate coverage and test results not only with color but also with their shape.
Right after you change the code, test results become outdated. In this case, a marker keeps its color but it becomes paler. The marker's tooltip shows the info about previous state as well:

If a line of code consists of a number of statements with different coverage results, dotCover will highlight the line taking into account only the "worst" result. For example, if tests for the first statement pass, but fail for the second, dotCover will highlight the line with the red color. Or, if one statement is covered by some failing tests and another statement is not covered at all, the marker will be grey:

If you prefer the "old-style" highlighting (as in dotCover 2016.2 and earlier) when a whole line of code was highlighted, you can toggle it via .

Navigating to covering tests
To continue exploring code coverage, you can navigate to covering tests and/or locate code items in the coverage tree.
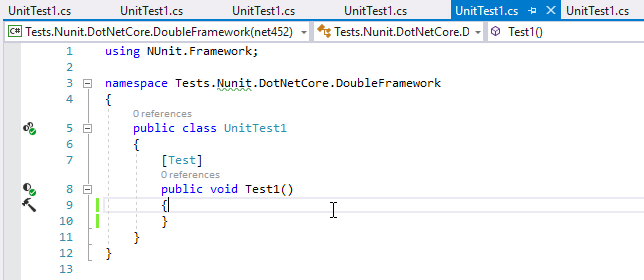
Visualizing code coverage in projects targeting multiple frameworks
If a project targets multiple frameworks, dotCover shows coverage results independently for each framework. Thus, the Coverage Tree shows each framework as a separate node. Code highlighting also depends on the context you select in the editor.