Debug Covering Tests
Once you have coverage data, you can use dotCover to quickly analyze the cause of failed tests:
Examine stack trace
View the stack trace of a failed test
Open the snapshot that you want to analyze in the Coverage Results Browser window or in the Unit Test Coverage window .
Select the desired test.
Select the Output tab on the right part of the window.
Note that there is a faster way of doing this operation if you use code coverage highlighting.
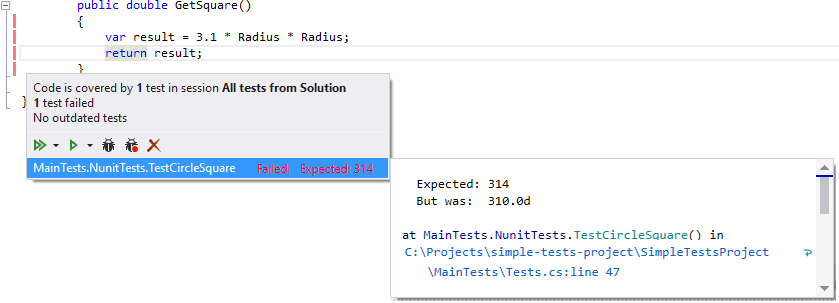
View the stack trace of a failed test (if highlighting is enabled)
In Visual Studio editor, find the line of code that leads to a failed test.
Click the highlighting marker in the left gutter.
In the list, select the desired test.
Click the arrow that stands after the test name.

Debug tests
If the code coverage highlighting is enabled, you can quickly set a breakpoint on a particular line and run debugging.
Set a breakpoint and run debugging
In Visual Studio editor, find the line of code that leads to a failed test.
Click the highlighting marker in the left gutter.
In the list, select the desired test.
Click the
 button.