Inspections View

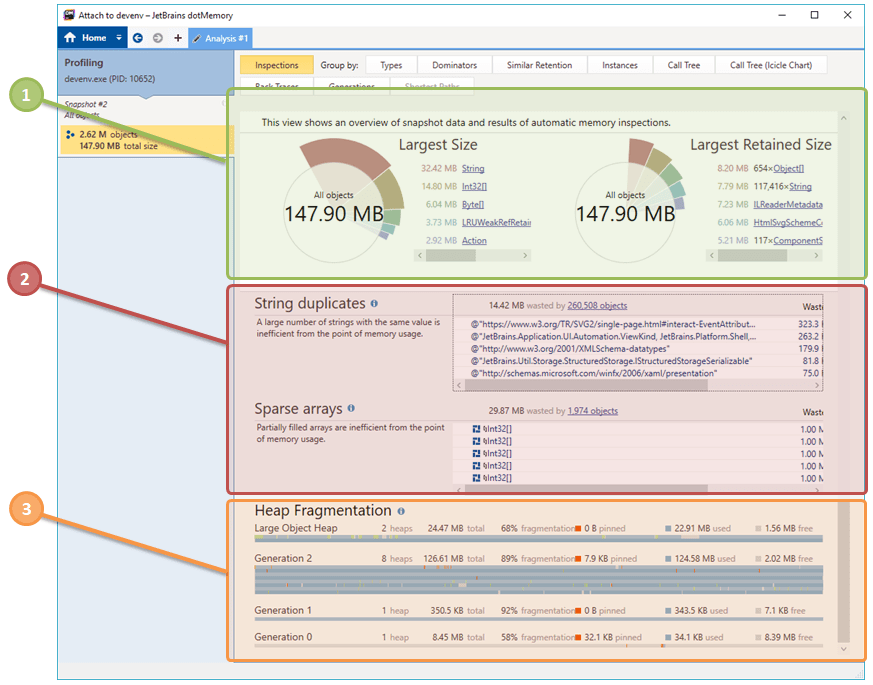
The view provides a brief overview on how things are going in the current snapshot.
![]() Largest Size Diagram
Largest Size Diagram
This diagram answers the question "What objects take the major part of memory in my app?" It shows how much memory is occupied by objects of a certain type. Clicking a certain item of the diagram will make it an analysis subject leading you to the Group by Types view.
Largest Retained Size Diagram
This diagram answers the question "What are the key objects in my application?" It shows the list of dominators - main objects that retain all other app objects in memory. Clicking a certain item of the diagram will make it an analysis subject leading you to the Group by Dominators view.
![]() Automatic Inspections
Automatic Inspections
To ease your life, dotMemory automatically checks the snapshot on most common types of memory issues. These inspections could be a great starting point in analyzing a snapshot if you don't know where to begin. Learn more in Automatic Inspections.
![]() Heap Fragmentation
Heap Fragmentation
This diagram shows the fragmentation of the managed heap segments: Generation 1, 2, and large object heap. Learn more in Heap Fragmentation.