Debug with PhpStorm: Ultimate Guide
This section provides a handful selection of tutorials that will help you get started with PHP debugging in PhpStorm.
Quick start
Set up the debugging engine
To start with any of the debugging scenarios, you need to have a debugging engine installed and configured in your PHP environment.
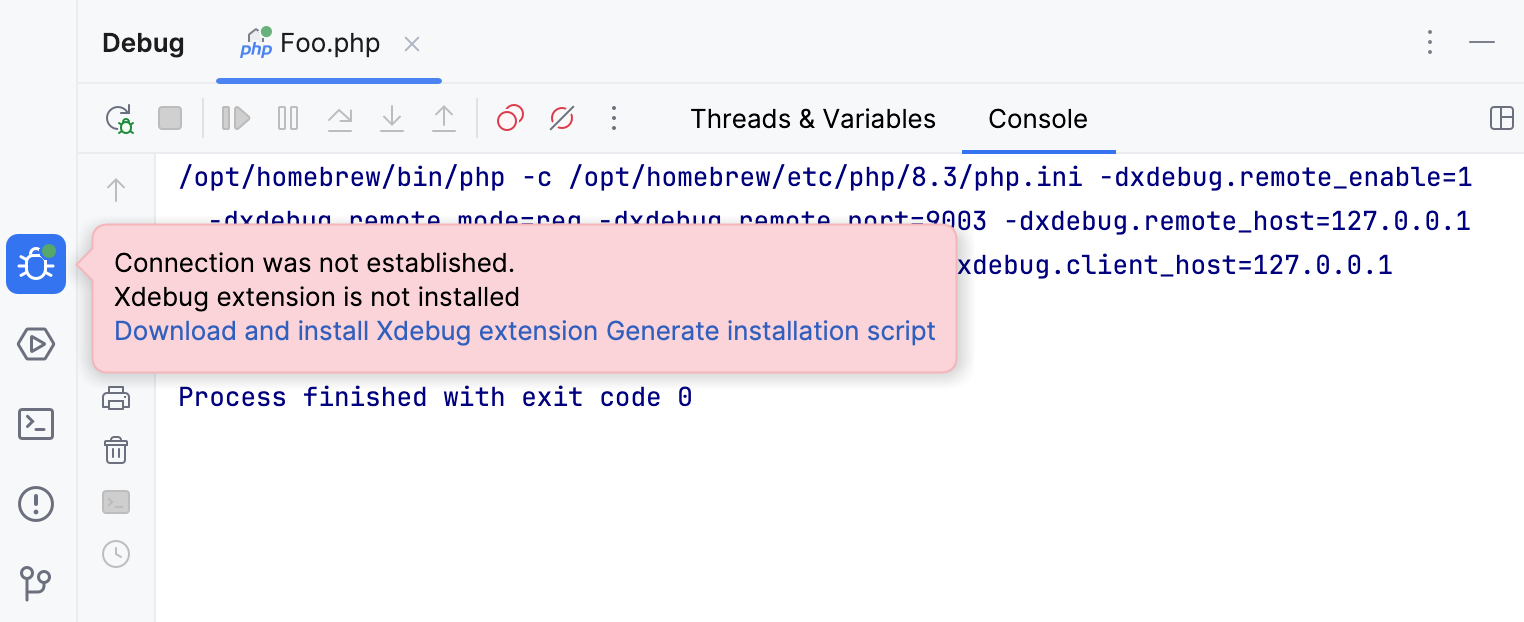
PhpStorm automates the process of getting Xdebug up and running. On your first attempt to run a debugging session without a debugger installed, the IDE will prompt you to download and install the relevant version of Xdebug.

Click Download and install Xdebug extension to have PhpStorm download Xdebug and modify the relevant PHP configuration file. If you want more control over the installation process, click Generate installation script and run the commands manually.
If you need to set up or troubleshoot your debugger tool installation manually, or want to use Zend Debugger instead of Xdebug, these tutorials will guide you through the process:
Install Xdebug (recommended)
Run a debugging session
With the debugging engine installed, you can start debugging by following the zero-configuration debugging approach:
Choose and install the browser extension suitable for your browser.
On the PhpStorm toolbar, toggle
to start listening for incoming PHP debug connections, or choose from the main menu.
Set a breakpoint in your code. Breakpoints can be set in the PHP context inside PHP, HTML, TWIG, BLADE, and files of other types. Line breakpoints can be set only on executable lines, but not on comments, declarations, or empty lines. For more information about getting started with Twig and Blade debugging, refer to Debug Twig templates and Debug Blade templates.
Start the debugging session in the browser using the installed browser extension.
During a debugging session, examine the program state: see variable values, evaluate expressions, step through the program, and so on.
Debugging a PHP web application
Depending on your environment, you can debug your PHP Web application locally or remotely.
Local debugging | Remote debugging |
|---|---|
The debugging engine and PhpStorm are running on the same machine. | The debugging engine is running on a remote environment (for example, a remote server or a virtual machine). |
Follow the Zero-configuration debugging procedure. |
|
Debugging a PHP CLI script
Depending on your environment, you can debug your PHP CLI script locally or remotely.
Local debugging | Remote debugging |
|---|---|
The debugging engine and PhpStorm are running on the same machine. | The debugging engine is running on a remote environment (for example, a remote server or a virtual machine). |
Follow the Debug a PHP CLI script procedure. |
|
Besides running an entire application, you may want to run a PHPUnit or Behat test that covers a specific class, function or scenario, with the debugging engine attached. For more information, refer to Debug tests from the editor.
Troubleshooting
When using Xdebug or Zend Debugger with PhpStorm, some misconfiguration can prevent the debugger from working. In the Troubleshooting guide, you will find the description of some common issues and learn how to troubleshoot them.
Advanced debugging scenarios
The following topics will assist you in exploring the advanced debugging scenarios in PhpStorm: