Debug your first Python application
Finding out the origin of the problem
Remember, in the previous tutorial you've created and run the Car script? Let’s play a little more with it.
Run the script, accelerate the car once, and then brake it twice by typing the corresponding commands in the Run tool window:

Now press o followed by Enter to show the car's odometer:

The script is telling us that the car has travelled 0 kilometers! It's an unexpected result, because we've pushed the accelerator once, so the car should have covered some distance. Let's debug the code to find out the reason for that.
To start debugging, you have to set a breakpoint first. The debugger will stop just before executing the line with the breakpoint, and you will be able to examine the current state of the program.
The car's odometer is set on line 15, so let's put a breakpoint there. Click the line number in the gutter:

Next, click the ![]() icon in the gutter, next to the
icon in the gutter, next to the main clause, and choose Debug 'car'.

PyCharm starts a debugging session and shows the Debug tool window.

Press a followed by Enter to accelerate the car. The debugger will execute the script and stop at the breakpoint. The Threads & Variables tab of the Debug tool window will open. Expand self to examine the current values of the variables:

Click ![]() (Step Over) on the debugger toolbar, to execute the line with the breakpoint. Note that the value of
(Step Over) on the debugger toolbar, to execute the line with the breakpoint. Note that the value of odometer becomes 5, and line 16 is now highlighted in the editor, as it's going to be executed next:

Now click ![]() (Resume) and switch to the Console tab in the Debug tool window. Instruct the car to brake by pressing
(Resume) and switch to the Console tab in the Debug tool window. Instruct the car to brake by pressing b followed by Enter. Go back to the Threads & Variables tab and examine the variables. Note that speed is 0 at the moment.

Click ![]() and brake again (
and brake again (b + Enter). Now, let's switch to the Threads & Variables tab and analyze what's going to happen next:

You can see, that the value of odometer is 5, and the value of speed is -5. That's why when we resume the execution, odometer will become 0. You can click ![]() on the toolbar to make sure that it happens.
on the toolbar to make sure that it happens.
So the reason for an unexpected result is the negative value of the speed variable.
Fixing the problem
To avoid running into the same problem again, let's update the brake of Car so that it doesn't decrease speed to negative values.
Select the statement self.speed -= 5 in the brake method and then press Ctrl+Alt+T ():

Select if to add a condition to the statement.
PyCharm creates a stub if construct, leaving you with the task of filling it with the proper contents.

Type self.speed >= 5. We've specified in the code, that the brake method should only deduct 5 from speed when it's greater or equals 5:

What about the speeds lower than 5? When you brake a slowly moving car in real life, it just stops. Let's specify that in the code.
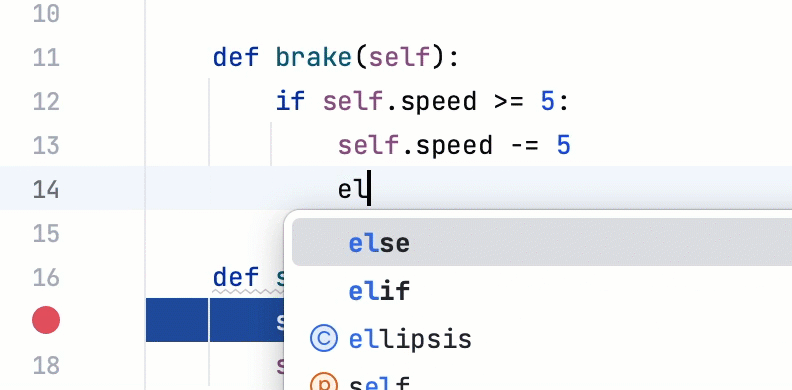
Add a new line after the last line of the brake method and start typing el.... PyCharm offers you to insert else. Push Enter to insert it, the indentation will be fixed automatically:
Now add self.speed = 0 to specify that the car should stop. Here's the updated code of the brake method:
Let's Run again to check whether we've managed to fix the problem. Accelerate the car, then brake it twice, and check the odometer:

Now we are getting the expected and correct result.
Debugging in detail
The Debug tool window consists of dedicated panes for frames, variables, and watches, as well as the Console tab, where all the input and output information is displayed. If you want the console to be always visible, you can drag it to one of the PyCharm window's edges.
Stepping
If you want to see what your code does line by line, there's no need to put a breakpoint on every line, you can step through your code.
Let's see what it looks like to step through our example program. Start or restart the debugger by using the Run widget at the top of the window:

In the debugger console that opens, press a to accelerate the car. The debugger will stop at the breakpoint.
We can use the stepping toolbar buttons to choose on which line we'd like to stop next.

For example, click the Step Over button ![]() and see the blue marker moving to the next line of code:
and see the blue marker moving to the next line of code:

Keep clicking ![]() until you are on
until you are on action = input("What should I do? [A]ccelerate, [B]rake, " "show [O]dometer, or show average [S]peed?").upper().
Now, if you click the Step Into button![]() , you will see that the debugger goes into the file parse.py:
, you will see that the debugger goes into the file parse.py:

However, if you continue using ![]() , you'll see that your application just continues to the next loop:
, you'll see that your application just continues to the next loop:

If you want to concentrate on your own code, use the Step Into My Code button ![]() . Thus you'll avoid stepping into library classes.
. Thus you'll avoid stepping into library classes.
For more information, refer to Stepping toolbar and Step through the program.
Watching
PyCharm allows you to watch any variable. Just type the name of the variable you want to watch in the Evaluate expression or add a watch field under the toolbar on the Threads & Variables tab. For example, my_car.time. Note that code completion is available here. Then click ![]() at the right edge of the field.
at the right edge of the field.

Then go to the Console tab and type any command, for example, b.
When you go back to the Threads & Variables tab, you'll see the current value of my_car.time:

For more information, refer to Watches.
Inline debugging
You may have noticed another PyCharm feature that makes it easy to see what your code is doing: the inline debugger. As soon as you press any breakpoint, PyCharm shows you the value of many of your variables right in the editor:

This inline debugging feature is enabled by default. If you don't see the inline debugging values, check that it's enabled in the debugger settings. Click ![]() on the debugger toolbar and select Debugger Settings. Make sure that Show Variable Values in Editor is enabled.
on the debugger toolbar and select Debugger Settings. Make sure that Show Variable Values in Editor is enabled.

Summary
So, you've done it! Congrats! Let's repeat what you've done with the help of PyCharm:
Found out the origin of the problem
Set breakpoints
Stepped through your program
Created a watch
Evaluated an expression