Monitoring the Debug Information
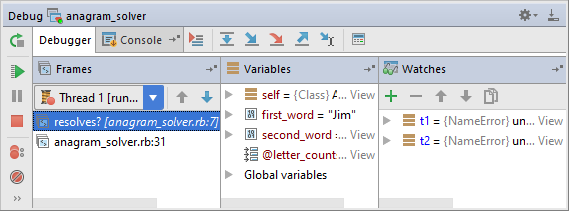
Information of a debugging session is displayed in the dedicated tabs of the Debug tool window, named after the selected run/debug configuration.
For each session, use the Console tab or Interactive Console tab to view the debugger messages and application output, and the Debug tab to monitor threads and frames.

See Also
Last modified: 18 July 2017