React
React is a JavaScript library for building complex interactive User Interfaces from encapsulated components. Learn more about the library from the React official website.
WebStorm integrates with React providing assistance in configuring, editing, linting, running, debugging, and maintaining your applications.
Before you start
Make sure you have Node.js on your computer.
Make sure the JavaScript Debugger plugin is enabled in the settings. Press Ctrl+Alt+S to open the IDE settings and then select . Click the Installed tab. In the search field, type JavaScript Debugger. For more information about plugins, refer to Managing plugins.
Create a new React application
The recommended way to start building a new React single page application is create-react-app package, which WebStorm downloads and runs for you using npx. As a result, your development environment is preconfigured to use webpack, Babel, ESLint, and other tools.
Of course, you can still download Create React App yourself or create an empty WebStorm project and install React in it.
Generate a React application with create-react-app
Click Create New Project on the Welcome screen or select from the main menu. The New Project dialog opens.
In the left-hand pane, choose React.
In the right-hand pane:
Specify The path to the folder where the project-related files will be stored.
In the Node Interpreter field, specify the Node.js interpreter to use. Select a configured interpreter from the list or choose Add to configure a new one.
From the create-react-app list, select npx create-react-app.
Alternatively, for npm version 5.1 and earlier, install the
create-react-apppackage yourself by runningnpm install --g create-react-appin the Terminal Alt+F12. When creating an application, select the folder where thecreate-react-apppackage is stored.Optionally:
To use TSX instead of JSX, select the Create TypeScript project checkbox. WebStorm will generate .tsx files for your application and a tsconfig.json configuration file.
When you click Create, WebStorm generates a React-specific project with all the required configuration files and downloads the required dependencies. WebStorm also creates an npm start and JavaScript Debug configurations with default settings for running or debugging your application.
Install React in an empty WebStorm project
In this case, you will have to configure the build pipeline yourself as described in Building a React application below. Learn more about adding React to a project from the React official website.
Create an empty WebStorm project
Click Create New Project on the Welcome screen or select from the main menu. The New Project dialog opens.
In the left-hand pane, choose Empty Project. In the right-hand pane, specify the application folder and click Create.
Install React in an empty project
Open the empty project where you will use React.
In the embedded Terminal (Alt+F12) , type:
npm install --save react react-dom
Start with an existing React application
To continue developing an existing React application, open it in WebStorm and download the required dependencies.
Open the application sources that are already on your machine
Click Open on the Welcome screen or select from the main menu. In the dialog that opens, select the folder where your sources are stored.
Check out the application sources from your version control
Click Get from VCS on the Welcome screen.
Alternatively, select or or from the main menu.
Instead of Git in the main menu, you may see any other Version Control System that is associated with your project. For example, Mercurial or Perforce.
In the dialog that opens, select your version control system from the list and specify the repository to check out the application sources from. For more information, refer to Check out a project (clone).
Download the dependencies
Click Run 'npm install' or Run 'yarn install' in the popup:

You can use npm, Yarn 1, or Yarn 2, refer to npm and Yarn for details.
Alternatively, select Run 'npm install' or Run 'yarn install' from the context menu of package.json in the editor or in the Project tool window.
Project security
When you open a project that was created outside WebStorm and was imported into it, WebStorm displays a dialog where you can decide how to handle this project with unfamiliar source code.

Select one of the following options:
Preview in Safe Mode: in this case, WebStorm opens the project in a preview mode. It means that you can browse the project's sources but you cannot run tasks and script or run/debug your project.
WebStorm displays a notification on top of the editor area, and you can click the Trust project link and load your project at any time.
Trust Project: in this case, WebStorm opens and loads a project. That means the project is initialized, project's plugins are resolved, dependencies are added, and all WebStorm features are available.
Don't Open: in this case, WebStorm doesn't open the project.
Learn more from Project security.
Code completion
WebStorm provides code completion for React APIs and JSX in JavaScript code. Code completion works for React methods, React-specific attributes, HTML tags and component names, React events, component properties, and so on. Learn more from the React official website.
To get code completion for React methods and React-specific attributes, you need to have the react.js library file somewhere in your project. Usually the library is already in your node_modules folder.
Complete React methods, attributes, and events
By default, the code completion popup is displayed automatically as you type. For example:

In JSX tags, WebStorm provides coding assistance for React-specific attributes, such as className or classID, and non-DOM attributes, such as key or ref. Moreover, auto-completion also works for names of classes defined in the project’s CSS files:

All React events, such as onClick or onChange, can also be completed automatically together with curly braces ={} or quotes "".

By default, curly braces are inserted. You can have WebStorm always add quotes or choose between quotes or braces based on the type from a TypeScript definition file (d.ts). To change the default setting, open the Settings dialog (Ctrl+Alt+S) , go to and select the applicable option from the Add for JSX attributes list.

Completion also works for JavaScript expressions inside curly braces. This applies to all the methods and functions that you have defined:

Complete HTML tags and component names
WebStorm provides code completion for HTML tags and component names that you have defined inside methods in JavaScript or inside other components:

Completion also works for imported components with ES6 style syntax:

Complete component properties
WebStorm provides code completion for component properties defined using propTypes and resolves them so you can quickly jump or preview their definitions:

When you autocomplete the name of a component, WebStorm adds all its required properties automatically. If some of the required properties are missing in the usage of a component, WebStorm warns you about that.
Transfer HTML attributes to JSX
When you copy a piece of HTML code with class attributes or on-event handlers and paste it into JSX, WebStorm automatically replaces these attributes with React-specific ones (className, onClick, onChange, and so on.)

This also works for TSX:

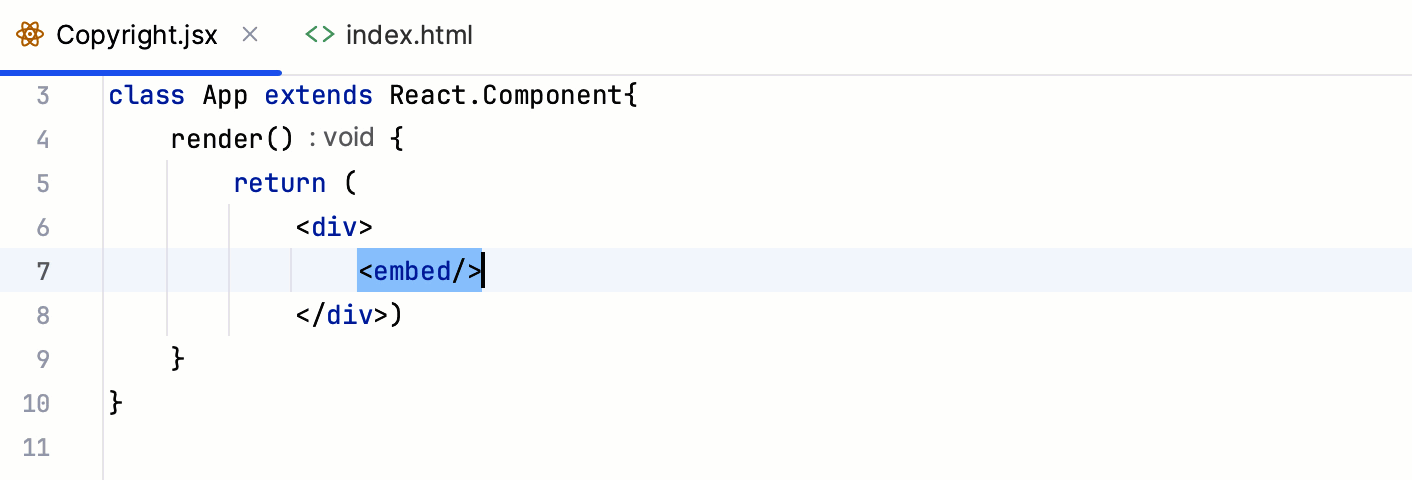
If the code fragment you paste contains a single tag, WebStorm automatically adds a slash / at the end of it.
To copy HTML code to JSX or TSX as is, use Paste Simple Ctrl+Alt+Shift+V or open the Settings dialog (Ctrl+Alt+S) , go to , settings page and clear the Convert HTML when pasting into JSX files (convert attributes, close single tags) checkbox.
React code snippets
WebStorm comes with a collection of more than 50 code snippets that expand into different statements and blocks of code often used in React apps, including React Hooks. The example below shows how you can use the rcjc abbreviation to create a class that defines a new React component:

Create a React code construct from a snippet
Type the required abbreviation in the editor and press Tab.
Press Ctrl+J and choose the relevant snippet. To narrow down the search, start typing the abbreviation and then select it from the completion list.
For more information, refer to Live Templates.
View the list of all available React snippets
In the Settings dialog (Ctrl+Alt+S) , click Live Templates under Editor, and then expand the React or React hooks node.

Emmet in JSX
With WebStorm, you can use Emmet not only in HTML but also in your JSX code taking advantage of some special React twists. For example, the abbreviation div.my-class expands in JSX to <div className=”my-class"></div> but not to <div class=”my-class"></div> as it would in HTML:

Navigate through a React application
Besides the basic navigation, WebStorm helps you jump between React-specific code elements.
To jump to the declaration of a method or a JavaScript expression inside curly braces
{}, select the method or expression and press Ctrl+B.To jump to the declaration of a component, select the component name and press Ctrl+B.
To view component definition, press Ctrl+Shift+I. Learn more from Definition and type definition.

To view quick documentation for a component, press Ctrl+Q. Learn more from JavaScript documentation look-up.


Lint a React application
All the WebStorm built-in code inspections for JavaScript and HTML also work in JSX code. WebStorm alerts you in case of unused variables and functions, missing closing tags, missing statements, and much more.

For some inspections WebStorm provides quick-fixes, for example, suggests adding a missing method. To view the quick-fix popup, press Alt+Enter.
To customize the list of inspections, open the Settings dialog (Ctrl+Alt+S) , go to Editor | Inspections, and disable the inspections you don’t want to see or change their severity levels. Learn more from Disabling and enabling inspections and Change inspection severity.
ESLint
Besides providing built-in code inspections, WebStorm also integrates with linters, such as ESLint, for JSX code. ESLint brings a wide range of linting rules that can also be extended with plugins. WebStorm shows warnings and errors reported by ESLint right in the editor, as you type. With ESLint, you can also use JavaScript Standard Style as well as lint your TypeScript code.
For more information, refer to ESLint.
To have ESLint properly understand React JSX syntax, you need eslint-plugin-react. With this plugin, you are warned, for example, when the display name is not set for a React component, or when some dangerous JSX properties are used:

Install and configure ESLint in a React project
In the built-in Terminal (), type:
npm install --save-dev eslint npm install --save-dev eslint-plugin-reactAdd a ESLint configuration file .eslintrc.* to your project. This can be a .eslintrc, .eslintrc.json, or .eslintrc.yaml file, or a file in another supported format. For more information, refer to the ESLint official website.
In the Settings dialog (Ctrl+Alt+S) , go to Languages & Frameworks | JavaScript | Code Quality Tools | ESLint, and select Automatic ESLint configuration. WebStorm will automatically locate ESLint in your project node_modules folder, and then use the default configuration from .eslintrc.* file or from
eslintConfigproperty in a package.json.Alternatively, select Manual ESLint configuration to use a custom ESLint package and configuration.
See Activating and configuring ESLint in WebStorm for details.
Example of .eslintrc structure (ESLint 1.x with react plugin)
In the
ecmaFeaturesobject, add"jsx" = true. Here you can also specify additional language features you’d like to use, for example, ES6 classes, modules, and so on.In the
pluginsobject, addreact.In the
rulesobject, you can list ESLint built-in rules that you would like to enable, as well as rules available via the react plugin.{ "parser": "babel-eslint", "env": { "browser": true, "es6": true, "jest": true }, "rules": { "arrow-parens": ["error", "as-needed", { "requireForBlockBody": true }], "react/jsx-props-no-spreading": "off", "react/jsx-sort-props": ["error", { "reservedFirst": ["key"] }], "react/require-default-props": "off", "react/sort-prop-types": "error", "react/state-in-constructor": ["error", "never"], "semi-spacing": "warn" }, "overrides": [ { "files": [ "sample/**", "test/**" ], "rules": { "import/no-unresolved": "off" } } ] }
Learn more about ESLint and react plugin configuration from the ESLint official website.
Code refactoring in a React application
Besides the common WebStorm refactorings, in a React application you can also run Rename for React components and use Extract Component to create new components.
Rename a component
Below is an example of renaming a component that is defined and used in only one file:

In the same way, you can rename components defined in one file and then imported to another file using a named export:

Place the caret within the component name and press Shift+F6 or select from the main menu of from the context menu.
Specify the new component name in compliance with React naming conventions.
Rename a state value
When you rename a state value, WebStorm suggests renaming the corresponding setter (the function that updates this state value in a React useState hook).

Place the caret within the name of the state value and press Shift+F6 or select from the main menu of from the context menu.
Specify the new value name and press Enter. The focus moves to the setter where the new name of the value is suggested. Press Enter to accept the suggestion.
Extract a component
You can create a new React component by extracting the JSX code from the render method of an existing component. The new component can be defined as a function or as a class, refer to Function and Class Components on the React official website.

Select the code you want to extract and choose from the context menu.
Alternatively, go to in the main menu or press Ctrl+Alt+Shift+T and select Extract Component from the popup.
In the dialog that opens, specify the name of the new component and its type. By default, a functional component is created. If you want to define the new component as a class, select Class.
Click OK. The new component will be defined next to the existing one and used in it.
Optionally: use the Move Symbol refactoring to move the new component and all the required imports to a separate file.
Optionally: modify the code templates that WebStorm uses for new components. In the Settings dialog (Ctrl+Alt+S) , go to , open the Code tab, and update the templates as necessary using the Apache Velocity template language.
Convert a function to a class component
With the Convert to Class Component refactoring, WebStorm generates a ES6 class with the name of the function which you want to convert. This class extends React .Component and contains a render() method where the function body is moved. Learn more from the React official website.

Place the caret anywhere inside the function to convert and select from the main menu or from the context menu.
Alternatively, press Ctrl+Alt+Shift+T and select Convert to Class Component from the popup.
Convert a class to a functional component
With the Convert to Functional Component refactoring, WebStorm generates a function with the name of the class which you want to convert and moves the contents of the render() method to the function body.

Place the caret anywhere inside the class to convert and select from the main menu or from the context menu.
Alternatively, press Ctrl+Alt+Shift+T and select Convert to Functional Component from the popup.
Destructuring in a React application
Destructuring lets you easily unpack values from arrays and objects into variables. This functionality has a very concise syntax that is often used when you need to pass data in your application.
When working with React class components, consider using the Introduce object/array destructuring intention action. Learn more from Destructuring in JavaScript.

Run a React application
Сlick
 in the gutter next to the
 startscript in package.json, or runnpm run startin the Terminal Alt+F12, or double-click thestarttask in the npm tool window ().
Wait till the application is compiled and the development server is ready.
The Run tool window or the Terminal shows the URL at which your application is running. If your application was generated with create-react-app, the default URL is http://localhost:3000/. Click this link to view the application.

Run a React application via a run/debug configuration
For applications created with create-react-app in the WebStorm New Project wizard as described above, WebStorm generates an npm configuration with the default name npm start. This configuration runs the react-scripts start command that launches the development server and starts your application in the development mode.
In other cases, you need to create a run/debug configuration with the actual settings, such as, host, port, etc., manually.
Create an npm run/debug configuration
Go to . Alternatively, select Edit Configurations from the list on the toolbar.

In the Edit Configurations dialog that opens, click the Add button (
 ) on the toolbar and select npm from the list.
 In the Configuration tab of the Run/Debug Configurations: npm dialog that opens, specify the location of the package.json, the Node.js interpreter, and the package manager to use.
In the Command field, select run from the list and then select the script to run from the Scripts list. Most likely it will be the default
startscript but you can configure another one in your package.json, for example, to run the application on a custom port.
Optionally:
To open the application in the browser, update the configuration as follows: in the Browser / Live Edit tab, select the After launch checkbox, select the browser to open the application in, and specify the URL address at which the application wil run.
If you are going to debug the application, select Google Chrome or another Chromium-based browser.

Run an application
Select the npm start run configuration from the list on the toolbar and click
 next to it.
Wait till the application is compiled and the development server is ready.
The Run tool window or the Terminal shows the URL at which your application is running. Click this link to view the application.
Alternatively, enable WebStorm to open the application on start as described above.
Debug a React application
You can start a debugging session either by launching a run/debug configuration or from the Run tool window that shows the URL at which your application is running in the development mode.
Start debugging via a run/debug configuration
To debug your React application you need two run/debug configurations:
An npm configuration to start your application in the development mode, as described above.
A JavaScript Debug configuration to attach the debugger to the application that is running in the development mode.
You can create a JavaScript Debug configuration within the npm configuration to launch them at once, as described in Run and debug a React application with an npm run/debug configuration.
Alternatively, create and launch an npm and a JavaScript Debug run/debug configurations separately, as described in Start debugging with a JavaScript Debug run/debug configuration.
Run and debug a React application with a single npm run/debug configuration
Set the breakpoints in your code.
Create an npm configuration as described above.
If you generated your application with
create-react-app, WebStorm has already created an npm configuration with the default name npm start. The configuration is available from the Run widget and in the Run/Debug Configurations dialog.In the Configuration tab of the Run/Debug Configurations: npm dialog that opens, specify the location of the package.json, the Node.js interpreter, and the package manager to use.
In the Command field, select run from the list and then select the script to run from the Scripts list. Most likely it will be the default
startscript but you can configure another one in your package.json, for example, to run the application on a custom port.In the Browser / Live Edit tab, select the After launch checkbox, select Google Chrome or another Chromium-based browser from the list, select the with JavaScript debugger checkbox, and then specify the URL at which your application will run.

Click Run.
To re-run the configuration, select it from the list in the Run widget and click
next to it.WebStorm runs the application in the development mode and at the same time launches a debugging session.

When the first breakpoint is hit, switch to the Debug tool window and proceed as usual: step through the program, stop and resume program execution, examine it when suspended, explore the call stack and variables, set watches, evaluate variables, view actual HTML DOM, and so on.
Start debugging with a JavaScript Debug run/debug configuration
Set the breakpoints in your code.
Start the application in the development mode as described above and wait till the application is compiled and the development server is ready.
The Run tool window or the Terminal shows the URL at which your application is running. Copy this URL to specify it later in the JavaScript Debug configuration.

Create a JavaScript Debug configuration. To do that, go to in the main menu, click
, and select Javascript Debug from the list.In the Run/Debug Configurations: JavaScript Debug dialog that opens, specify the name of the configuration and the URL address at which the application is running in the development mode. You can copy this URL in the Run tool window or in the Terminal, as described above.

Click Debug.
To re-run the configuration, select it from the list in the Run widget and click
 next to it.
When the first breakpoint is hit, switch to the Debug tool window and proceed as usual: step through the program, stop and resume program execution, examine it when suspended, explore the call stack and variables, set watches, evaluate variables, view actual HTML DOM, and so on.
Start debugging from the Run tool window or from the built-in Terminal
If your application is running in the development mode on localhost, in particular, if it was generated with create-react-app, you can launch a debugging session right from the >Run tool window or from the built-in Terminal.
Set the breakpoints in your code.
Start the application in the development mode as described above and wait till the application is compiled and the development server is ready.
The Run tool window or the Terminal shows the URL at which your application is running. Hold Ctrl+Shift and click this URL link. WebStorm starts a debugging session with an automatically generated configuration of the type JavaScript Debug.

When the first breakpoint is hit, switch to the Debug tool window and proceed as usual: step through the program, stop and resume program execution, examine it when suspended, explore the call stack and variables, set watches, evaluate variables, view actual HTML DOM, and so on.
Build a React application
You need to set up the build process if you installed React in an existing WebStorm project. Learn about various ways to configure a build pipeline for your React application from React official website.
Test a React application
You can run and debug Jest tests in React applications created with create-react-app. Before you start, make sure the react-scripts package is added to the dependencies object of your package.json.
You can run and debug Jest tests right from the editor, or from the Project tool window, or via a run/debug configuration. For more information, refer to Jest.
Run a test from the editor
Click
or  in the gutter and select Run <test_name> from the list.
You can also see whether a test has passed or failed right in the editor, thanks to the test status icons
 and
and  in the gutter.
Create a Jest run/debug configuration
Open the Run/Debug Configuration dialog ( in the main menu), click
in the left-hand pane, and select Jest from the list. The Run/Debug Configuration: Jest dialog opens.Specify the Node interpreter to use and the working directory of the application. By default, the Working directory field shows the project root folder. To change this predefined setting, specify the path to the desired folder.
In the Jest package field, specify the path to the react-scripts package.
In the Jest options field, type
--env=jsdom.
Run tests
Select the Jest run/debug configuration from the list of configurations and click
 in the list or on the toolbar.
Monitor test execution and analyze test results in the Test Runner tab of the Run tool window. For more information, refer to Explore test results.
Debug tests
Select the Jest run/debug configuration from the list on the main toolbar and click
to the right.In the Debug tool window that opens, proceed as usual: step through the tests, stop and resume test execution, examine the test when suspended, run JavaScript code snippets in the Console, and so on.
Known limitations
When you open an application during a debugging session for the first time, it may happen that some of the breakpoints in the code executed on page load are not hit. The reason is that to stop on a breakpoint in the original source code, WebStorm needs to get the source maps from the browser. However, the browser can pass these source maps only after the page has been fully loaded at least once. As a workaround, reload the page in the browser yourself.