Running and debugging Node.js
PhpStorm helps you run and debug your Node.js applications. You can debug applications that are started from PhpStorm as well as attach to already running applications.
Before you start
Make sure the JavaScript and TypeScript, JavaScript Debugger, and Node.js required plugins are enabled on the Settings | Plugins page, tab Installed. For more information, refer to Managing plugins.
Run a Node.js application
PhpStorm runs Node.js applications according to a run configuration of the type Node.js. PhpStorm also uses this configuration to start the debugger together with Node.js applications.
Create a Node.js run/debug configuration
Go to . Alternatively, select Edit Configurations from the Run widget on the toolbar.

In the Edit Configurations dialog that opens, click the Add button (
 ) on the toolbar and select Node.js from the list. The Run/Debug Configuration: Node.js dialog opens.
Specify the Node.js runtime to use.
If you choose the Project alias, PhpStorm will automatically use the project default interpreter from the Node runtime field on the JavaScript Runtime page . In most cases, PhpStorm detects the project default runtime and fills in the field itself.
You can also choose another configured local or remote interpreter or click
 and configure a new one.
In the File field, specify the path to the main file of the application that starts it (for example, bin/www for Express applications).
Optionally:
Specify the Node parameters that customize the start of Node.js. For example, you may want to enable an experimental Node.js feature or pass another option. For more information, refer to the Node.js official website.
In the Application parameters field, specify the Node.js-specific arguments to be passed to the application on start through the process.argv array.
To open the application in the browser automatically, configure a before-launch task. Click
 to expand the Before launch area, click , and select Launch Web Browser from the list. In the dialog that opens, specify the URL of the application starting page, for example,
 localhost:3000for Express applications, and the browser to use.
Run an application
Create a run/debug configuration as described above or modify an existing one and click Run in the dialog.
Alternatively, select the newly created run configuration from the list on the main toolbar and click
 .
. 
The application starts, and the Run tool window opens showing the application output.
If you are using a logging tool like morgan in your application and this tool writes logs to a file, you can see these logs in the Console tab of the Run tool window.
Manage logs when running a Node.js application
Create a Node.js run/debug configuration as described above and go to the Logs tab.
Click
next to the Log files to be shown in console field which lists the available log files (if any).In the Edit Log Files Aliases dialog that opens, type the alias name to show in the list of log entries and specify the location of the log file. Select whether you want to show all files that this pattern covers or only the last one.
Click OK to return to Node.js Run/Debug Configuration dialog, where the new log file is added to the list. Select the Is Active checkbox next to it. To skip the previous content, select the Skip Content checkbox.
Optionally:
To enable saving the Process Console output to a log file, select the Save console output to file checkbox and specify the file location.
Choose when you want the Process Console shown.
Debug a Node.js application
PhpStorm makes it easier to debug Node.js applications. You can put breakpoints right in your JavaScript or TypeScript code so you no longer need any debugger and console.log() statements. You can do many things that will help you explore the code and understand where the bug is. In the Debug tool window, you can view the call stack and the variables in their current state, evaluate expressions in the editor, and step through the code.
You can initiate a debugging session in two ways:
Start the debugger together with your application using a Node.js run/debug configuration.
Attach the debugger to an already running application. In this case, your application is already running in the debug mode and PhpStorm attaches to a running process.
PhpStorm recognizes
--inspect,--inspect-brk, and now deprecated--debugflags so you can make any application accessible for debugging.To debug a running application, use an Attach to Node.js/Chrome configuration.
With PhpStorm, you can also debug Node.js applications that are running in Vagrant boxes, in Docker containers, or on remote hosts accessible via various transfer protocols or via SSH.
Start the debugger together with a Node.js application on your computer
Set the breakpoints in the code where necessary.
Create a Node.js run/debug configuration as described above.
To open the application in the browser automatically, configure a before-launch task. Click
to expand the Before launch area, click , and select Launch Web Browser from the list. In the dialog that opens, specify the URL of the application starting page, for example, localhost:3000for Express applications, and the browser to use.From the Run widget list on the toolbar, select the newly created Node.js configuration and click
 next to it.
The Debug tool window opens.
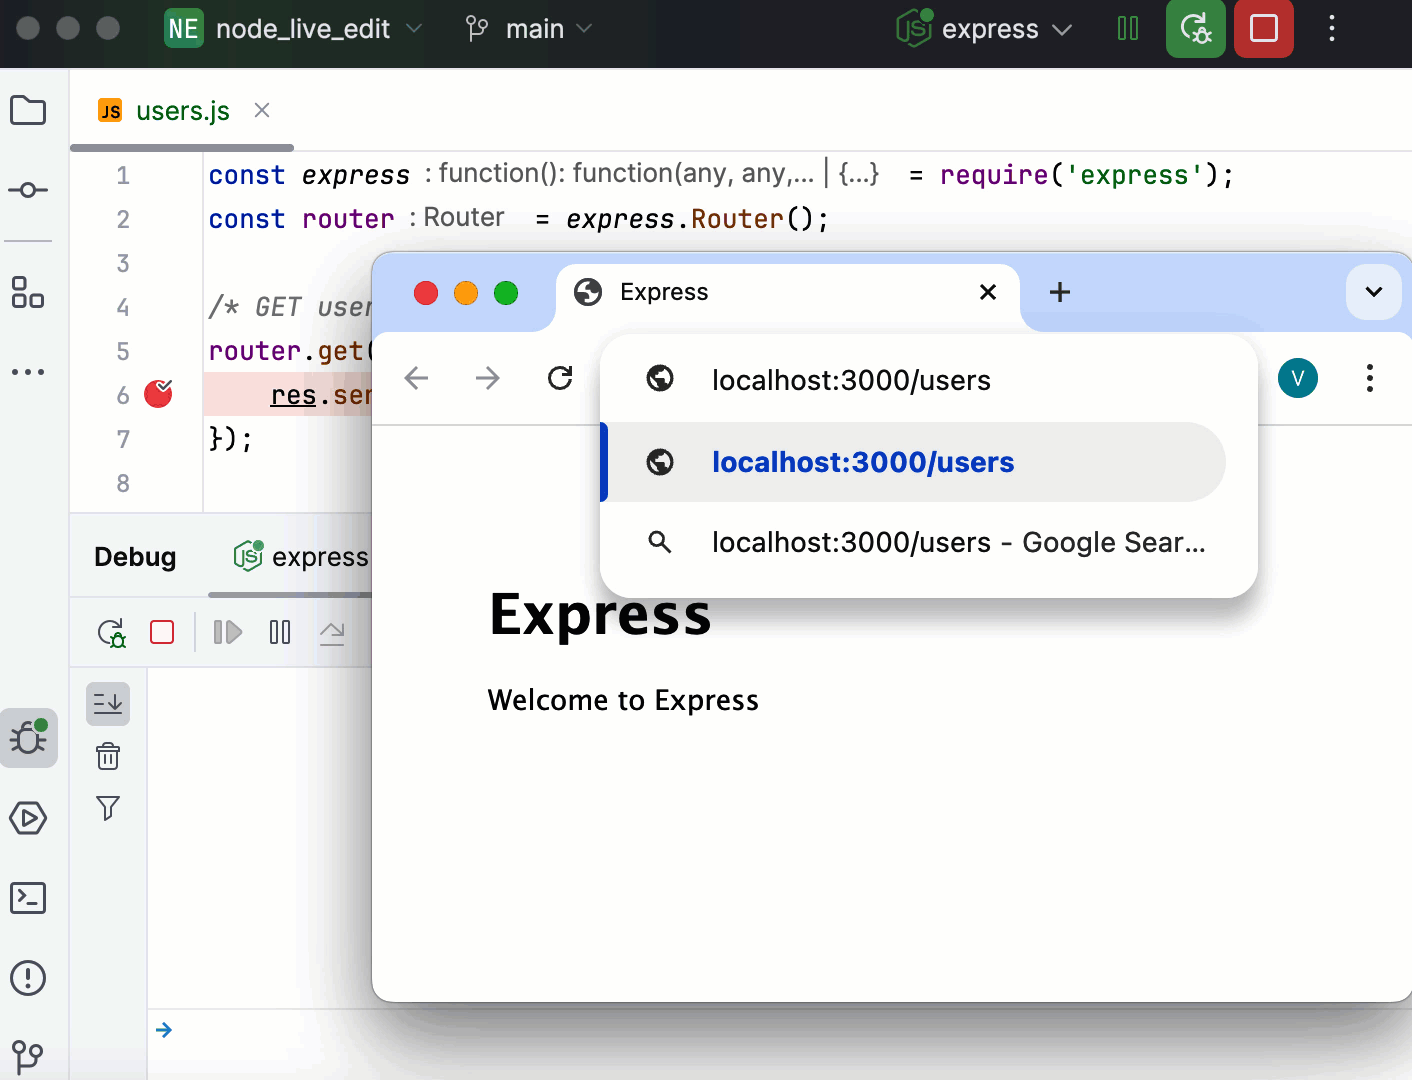
Perform the steps that will trigger the execution of the code with the breakpoints. For example, navigate from the starting page of your application to another page in the browser.
Switch to PhpStorm, where the controls of the Debug tool window are now enabled. Proceed with the debugging session — step through the breakpoints, switch between frames, change values on-the-fly, examine a suspended program, evaluate expressions, and set watches.
Debug a running Node.js application
With PhpStorm, you can debug an application that is already running in the development mode, which means that the application was launched with the --inspect or --inspect -brk flag. A debugging session is initiated through an Attach to Node.js/Chrome configuration and uses the Chrome Debugging Protocol.
Start the debugger from the Run or Debug tool window or from the built-in Terminal
If an application was started with the --inspect or --inspect-brk flag, you can start a debugging session from the built-in Terminal, from the Run tool window, or from the Debug tool window.
Set the breakpoints as necessary.
Run your application with an
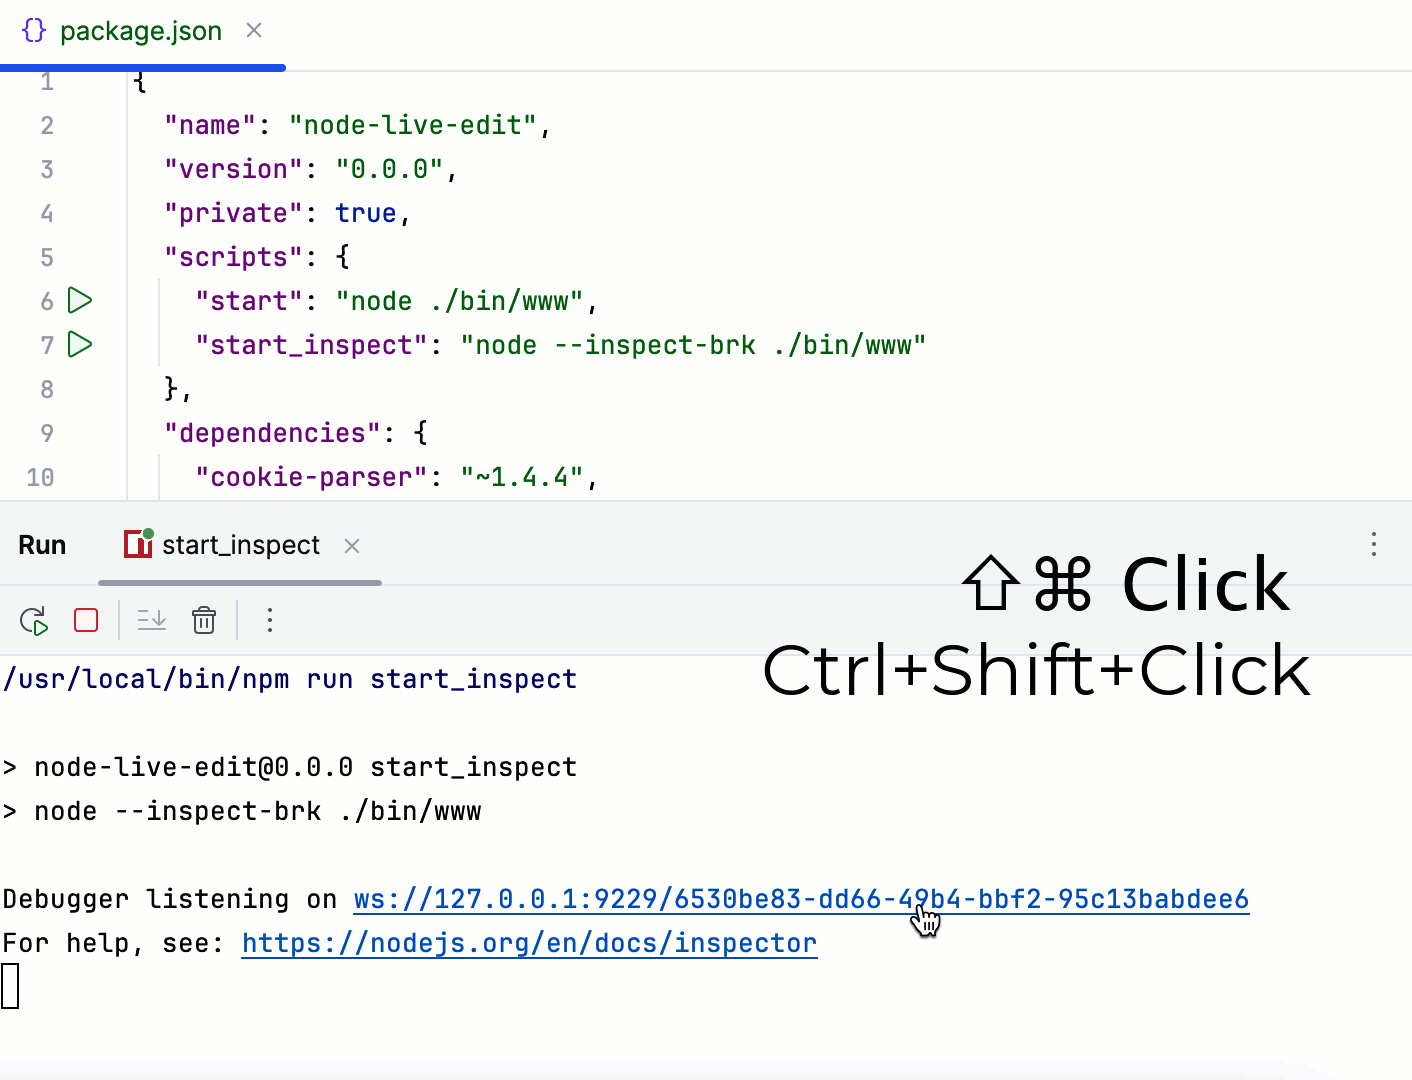
--inspector--inspect-brkflag. You can do that in several ways, for example:In your package.json, click
 in the gutter next to the script with the
 --inspector--inspect -brkflag and select Run '<script name>'. For more information, refer to Run scripts.
Open the embedded Terminal (Alt+F12) and, type:
node --inspect-brk <path to the starting page of your application relative to the project root>
The Terminal, the Run tool window, or the Console tab of the Debug tool window shows an information message
Debugger listening <host>:<port>, the default port is9229. To start debugging, hold Ctrl+Shift and click the link.PhpStorm starts a debugging session with an automatically generated Attach to Node.js/Chrome configuration. Perform the steps that will trigger the execution of the code with the breakpoints. For example, navigate from the starting page of your application to another page in the browser.
Attach the debugger to a running app via a run/debug configuration
Run your application with an
--inspector--inspect-brkflag, as described above.Set the breakpoints as necessary.
Go to in the main menu, then click
in the Edit Configuration dialog that opens, and select Attach to Node.js/Chrome from the list.
The Run/Debug Configuration: Attach to Node.js/Chrome dialog opens.
Specify the host where the target application is running and the port passed to
--inspector--inspect-brkwhen starting the Node.js process to connect to.
Copy the port number from the information message
Debugger listening <host>:<port>in the Terminal tool window or in the Run tool window that controls the running application.
From the Run widget list on the toolbar, select the newly created Attach to Node.js/Chrome configuration and click
next to it. The Debug tool window opens.Perform the actions that will trigger the code at the breakpoint. Control over the debugging session returns to PhpStorm.
Switch to PhpStorm. In the Debug tool window, step through the breakpoints, switch between frames, change values on-the-fly, examine a suspended program, evaluate expressions, and set watches.
Debug a Node.js application that uses nodemon
The PhpStorm built-in debugger can automatically reconnect to running Node.js processes. This lets you debug Node.js applications that use the nodemon utility, which automatically reloads your Node.js process when the code is updated.
To debug such application, you need to start it in the debug mode (with the --inspect or --inspect-brk flag) and then connect to it using the Attach to a Node.js/Chrome debug configuration with the Reconnect Automatically option on.
Install nodemon
In the embedded Terminal (Alt+F12) , type
npm install --save-dev nodemonoryarn add nodemon --devto install nodemon as a development dependency.
Start an application with nodemon in the debug mode
Create and run the following
npm debugscript:"debug": "nodemon --inspect <path_to_the_file_that_starts_your_application>For more information, refer to Running and debugging scripts.
Alternatively, pass the
inspectflag through a Node.js run/debug configuration as described above.
Debug an application
Set the breakpoints in your code as necessary.
Create a new Attach to a Node.js/Chrome configuration as described in Debugging a running Node.js application and select the Reconnect automatically checkbox.

Usually, you don’t need to change the port in the configuration
9229because it’s the default port the debugger is listening on. But you can double-check what port is used in the message logged when you run the app in the debug mode.
From the Run widget list on the toolbar, select the newly created Attach to Node.js/Chrome configuration and click
next to it. The debugger stops at the breakpoints that you put in your code in PhpStorm.Now, every time you make any changes to the code and save them Ctrl+S, nodemon will automatically reload the application, and the debugger will automatically re-attach to the restarted process.