dotTrace Features
dotTrace is a performance profiler for .NET applications that works right in Visual Studio / JetBrains Rider and provides great ways to detect and analyze performance bottlenecks. Read on for more details.
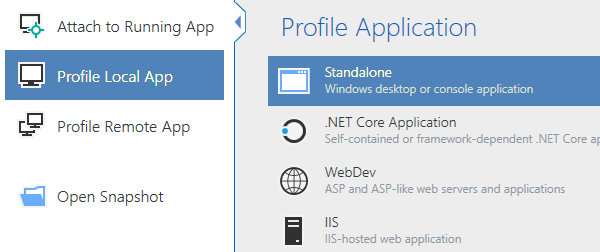
Profile all types of .NET applications
dotTrace helps you locate performance bottlenecks in a variety of .NET applications, including desktop applications, .NET Core, ASP.NET applications hosted on IIS or IIS Express web servers, Mono and Unity applications, WCF services, Windows services, Universal Windows Platform applications, and unit tests.
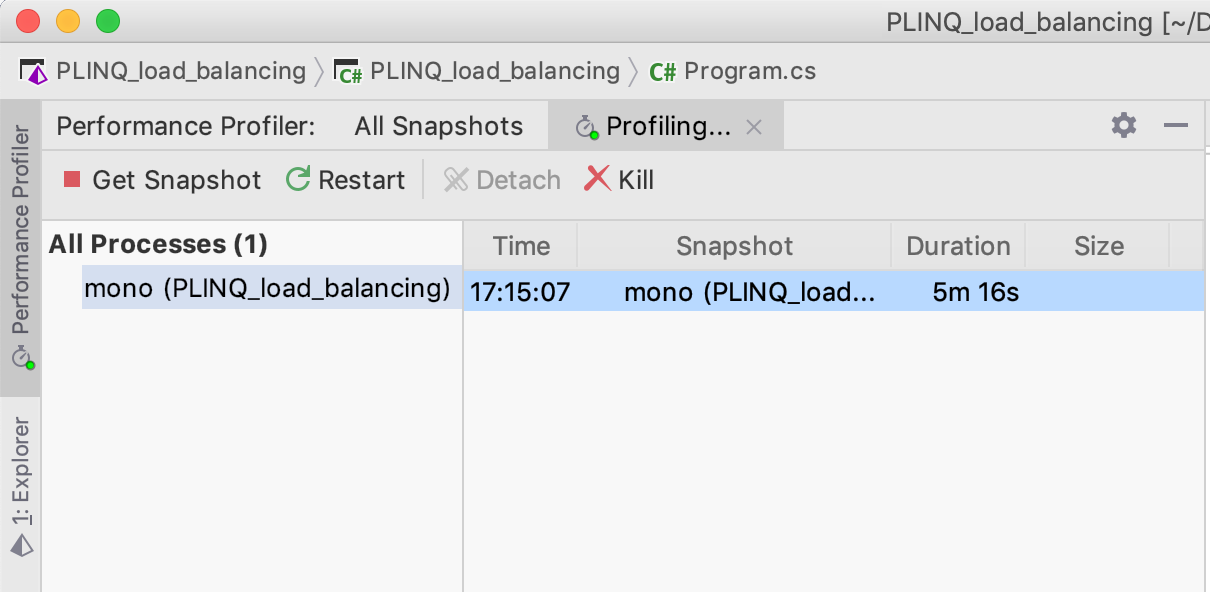
Works on Windows, macOS, and Linux
dotTrace lets you profile applications based on any supported version of .NET Framework, .NET Core, .NET, Mono 5.10 or later, and Unity 2018.3 or later.
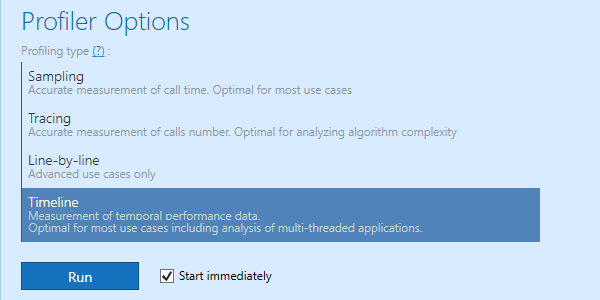
Timeline and more profiling modes
Unlike "classic" performance profiling that only lets you measure method call execution time, timeline profiling reveals how calls are distributed in time.
By virtue of binding method call data to a timeline, this profiling mode goes beyond plainly detecting the slowest method: it allows diagnosing performance issues where the order of events matters, such as UI freezes, excessive garbage collection, uneven workload distribution, inefficient file I/O, and more.
However, traditional profiling modes are still available in dotTrace. Sampling profiling is the easiest way to evaluate overall application performance, whereas tracing and line-by-line profiling modes are ideal when you need details on how a particular algorithm works inside.
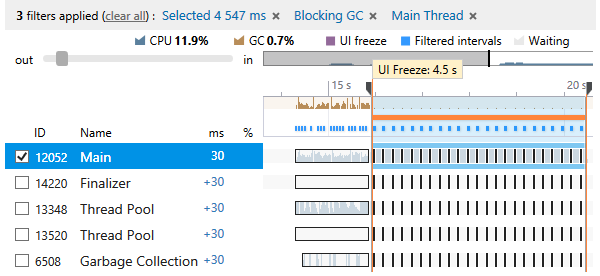
New profiling experience
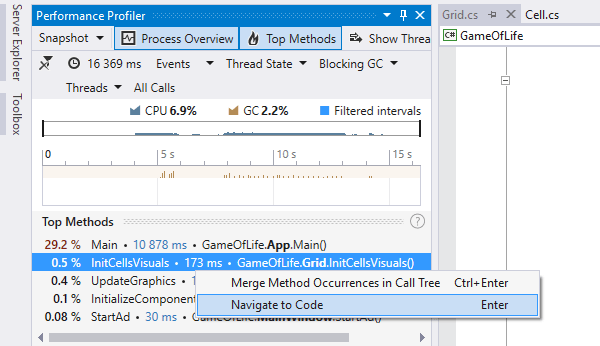
You can slice and dice profiling data using filters, the call tree, or diagrams. By applying filters, you get a set of time intervals selected by a specific condition. The way it works is very similar to executing a query on a database to get exactly the data you need.
For example, to find out whether a UI freeze is caused by blocking garbage collection, you can ask dotTrace to select all time intervals on the main thread where the UI freeze occurred and blocking GC was performed. As complex as this may sound, this filter combination is in fact toggled in just two clicks.
Deep Visual Studio and Rider Integration
dotTrace is integrated with Visual Studio, helping you start profiling the applications you’re currently working on without leaving the IDE. Using the dotTrace plugin in Rider, you can perform timeline-bound performance profiling, profile static methods, unit tests, running processes, remote applications, and more.
Its integration with Visual Studio and JetBrains Rider makes the profiling experience virtually seamless, as you no longer have to switch between your IDE and the profiler.
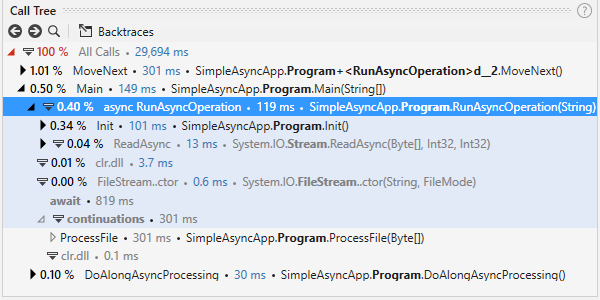
Profile async calls
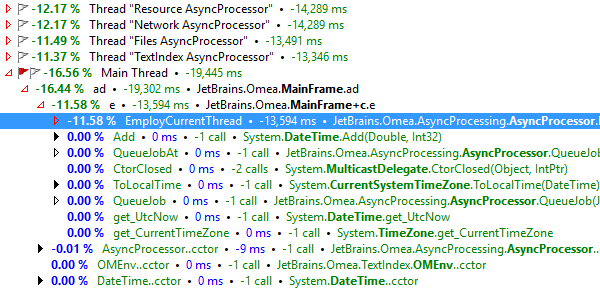
dotTrace allows you to easily analyse asynchronous code: All "parts" of an
async call are shown in one place, so that you don't need to search for them
in different call stacks.
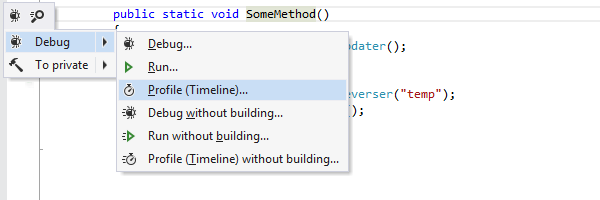
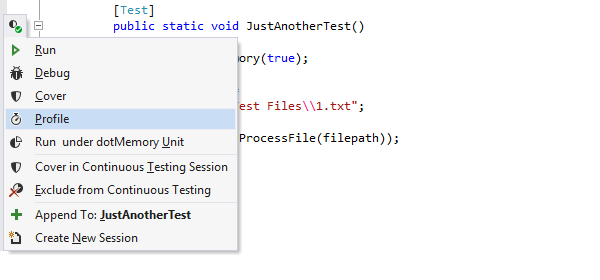
Profile static methods
dotTrace allows you to instantly profile any static method in your code. Simply place the caret on the method, press Alt+Enter, and select Debug | Profile in the action list.
Just imagine what this feature can do. You can profile any part of your code in place, right after you've written it! No need to build your solution, run it under the profiler, perform a usage scenario that runs your new code, etc.
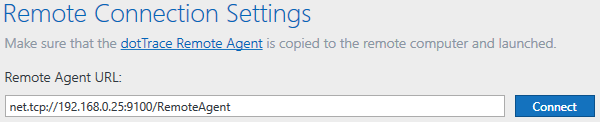
Profile remote applications
Most of the time, you need to profile applications running locally. However, what if you're faced with a lagging application on a remote web server?
dotTrace can connect to a remote machine to profile a standalone or web application, or a Windows service. You don't even have to install dotTrace there: just copy a few files.
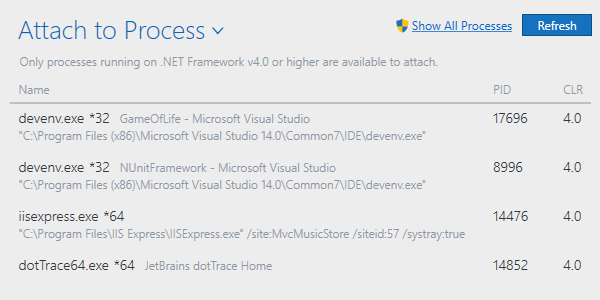
Connect to running applications
dotTrace can be attached to a running application for profiling, and detached as soon as profiling data has been captured.
This minimizes overhead imposed by running an application under the profiler. More importantly, it enables investigating performance issues in production environments where you just can't afford to restart an application every time you need to profile it.
Profile unit tests
If you have a Visual Studio + ReSharper* bundle or JetBrains Rider**, you can easily start profiling unit tests from the code editor or a unit test runner.
* Even if you don't have ReSharper installed, you can still profile a native unit test runner provided by NUnit, MSTest, or xUnit.
** Profiling features are available only for dotUltimate or All Products Pack license owners.
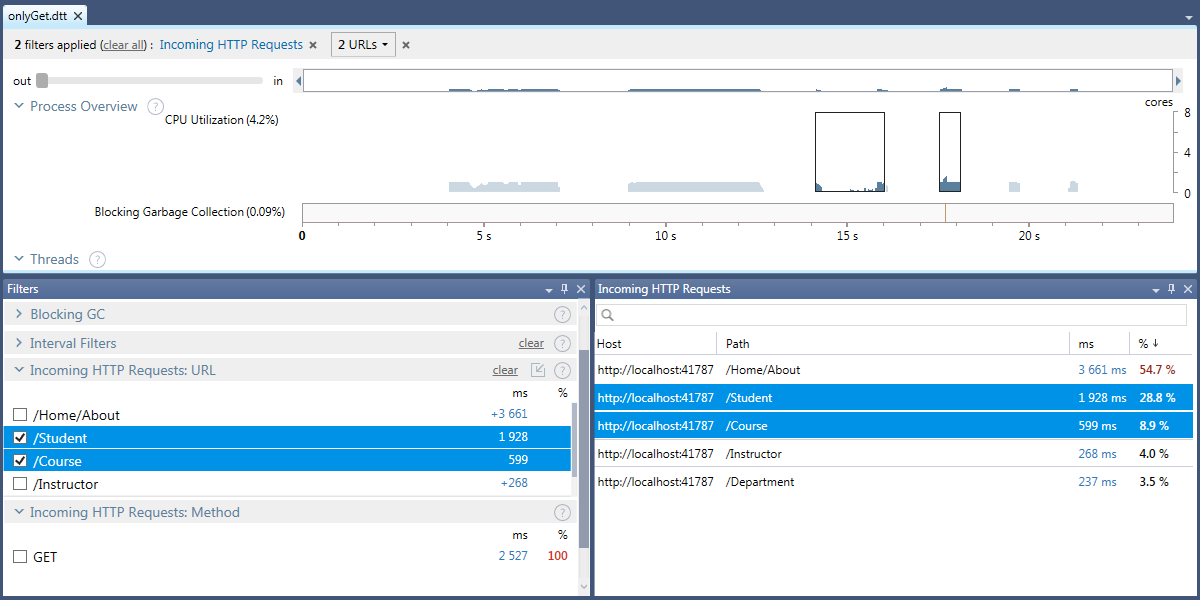
Analyze slow HTTP requests
When analyzing timeline profiling snapshots, you can filter out time intervals where your web application processes incoming HTTP requests. Get the exact data, determine the exact root cause and zero in on the methods that run slowly. Make your web applications faster with timeline profiling.
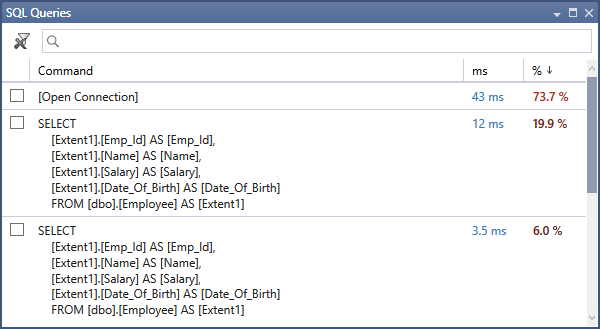
Analyze slow SQL queries
Use timeline profiling to analyze how each particular query affects application performance. The SQL Queries filter shows all SQL queries and SQL connections along with their performance statistics.
For your convenience, query contents can be opened in a separate window for further analysis. You can still filter all data by choosing one or multiple queries and investigate the methods they were executed from.
No more ineffective SQL queries!
Profiling SDK
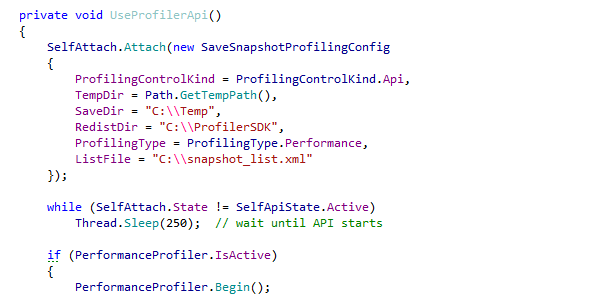
Profiling SDK allows you to control a profiling session right from your code: programmatically start and stop collecting profiling data, save collected snapshots and so on.
This enables two valuable usage scenarios. First, you can use the SDK to narrow down the profiling scope and choose which parts of your code to profile. The second usage scenario is self-profiled applications: you can collect statistics showing how your application behaves on end-user machines.
Continuous Integration support
dotTrace comes with command-line profiling tools that can be used to automate gathering profiling snapshots, which is essential if you want to make profiling a part of your Continuous Integration builds.
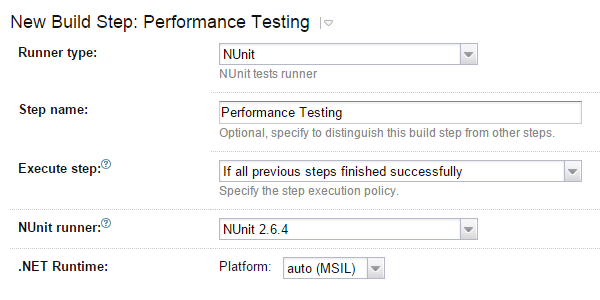
If you're using JetBrains TeamCity as your CI server, make sure to install dotTrace plugin to TeamCity. The plugin helps you prevent application performance regression by profiling integration tests. All you need is set a threshold for test execution time, and if it's exceeded, the plugin will automatically take performance snapshot and fail the test.
Estimation of performance gains
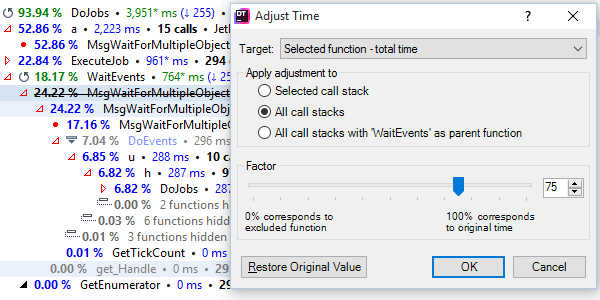
Sometimes, after hours of optimizing a time-consuming function, developers have to start profiling from scratch to see if their optimization actually worked.
This is not a problem with dotTrace. The profiler can recalculate all function timings in a snapshot instantly, based on a time adjustment that you set — without reprofiling your application. It's like asking the profiler: "what if I optimize this function by 40%?" Just specify the new time for a function or for all functions in a particular class. Time values for the entire snapshots will be recalculated.
Comparing snapshots
dotTrace is able to compare any two performance snapshots of the same application. It generates a comparison snapshot which shows the difference in the number of calls and times consumed by each function. Comparison snapshots can be viewed and analyzed the same way as regular performance snapshots.