What′s New in dotTrace
This page guides you through notable updates in recent dotTrace releases. Highlights include support for Visual Studio / JetBrains Rider and simplified profiling of async code.
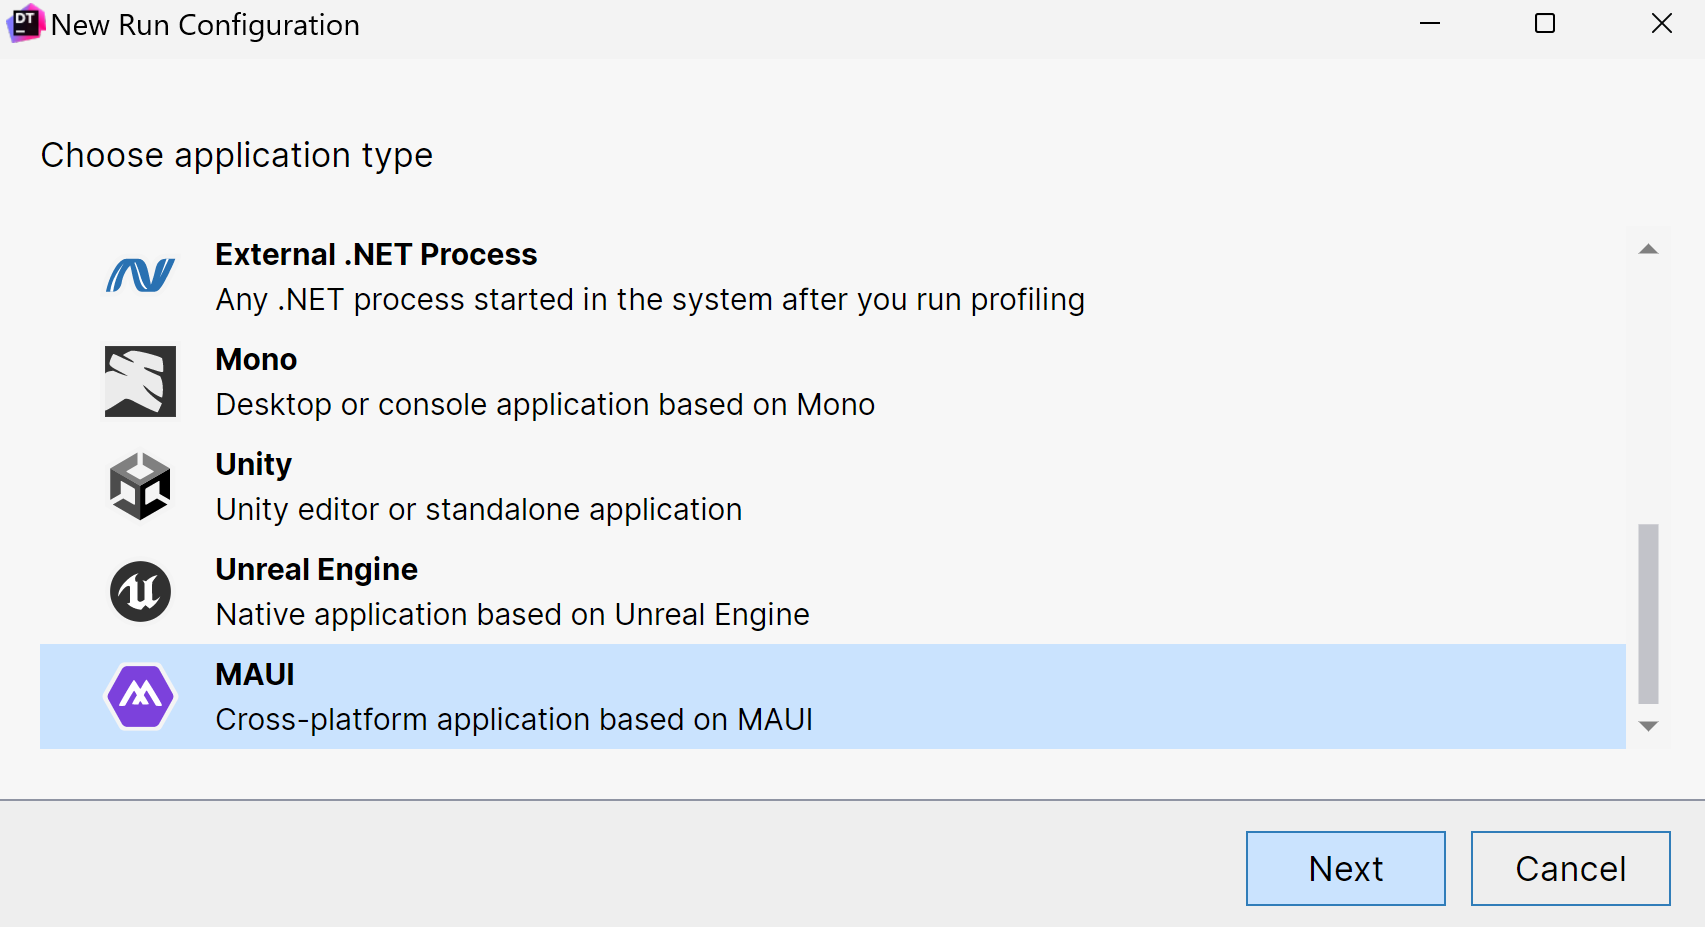
Support for MAUI applications 2024.1
Now, you can profile applications based on the MAUI framework.
Currently, dotTrace supports:
- macOS – Mac Catalyst applications targeting .NET 7.0+. Timeline profiling only.
- Windows – WinUI applications targeting .NET 7.0+. All profiling types are supported. Attaching to already running applications is available only for the Timeline and Sampling types.
The support is available for dotTrace standalone and dotTrace integrated into Rider and ReSharper.
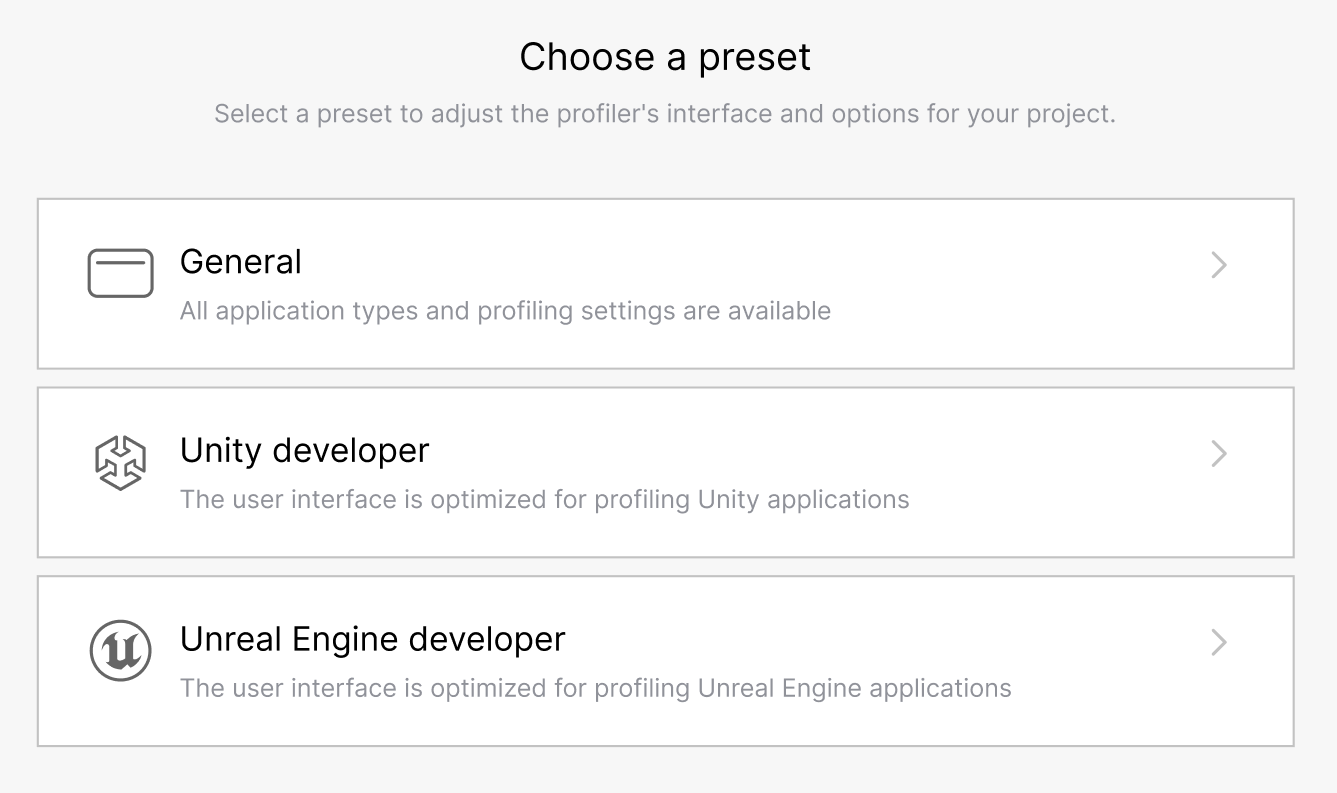
Profiling presets 2024.1
dotTrace now includes user interface (UI) presets. The presets adjust the UI to show only the profiling settings relevant to specific applications: General (all application types), Unity developer, and Unreal Engine developer.
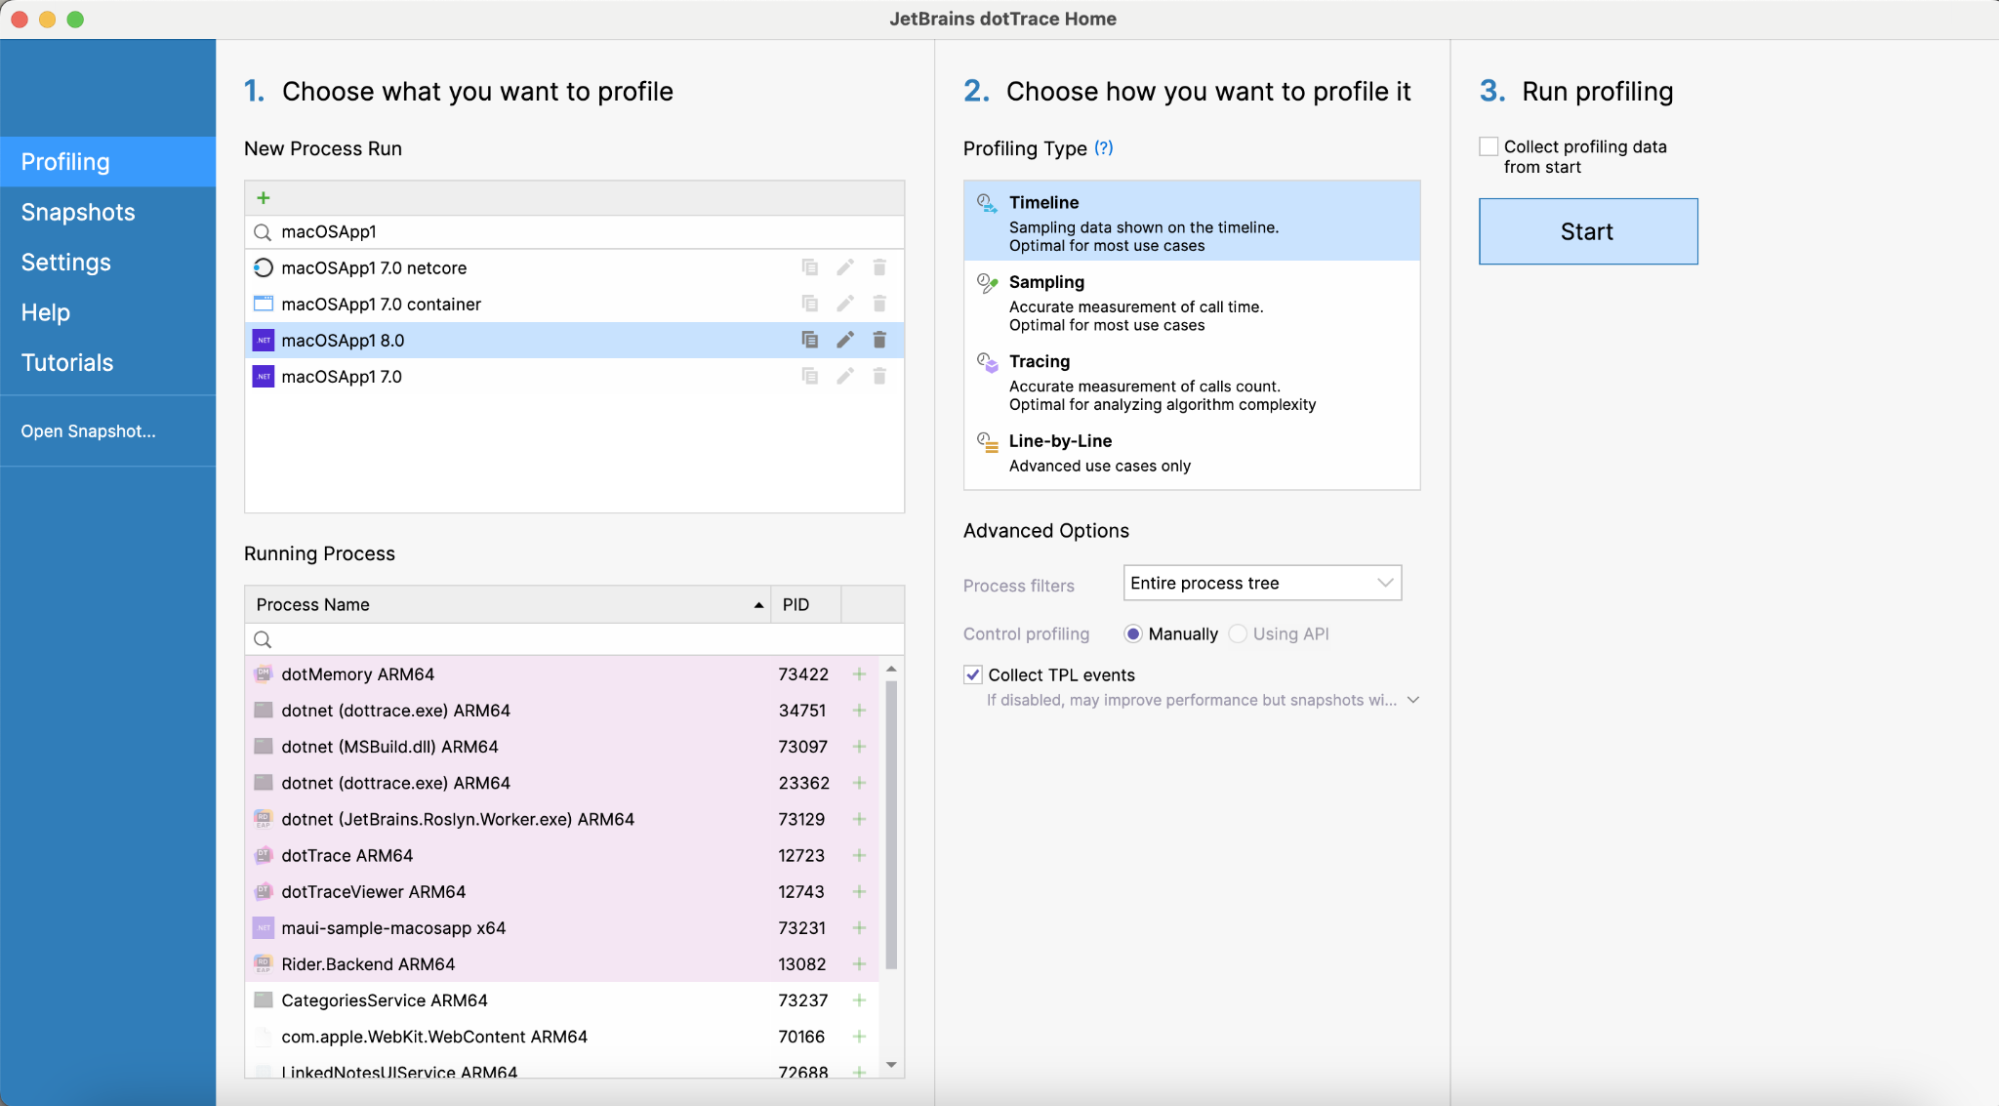
Improved support for macOS 2024.1
We improved profiling on macOS:
-
Now, the standalone version of dotTrace lets you specify application bundles
(
.app) instead of executable files. -
dotTrace in Rider can profile macOS run configurations. The following
target frameworks are supported:
net7.0-macos,net8.0-macos,net7.0-maccatalyst,net8.0-maccatalyst,Xamarin.Mac.
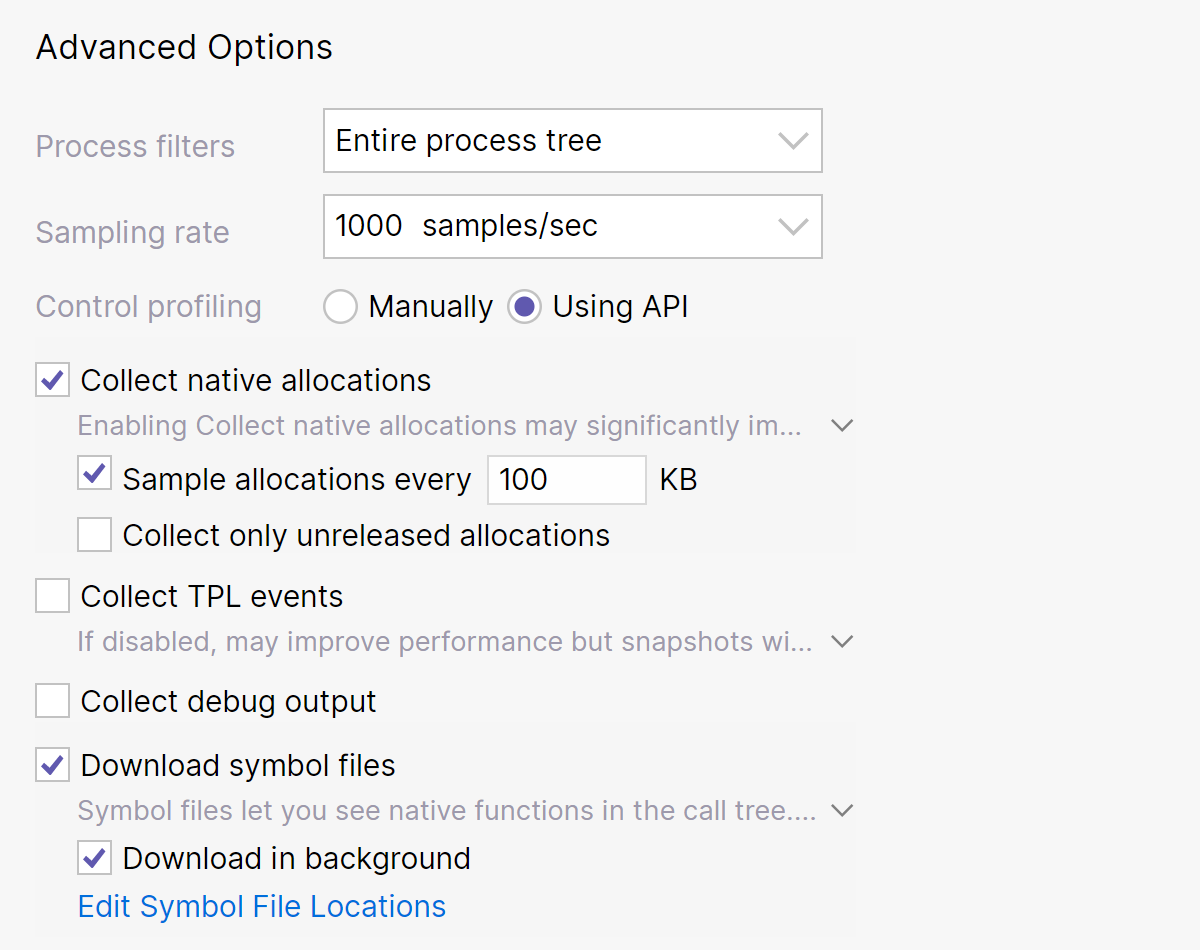
Improved configuration of the Timeline profiling mode 2023.3
Now, when configuring a Timeline profiling session, you can specify the following advanced options:
- Sampling rate – Lets you find the optimal balance between the performance of the profiled application and data accuracy.
- Sample allocations every … KB for native allocations – Lets you improve the performance of snapshot analysis by reducing the amount of collected data, i.e. snapshot size.
- Download in background option for native symbol files – Downloads symbol files during the profiling session.
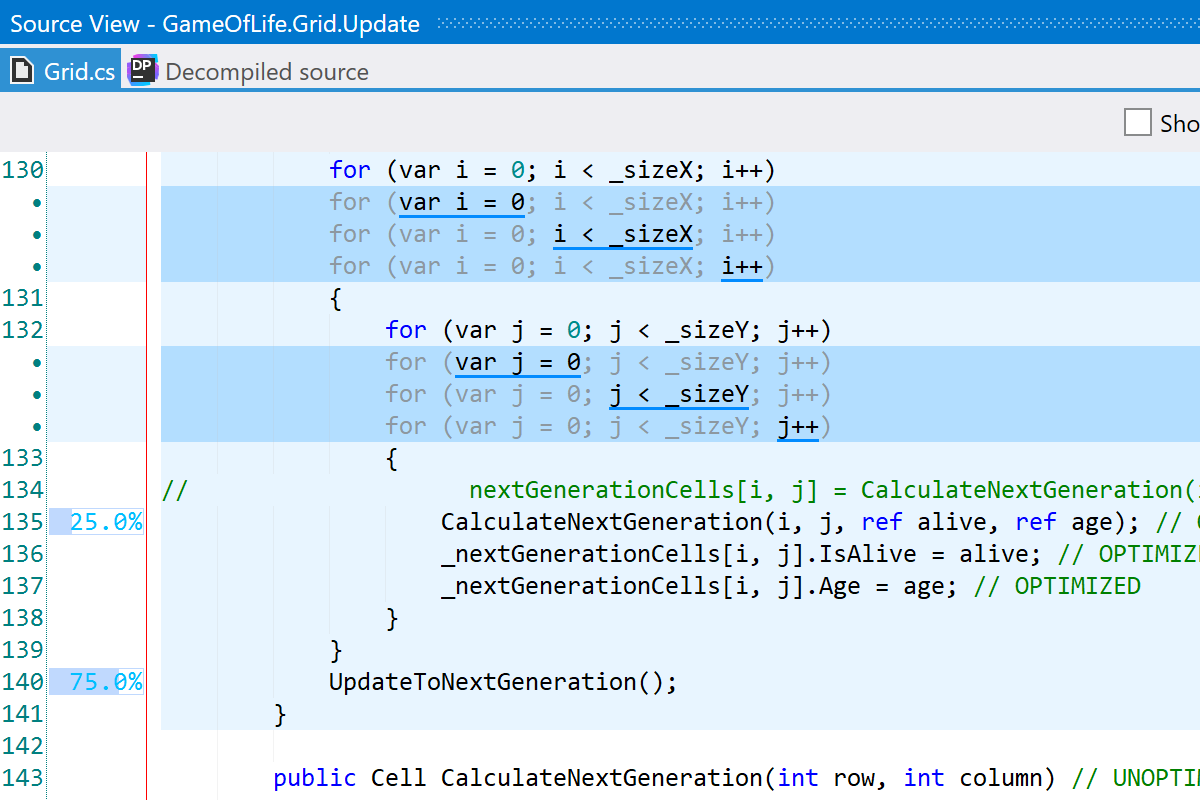
Profiling data in the Source view 2023.3
Instead of analyzing the Call Tree, you can now view performance profiling data right in the source code. The Source view displays time distribution information for specific lines of code. As of now, this feature is only available for timeline snapshots taken on Windows.
Improved native code analysis 2023.3
- Source code for native methods can now be viewed for timeline snapshots taken on Windows.
- Native threads are now displayed by default if there are no managed threads.
Other improvements 2023.3
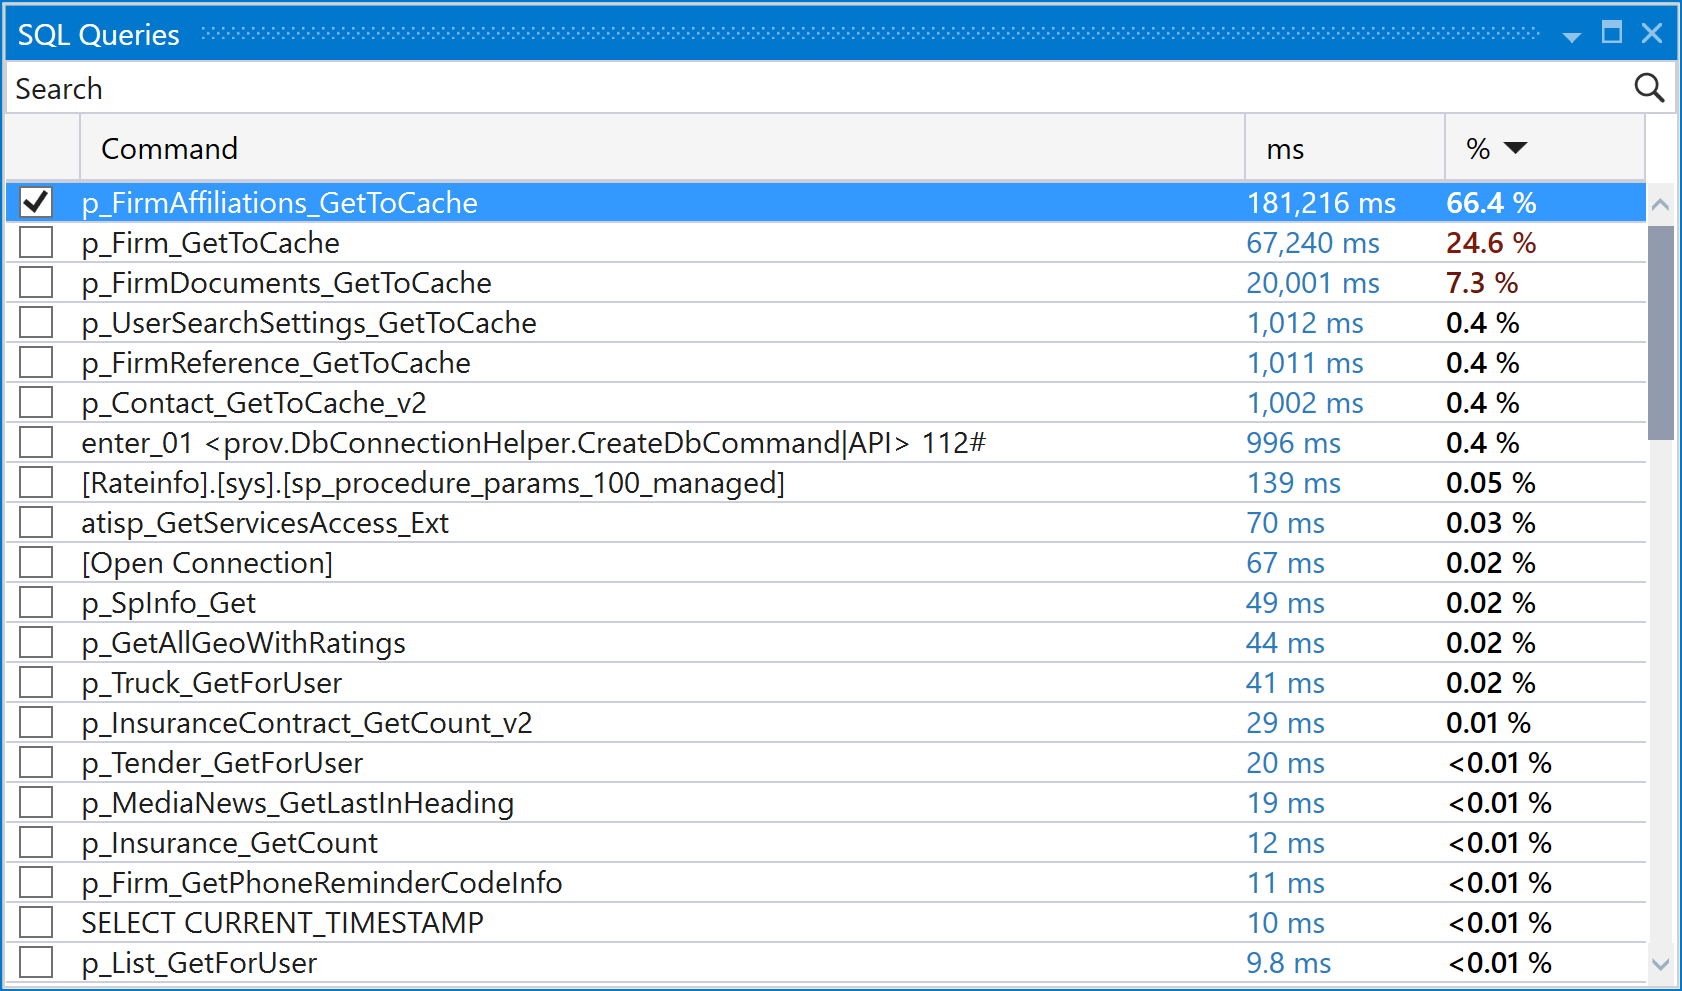
-
The timeline profiling mode now supports the
System.Data.SqlClientdata provider for the .NET and .NET Core frameworks. You can view the corresponding events in the SQL Queries filter. - You can now view performance metrics inside the search window in the dotTrace viewer.
- Support for integration with third-party tools is now available on Linux and macOS.
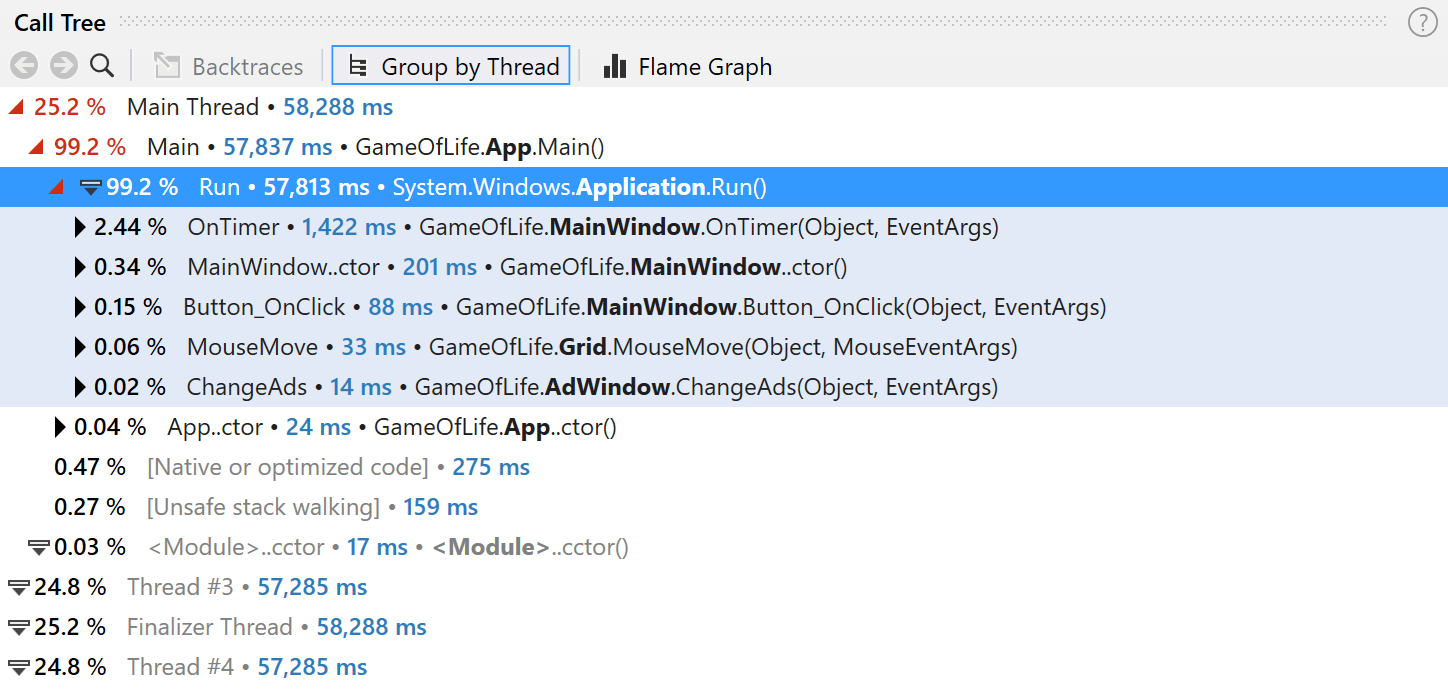
Grouping by a thread for sampling, tracing, and line-by-line snapshots 2023.2
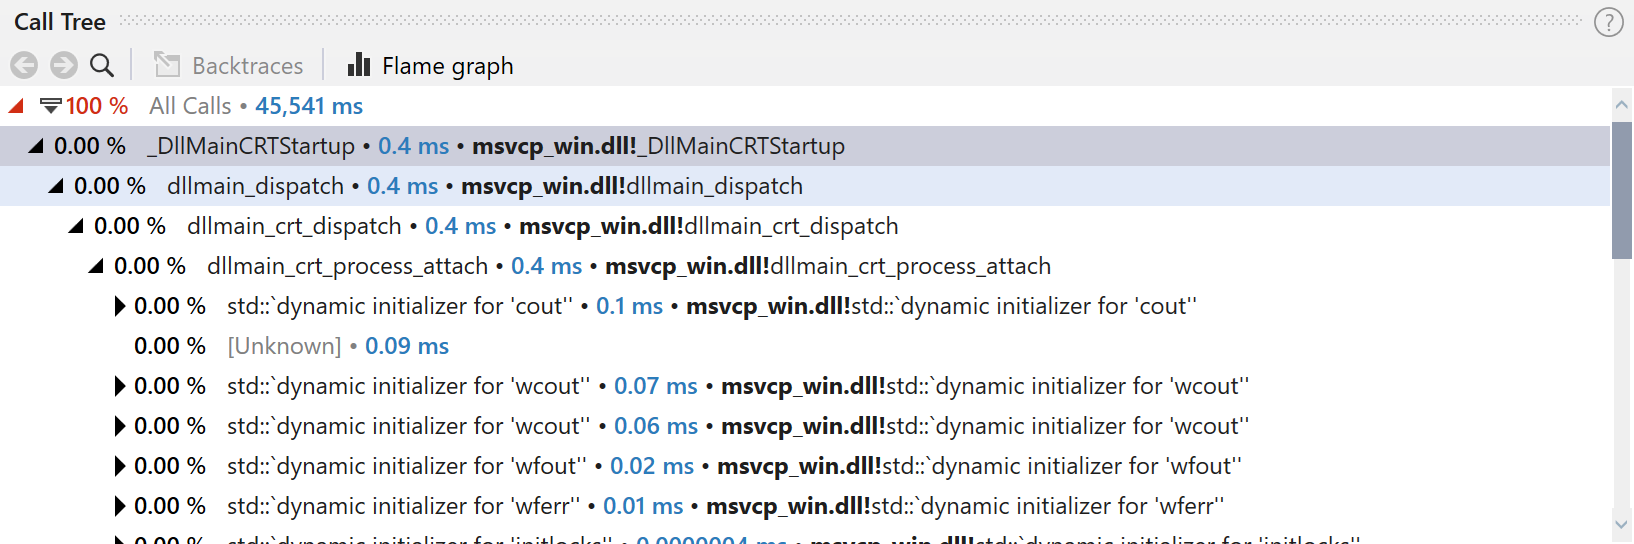
Now, the Call Tree view lets you group call stacks by individual threads, allowing deeper insight into thread-specific performance issues.
Source View tool window on Linux and macOS 2023.2
The standalone version of dotTrace on Linux and macOS gets the Source View window. After you select a call in the Call Tree, Source View will show you the source code of the corresponding method.
Other improvements and bug fixes 2023.2
- For Timeline snapshots, dotTrace Viewer now shows the names of native threads instead of showing them all as Native. This feature will benefit Unity developers, letting them distinguish specific Unity threads. Available only on Windows.
- The Source View window in dotTrace Viewer now shows the number of invocations for each line of code.
dotTrace for macOS and Linux Beta 2023.1
The standalone version of dotTrace is now available on Linux and macOS. Now, you can perform the full profiling workflow on these operating systems, including collecting and analyzing performance snapshots.
Support for Windows ARM64 2022.3
Now, you can use dotTrace on ARM64 CPUs on Windows. This applies to all versions: dotTrace standalone, dotTrace in Rider, dotTrace in Visual Studio, and the dotTrace command-line tool.
Support for Linux ARM32 2022.3
You can now run the dotTrace command-line profiler on ARM32 CPUs on Linux. The supported frameworks are .NET Core 3.1 and .NET 5.0–7.0. Note that the timeline profiling type is supported only for .NET 6.0 applications.
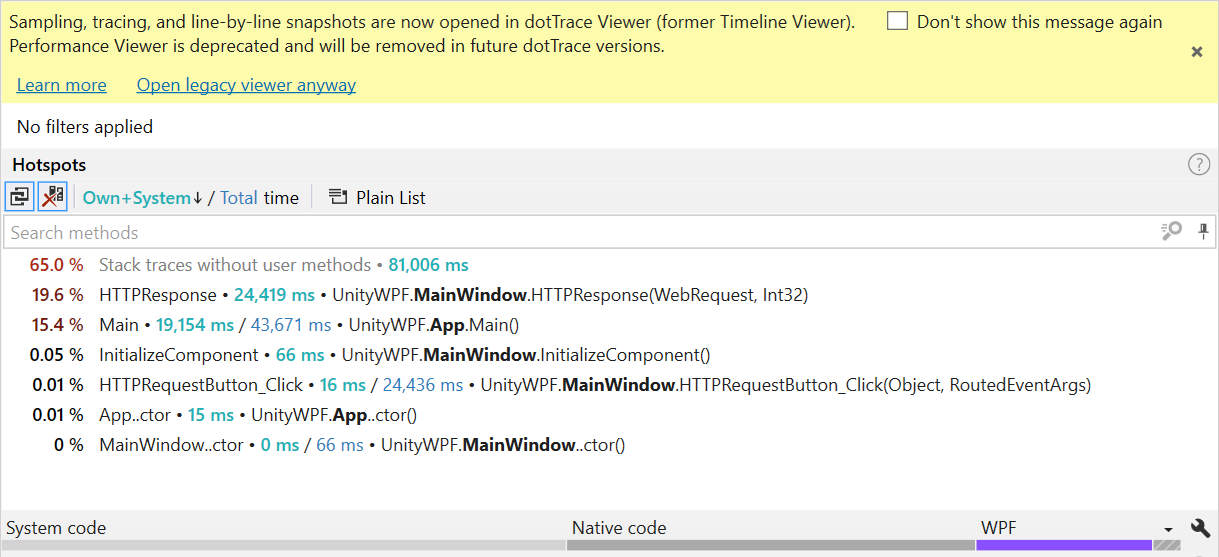
Discarding the Performance Viewer 2022.3
Before this release, sampling, tracing, and line-by-line performance snapshots had to be opened in the legacy Performance Viewer, while timeline snapshots were opened in the more modern Timeline Viewer. This worsened the overall user experience, since the viewers have different user interfaces and approaches to snapshot analysis.
Now we’re getting rid of the Performance Viewer in favor of the dotTrace Viewer (formerly the Timeline Viewer). dotTrace will use it to open snapshots of all types. However, you may continue to use the discontinued Performance Viewer if you’d like. If you opt to stick with the Performance Viewer, we would love to hear your reasons for doing so. Your feedback is greatly appreciated!
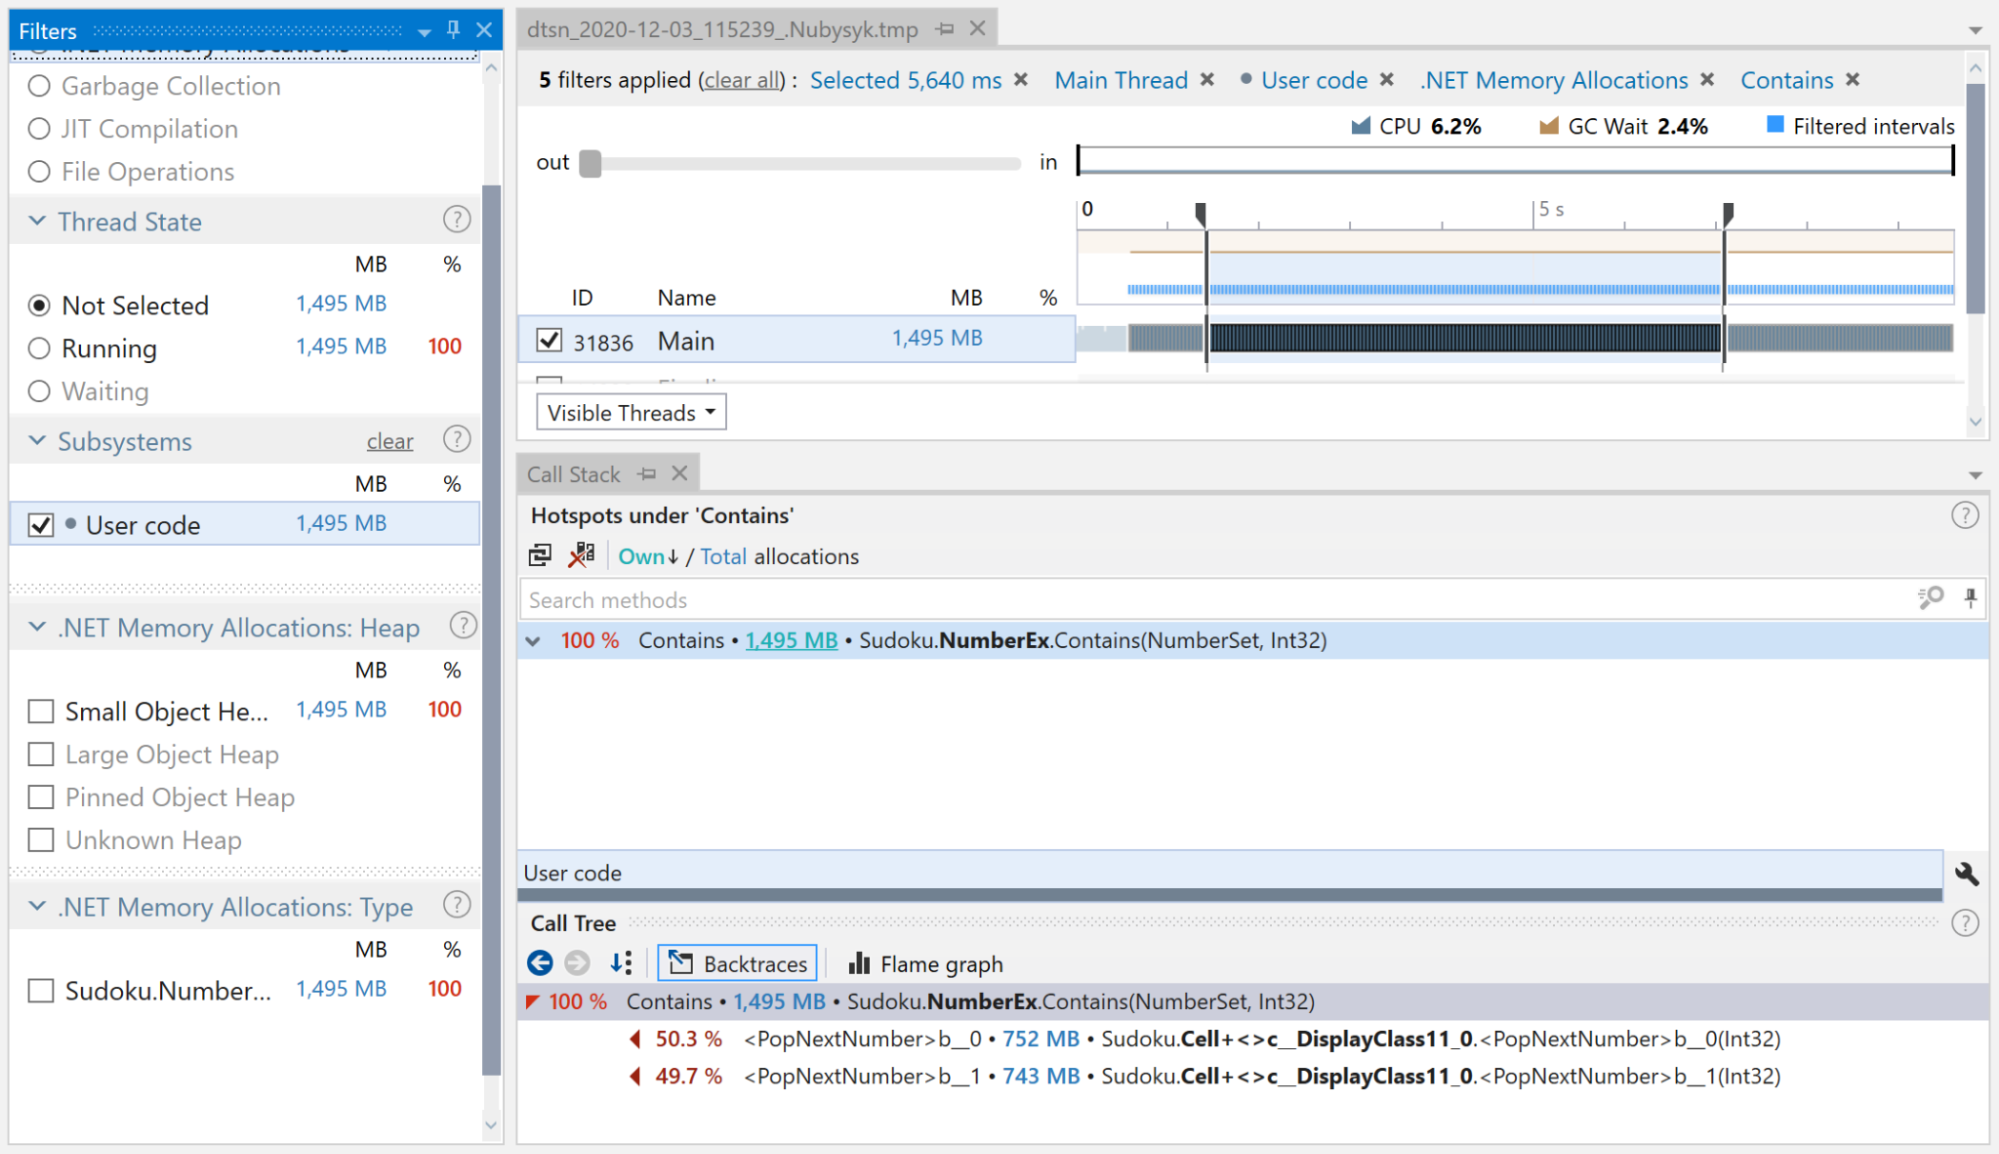
Improvements in snapshot analysis 2022.3
As the dotTrace Viewer now opens snapshots of all types, you can use all of its powerful features when comparing performance snapshots:
- The new “comparison as a filter” concept makes it easier to compare sampling, tracing, and line-by-line snapshots.
- Now you can filter subsystems in sampling, tracing, and line-by-line snapshots.
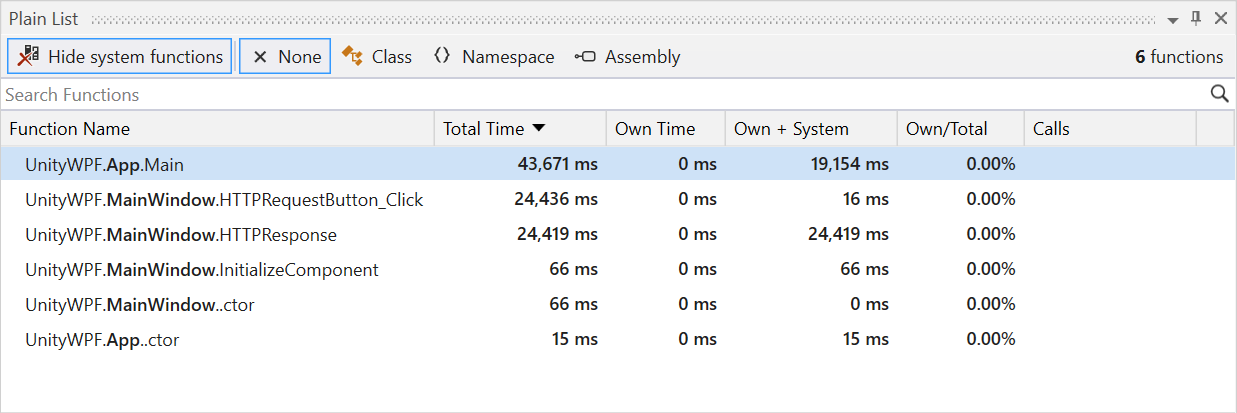
- The dotTrace Viewer now has a Plain List view. It’s available for sampling, tracing, and line-by-line snapshots, and also for timeline snapshots.
Improved support for native system calls 2022.2
dotTrace now provides more details for native system calls in the
Timeline Call Tree, including Windows kernel calls (ntoskrnl.exe),
device driver calls (*.sys), and more.
Improvements to dotTrace in JetBrains Rider 2022.2
You no longer have to restart the Unity Editor to launch the profiling process. The profiler can now attach to and detach from running Unity processes.
Support for musl-based Linux distributions 2022.1
The dotTrace command-line tool and dotTrace in Rider now support Alpine versions 3.13–3.15. The following CPUs and frameworks are supported:
- x64: .NET Core 3.1, .NET 5.0–6.0.
- arm64: .NET 5.0–6.0.
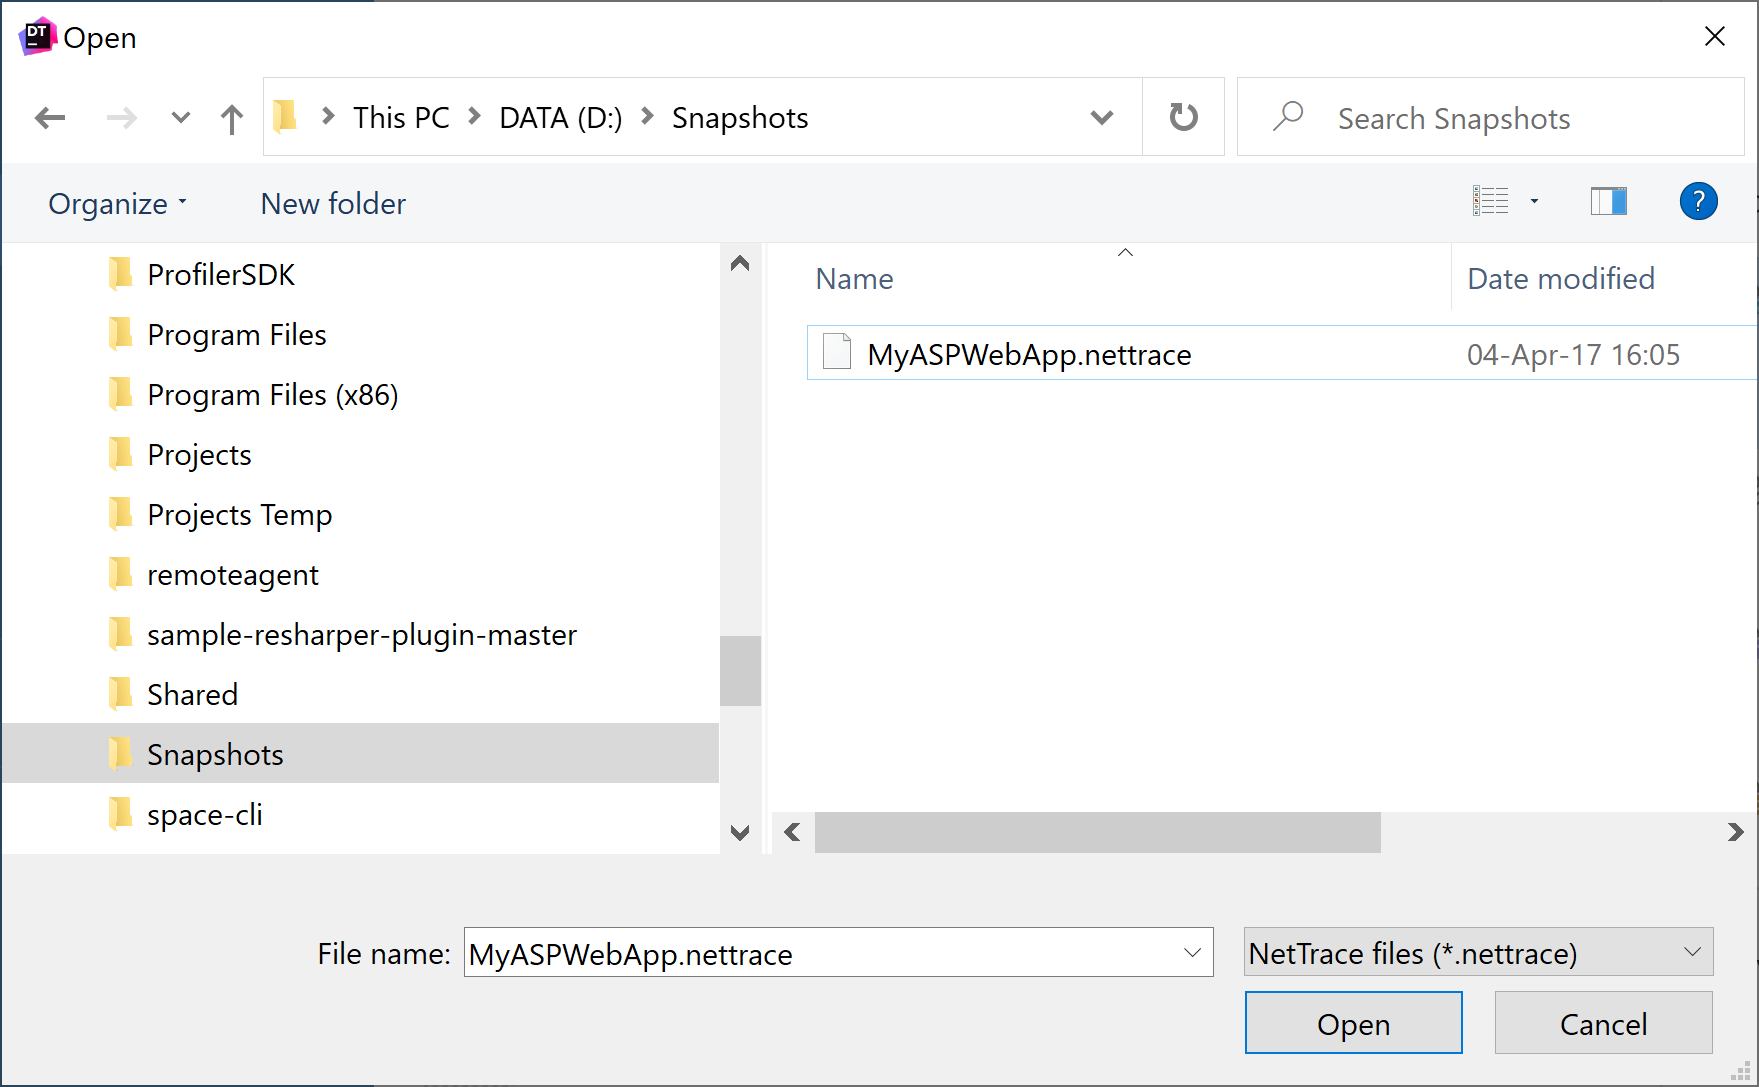
Support for the .NET Core NetTrace file format 2022.1
You can now open NetTrace files collected with dotnet-trace collect:
from the dotTrace Home menu, click Open Snapshot and choose a
.nettrace file.
Improved support for SQL Server events 2022.1
Now dotTrace supports SQL Server events from the
Microsoft.Data.SqlClient provider on Windows (.NET Core, .NET 5+),
as well as macOS and Linux (.NET Core 3.0+, .NET 5+).
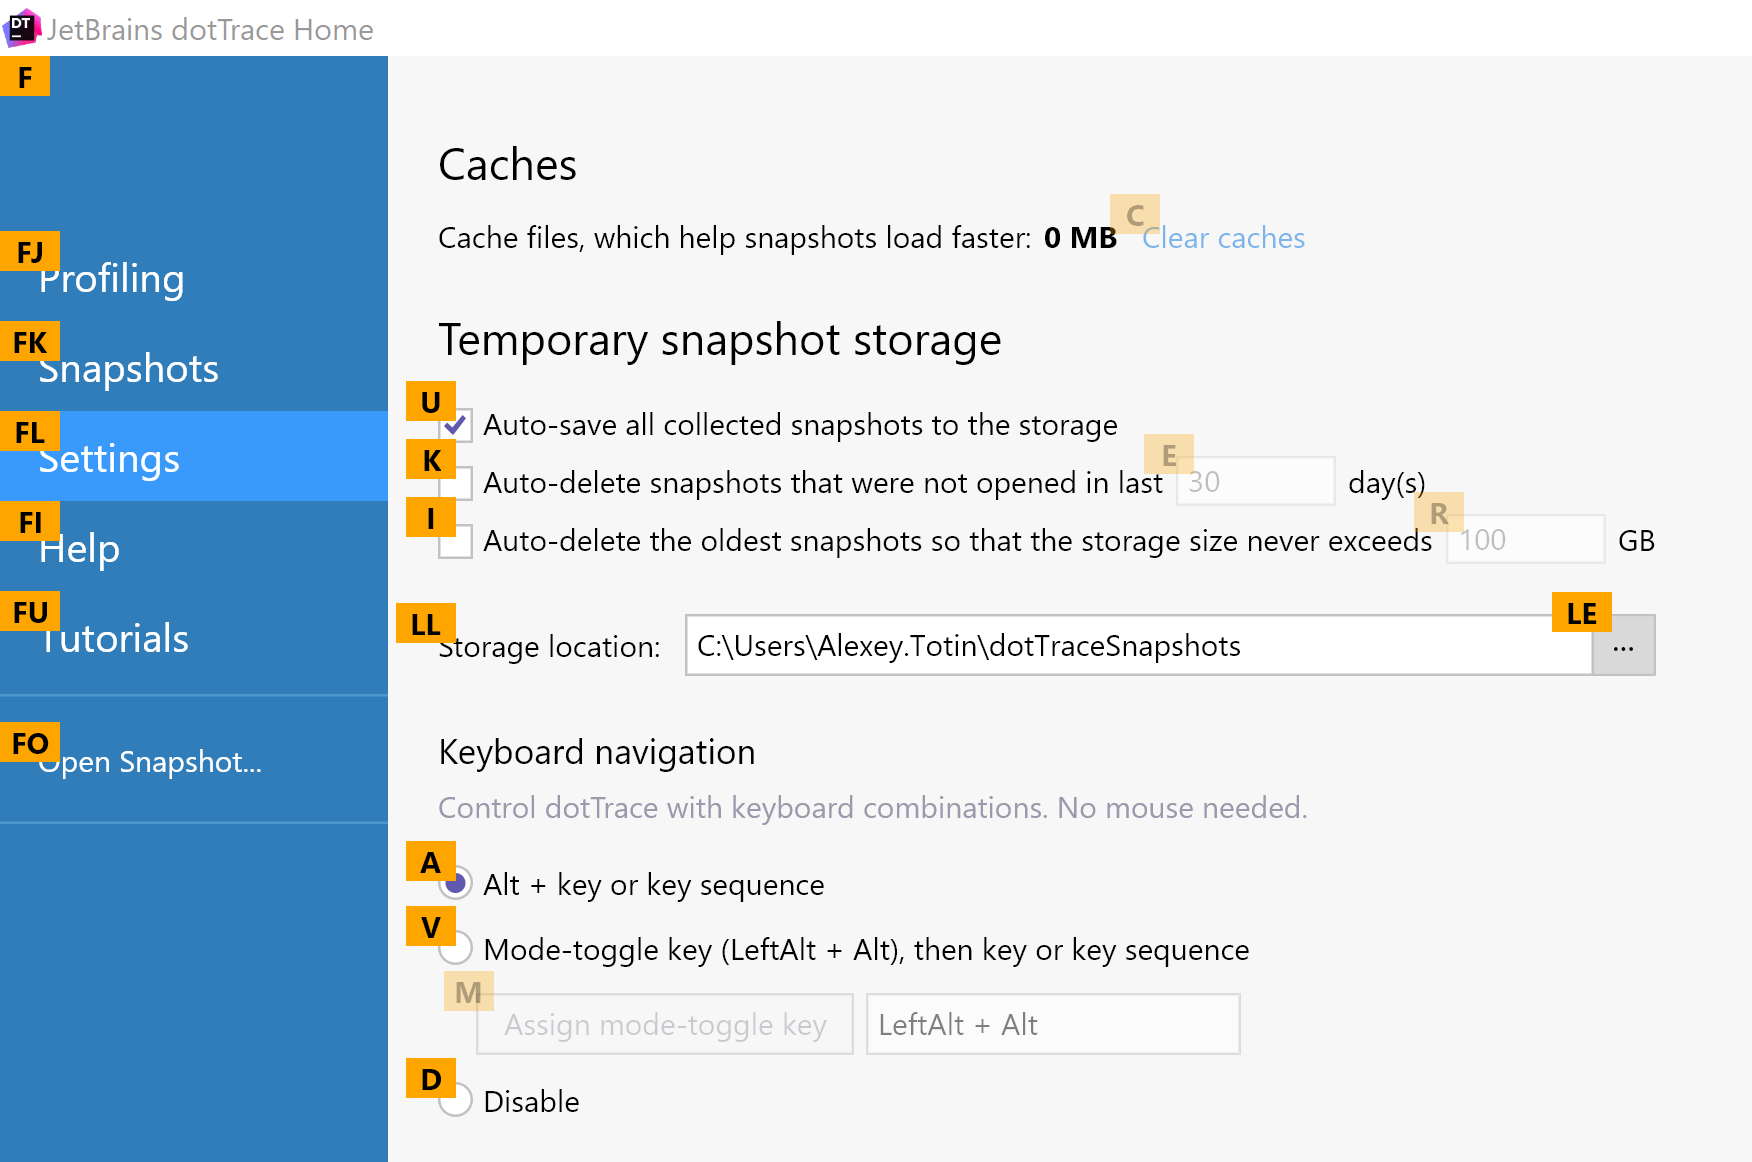
Keyboard navigation in dotTrace Home 2022.1
You can now navigate the dotTrace Home window using only keyboard combinations. No mouse is needed. Each UI element is assigned to a key or key sequence. There are two ways to view the assigned keys and interact with UI elements:
- Hold Alt and press a key or key sequence (default).
- Press the mode-toggle key, then press a key or key sequence.
You can choose which to use in dotTrace Home | Settings.
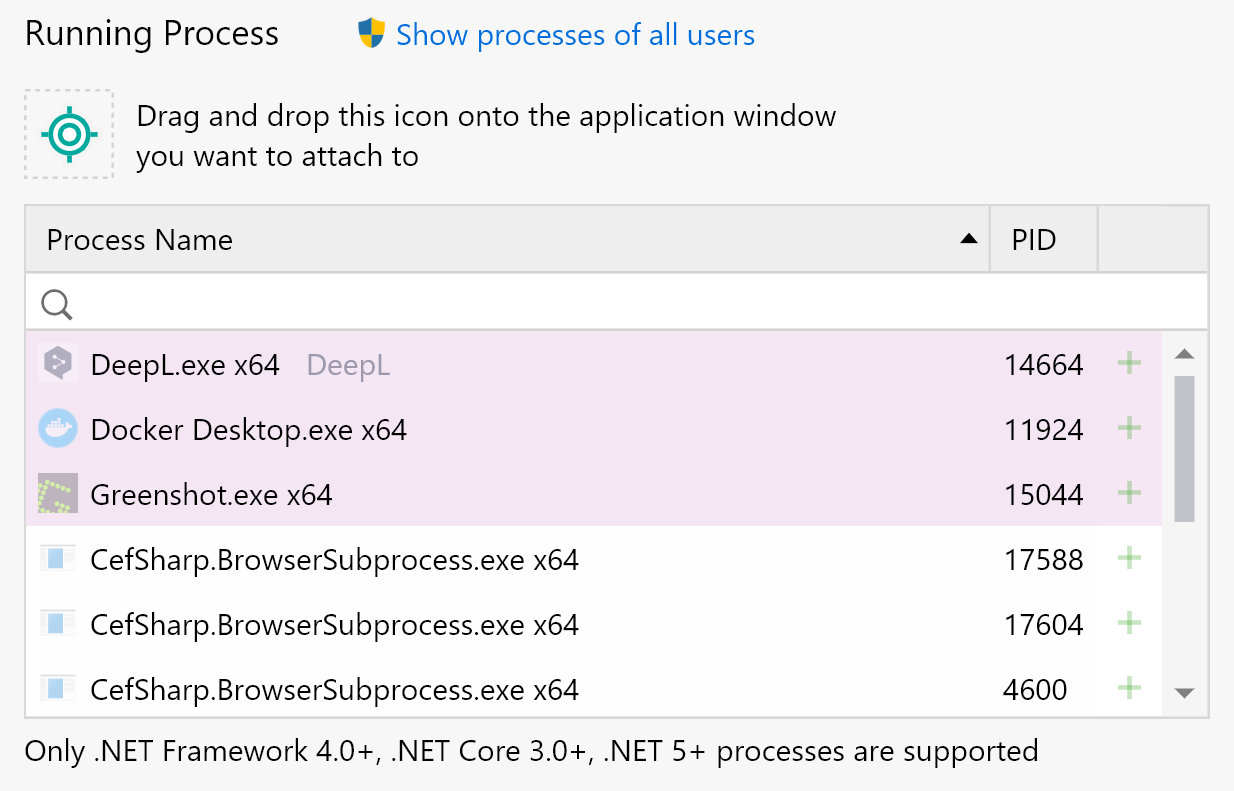
Attaching to applications with drag and drop 2022.1
You can now attach the profiler to an already running application by simply dragging the special icon onto the application window.
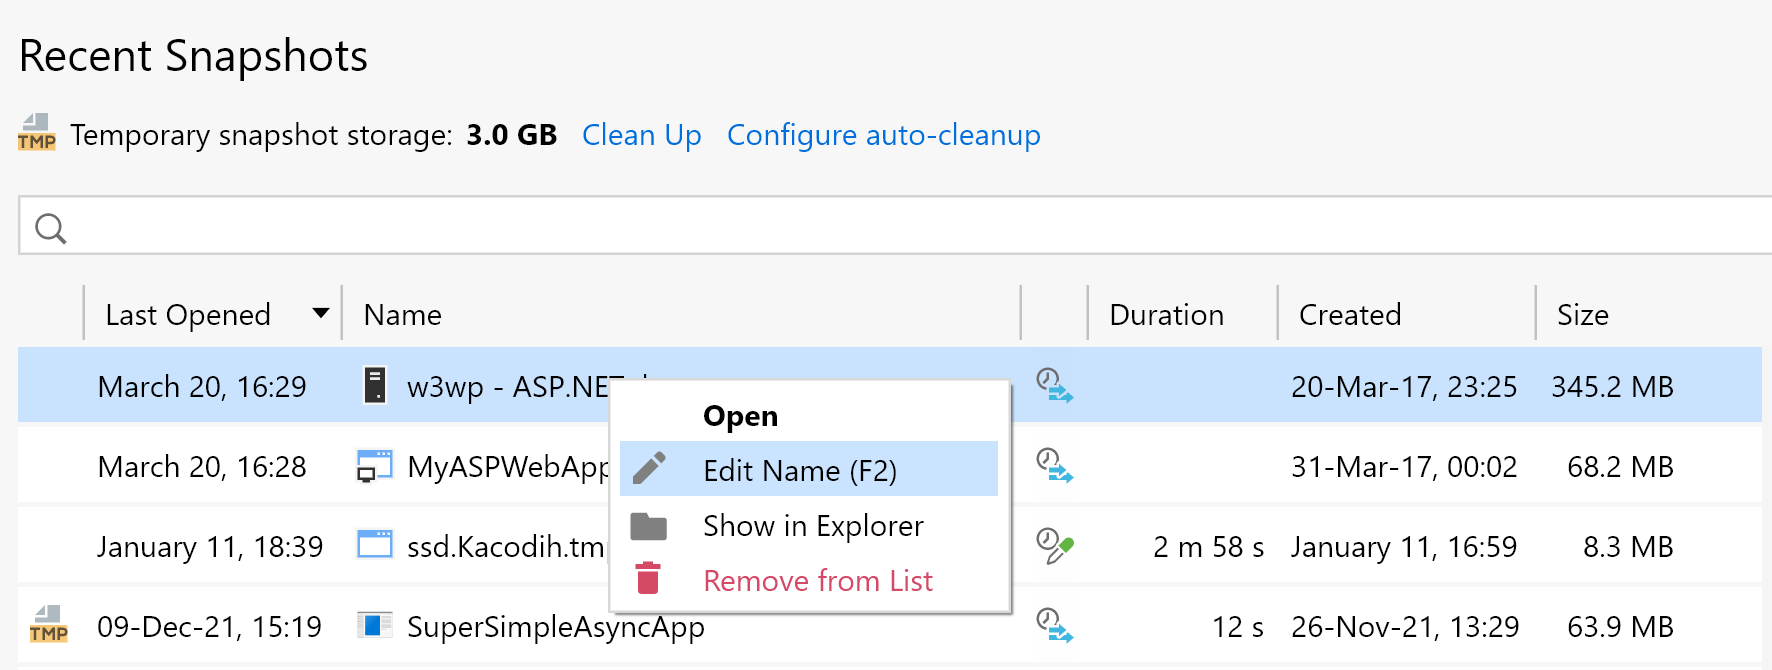
Improved Snapshots page in the dotTrace Home window 2022.1
- You can now edit the names of snapshots.
- You can now open snapshots by dragging the corresponding files onto the dotTrace Home window.
- The snapshots list now preserves the sorting state between dotTrace launches.
- The snapshots list now uses the system date format.
Other improvements 2022.1
- You can now disable snapshot auto-saving. If you do, when you close the Timeline or Performance Viewer, dotTrace will ask you whether you want to save the collected snapshots.
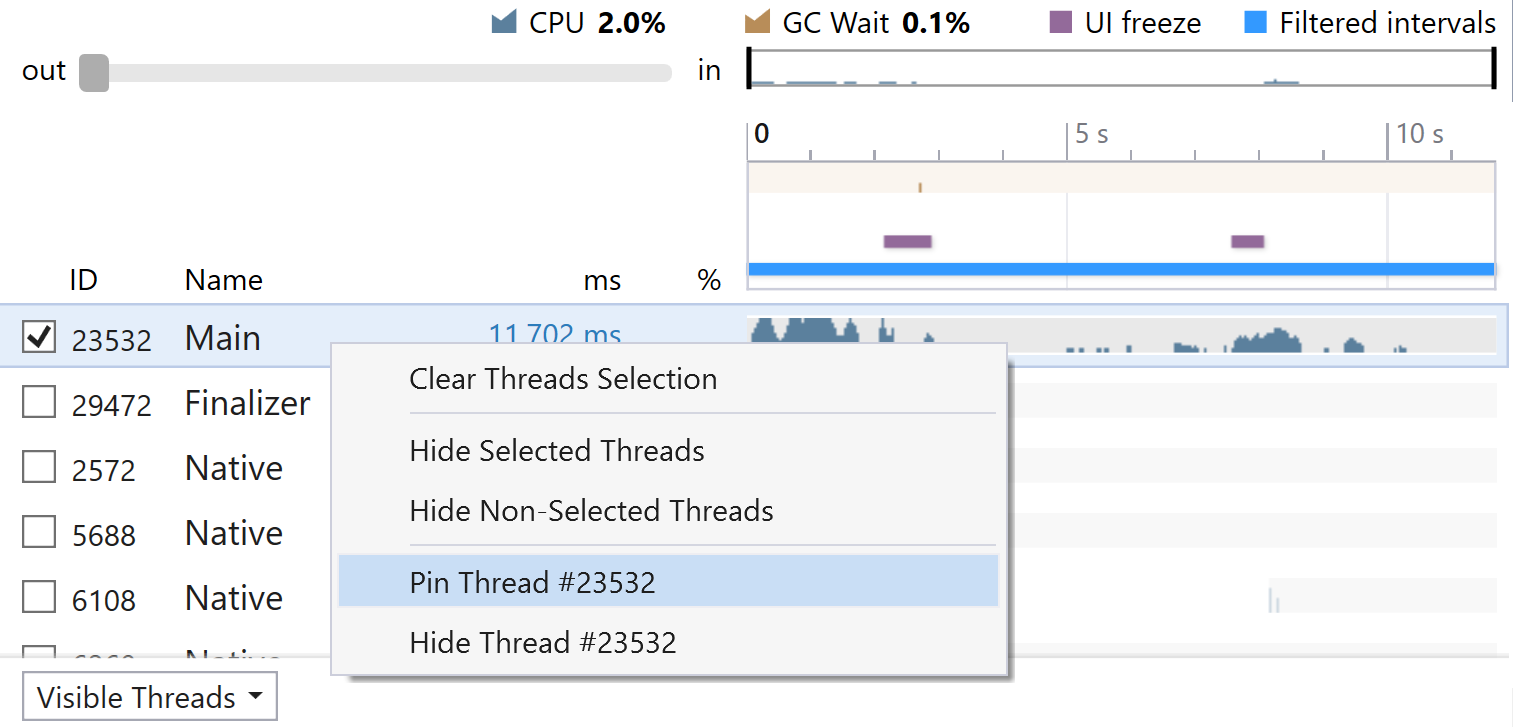
- It’s now possible to pin threads in the Threads filter in the Timeline Viewer.
- The Configuration2Xml tool now uses the same UI as the dotTrace Home window.
Support for Apple silicon processors 2021.3
The dotTrace command-line tool now works on computers with Apple silicon processors. You can use it to profile .NET 6 applications (native mode) and .NET 5 applications (Rosetta 2 mode).
Performance improvements 2021.3
- We reduced the performance overhead of Timeline profiling for applications that heavily use async calls.
- We improved the performance of opening and filtering in Timeline snapshots.
Saving UI state for Timeline snapshots 2021.3
When you close a Timeline snapshot, dotTrace saves the state of the user interface, including selected time intervals, applied filters, and so on. Next time you open the snapshot, dotTrace will restore the UI to the same state.
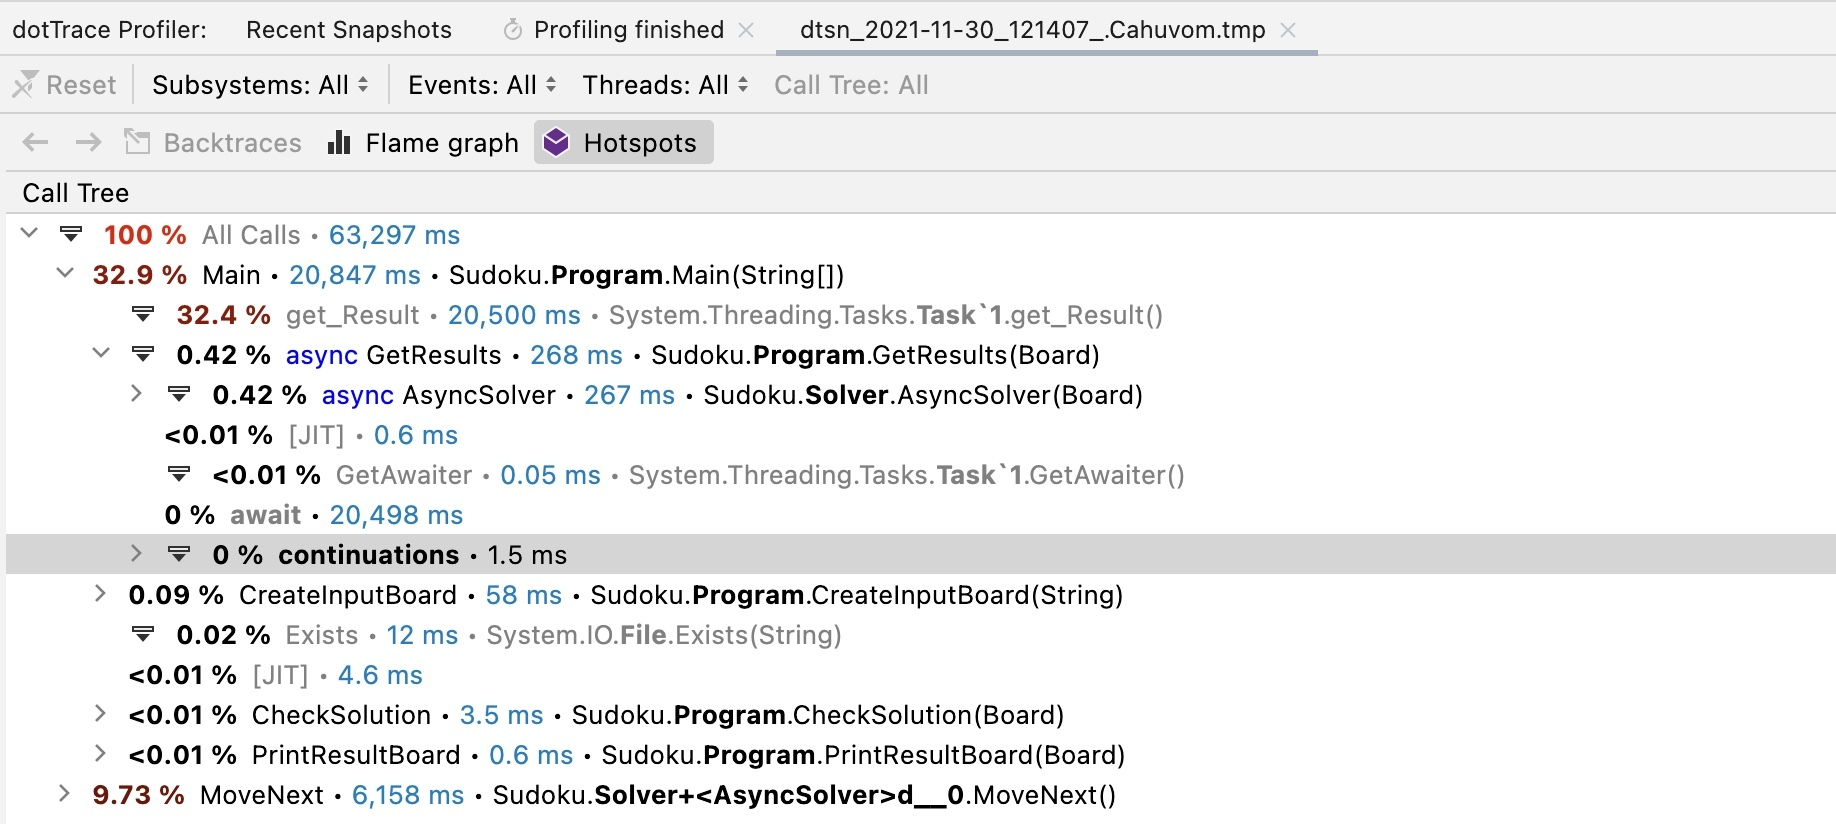
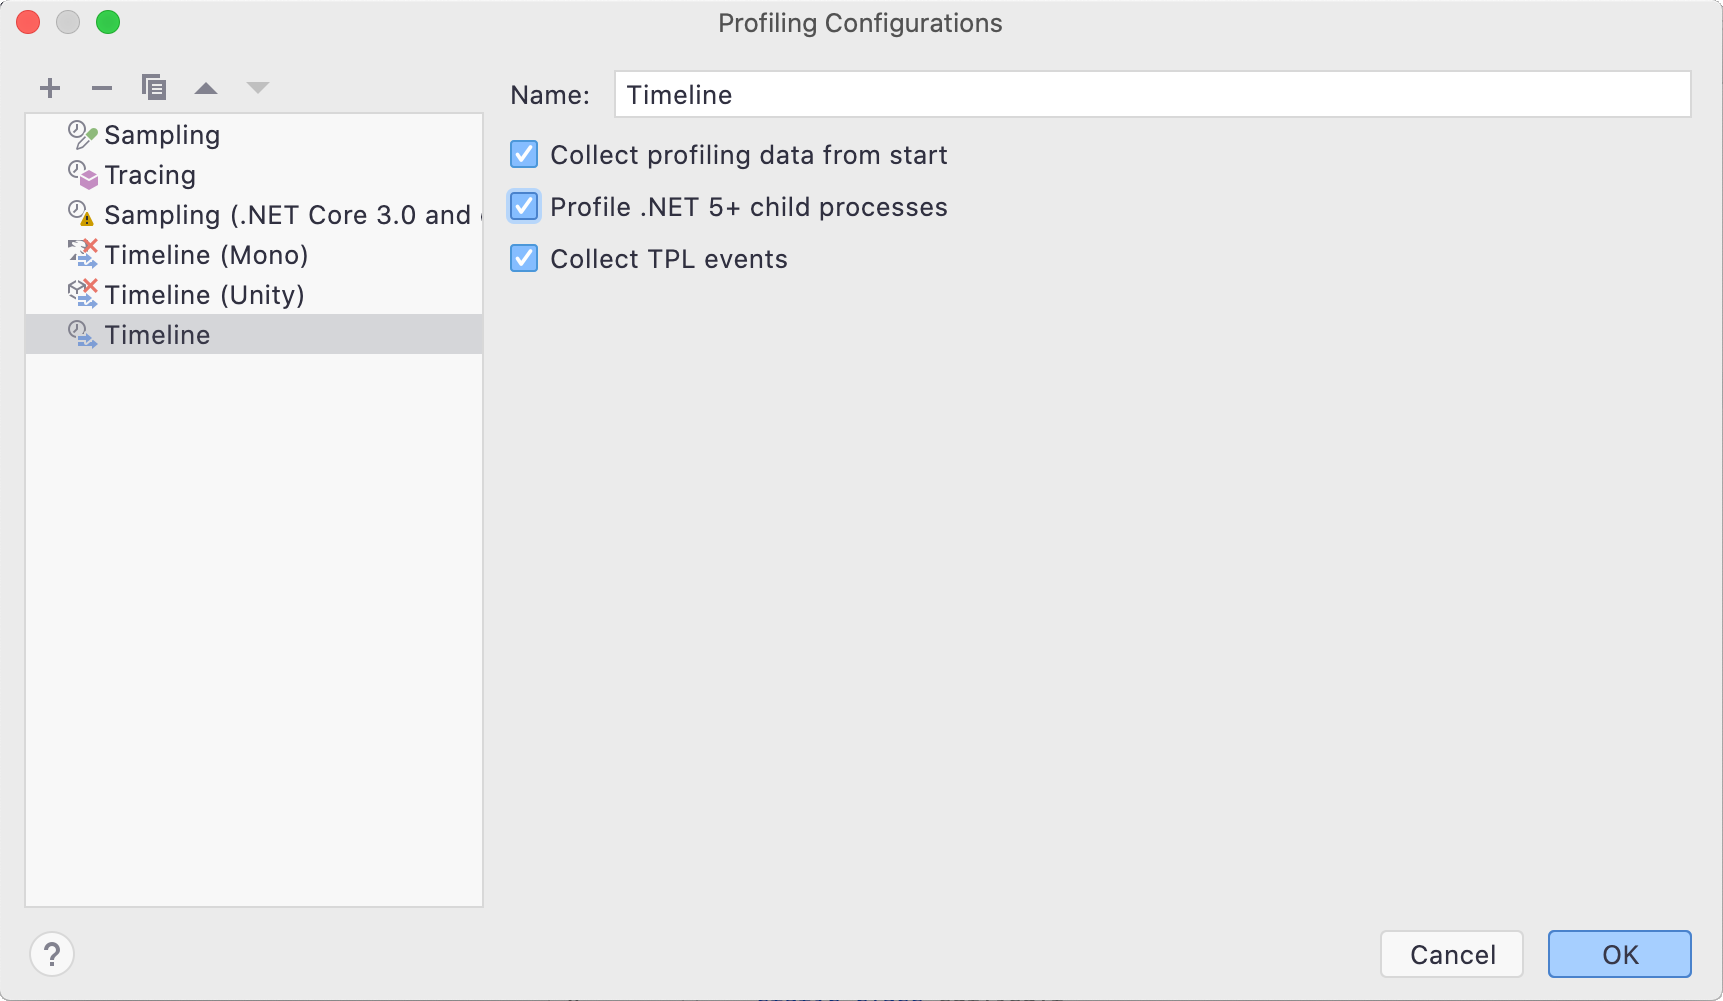
Support for TPL events on macOS and Linux 2021.3
The dotTrace command-line tool and dotTrace in Rider now let you collect data on asynchronous calls on macOS and Linux. To get this data, use the Timeline profiling mode. The Call Tree shows async calls, including awaits and continuations.
Improved support for child processes on macOS and Linux 2021.3
The dotTrace command-line tool and dotTrace in Rider can now profile child processes of applications on macOS and Linux in the Timeline profiling mode. This support is available only for .NET 5+ applications.
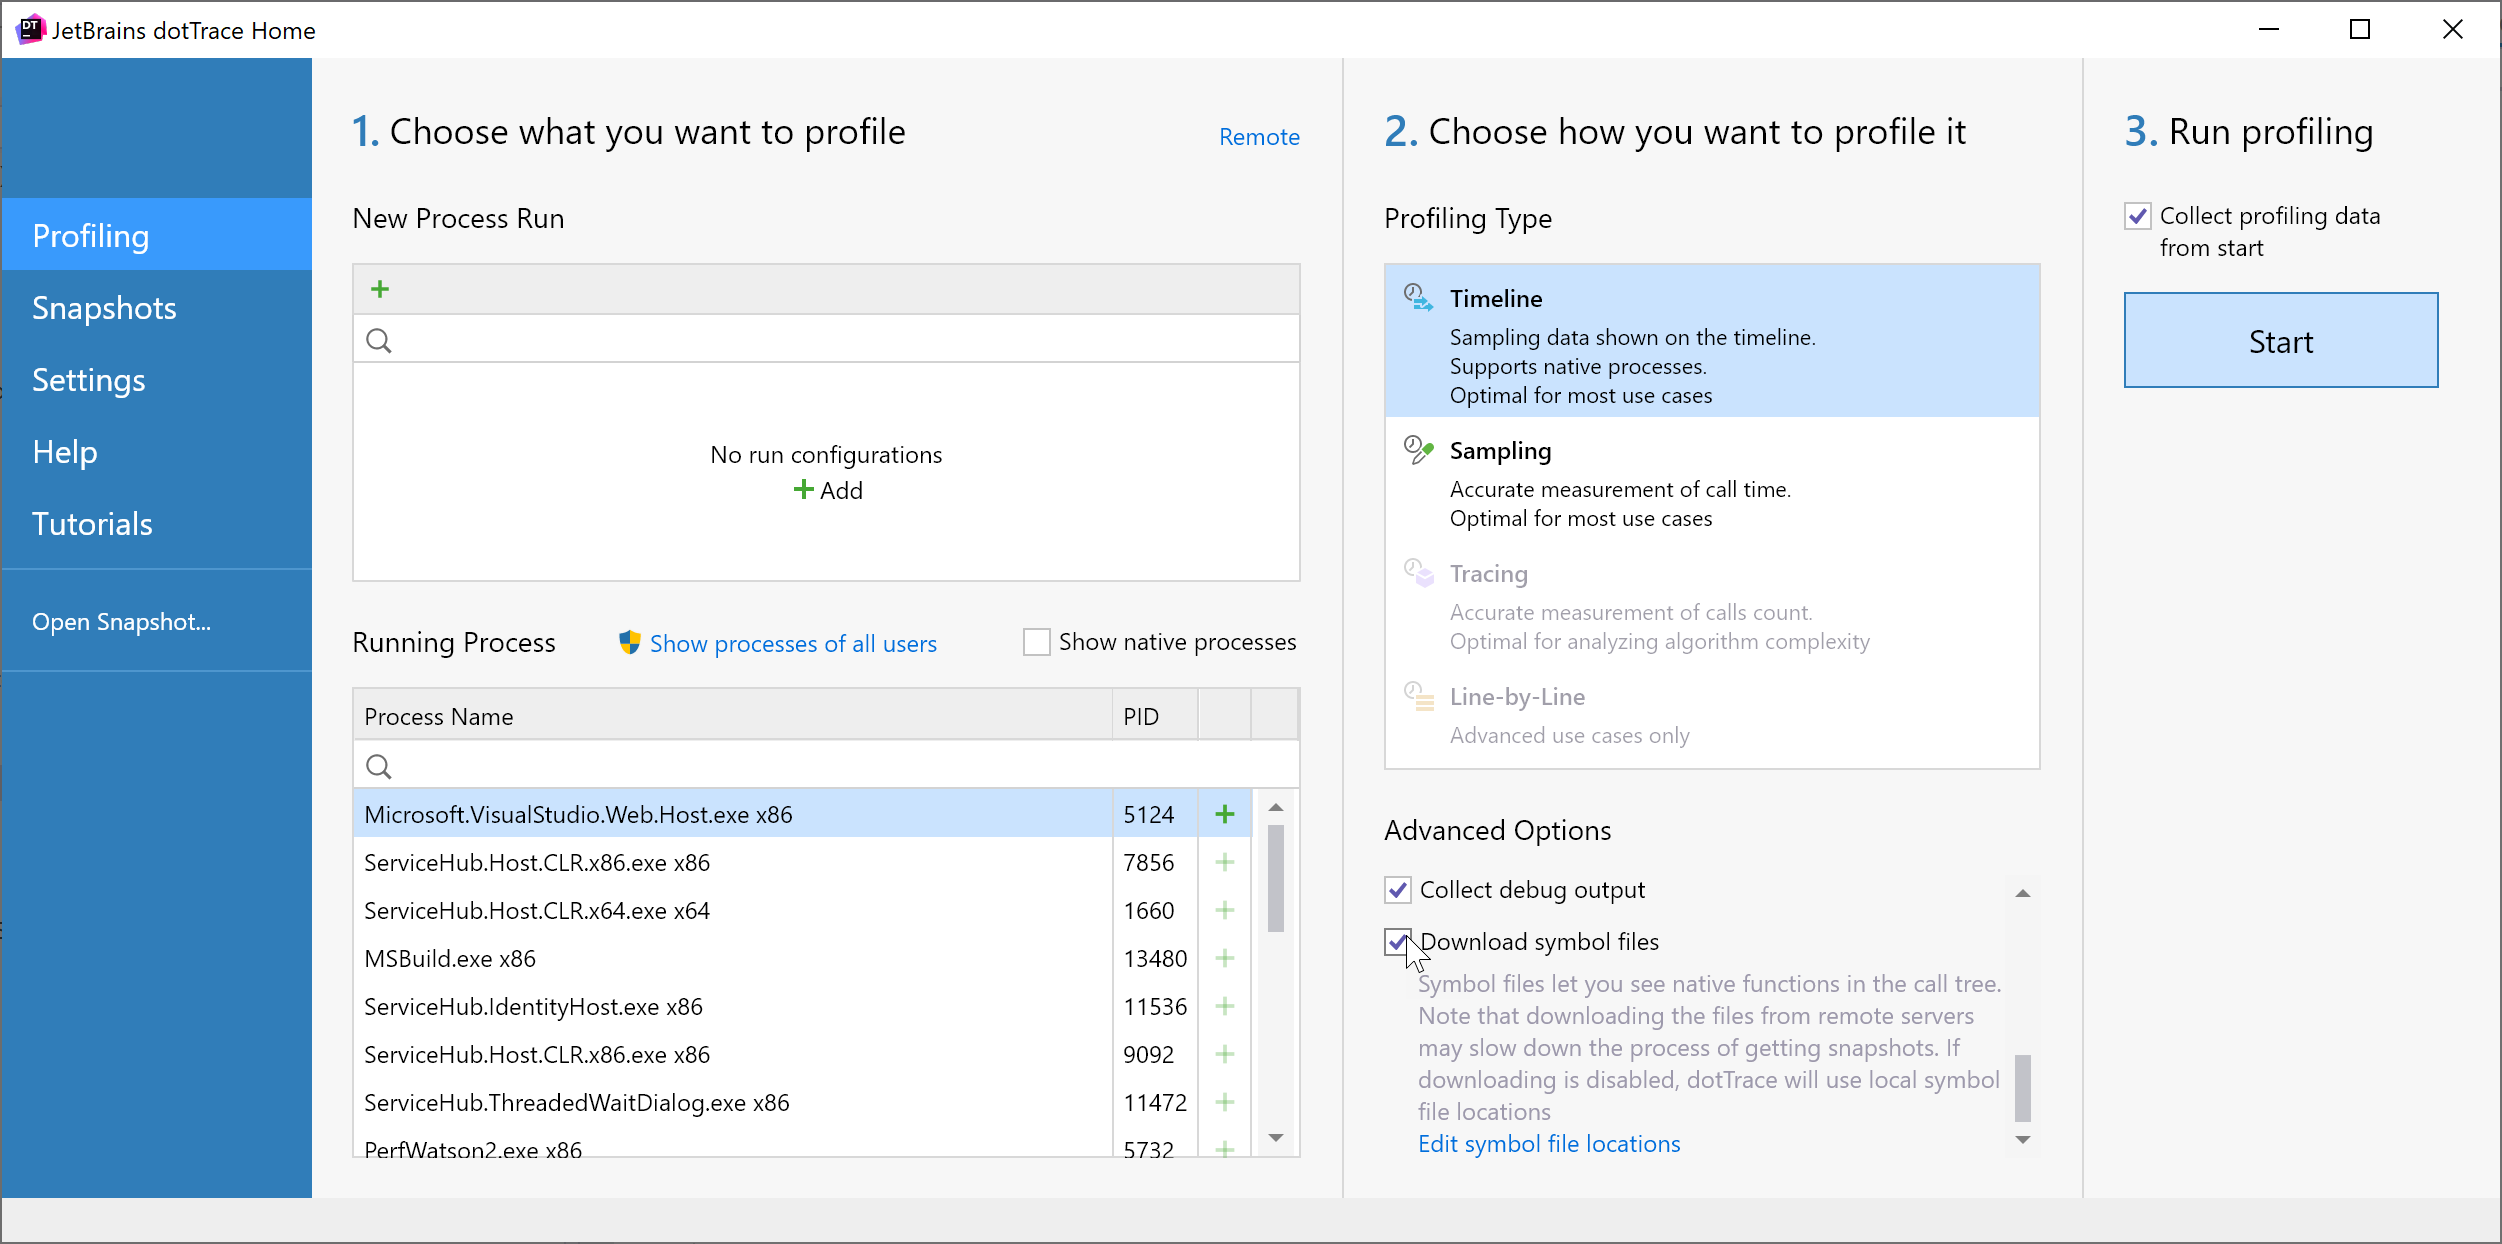
Native profiling 2021.2
It’s now possible to profile native applications on Windows. When starting a profiling session, you have the option to download native source symbol files from remote servers. Native profiling is only available for the Timeline profiling type.
Timeline profiling on macOS and Linux 2021.2
You can now profile .NET Core and .NET applications on macOS and Linux using the Timeline profiling type.
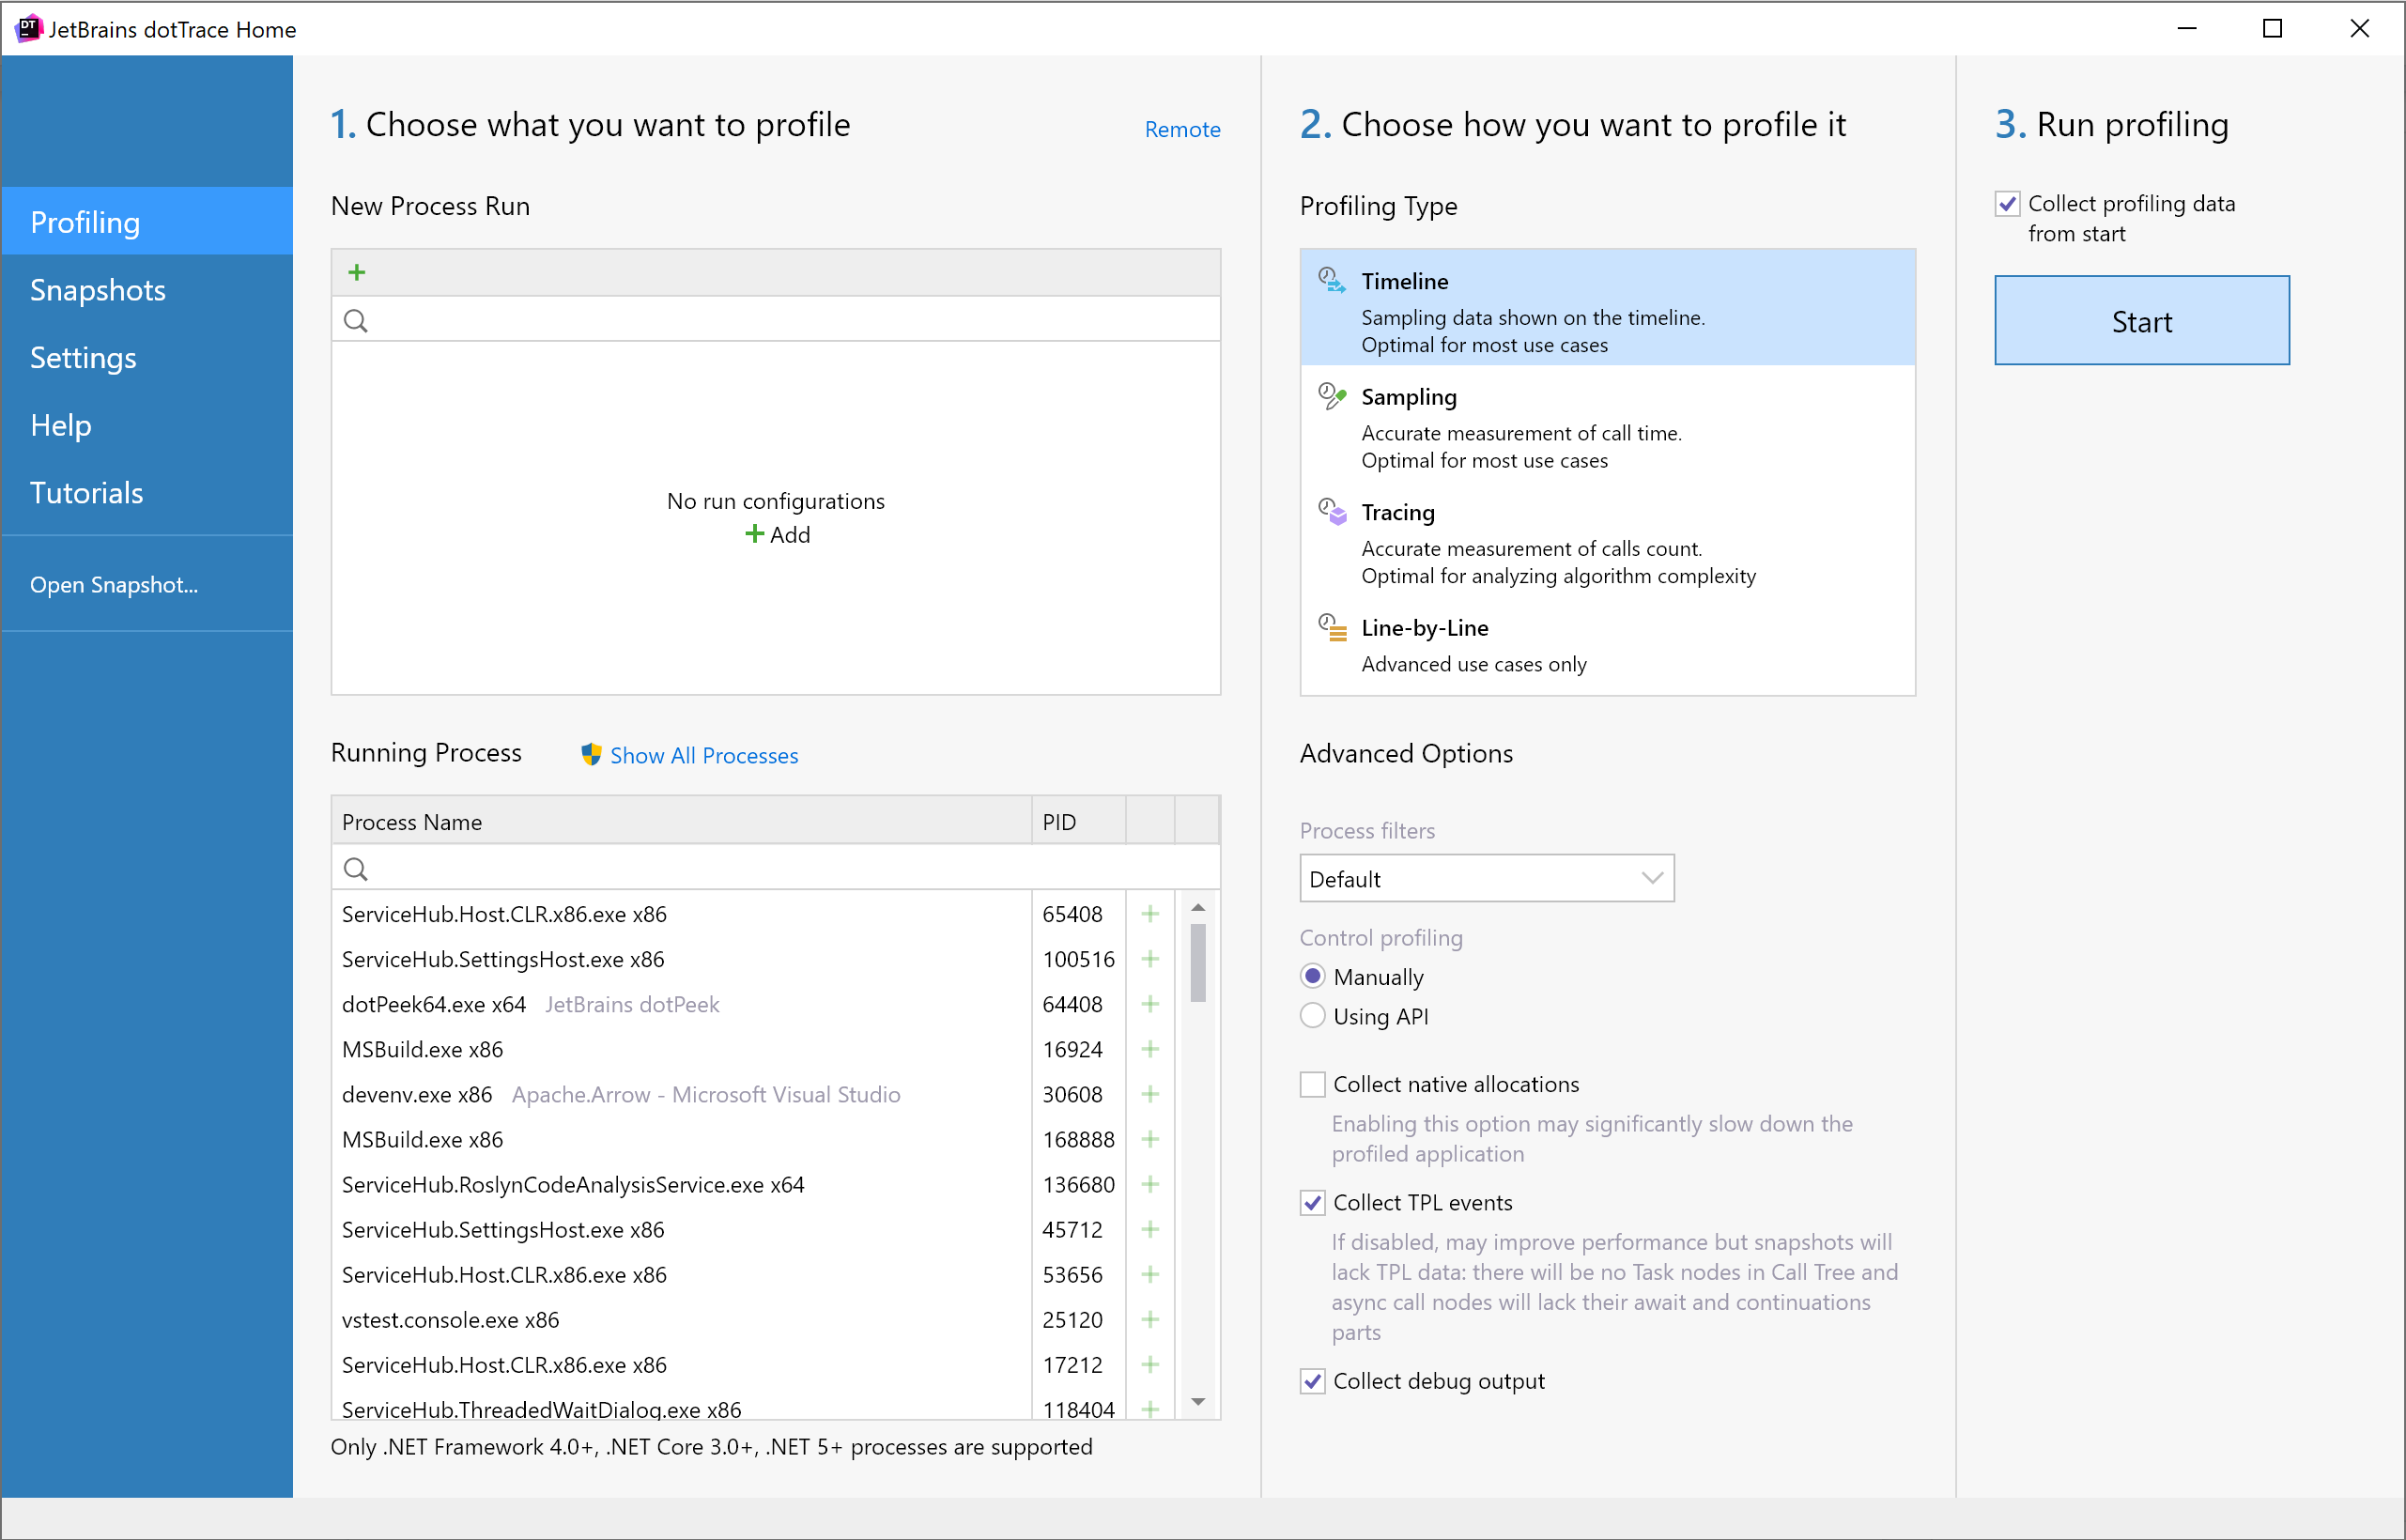
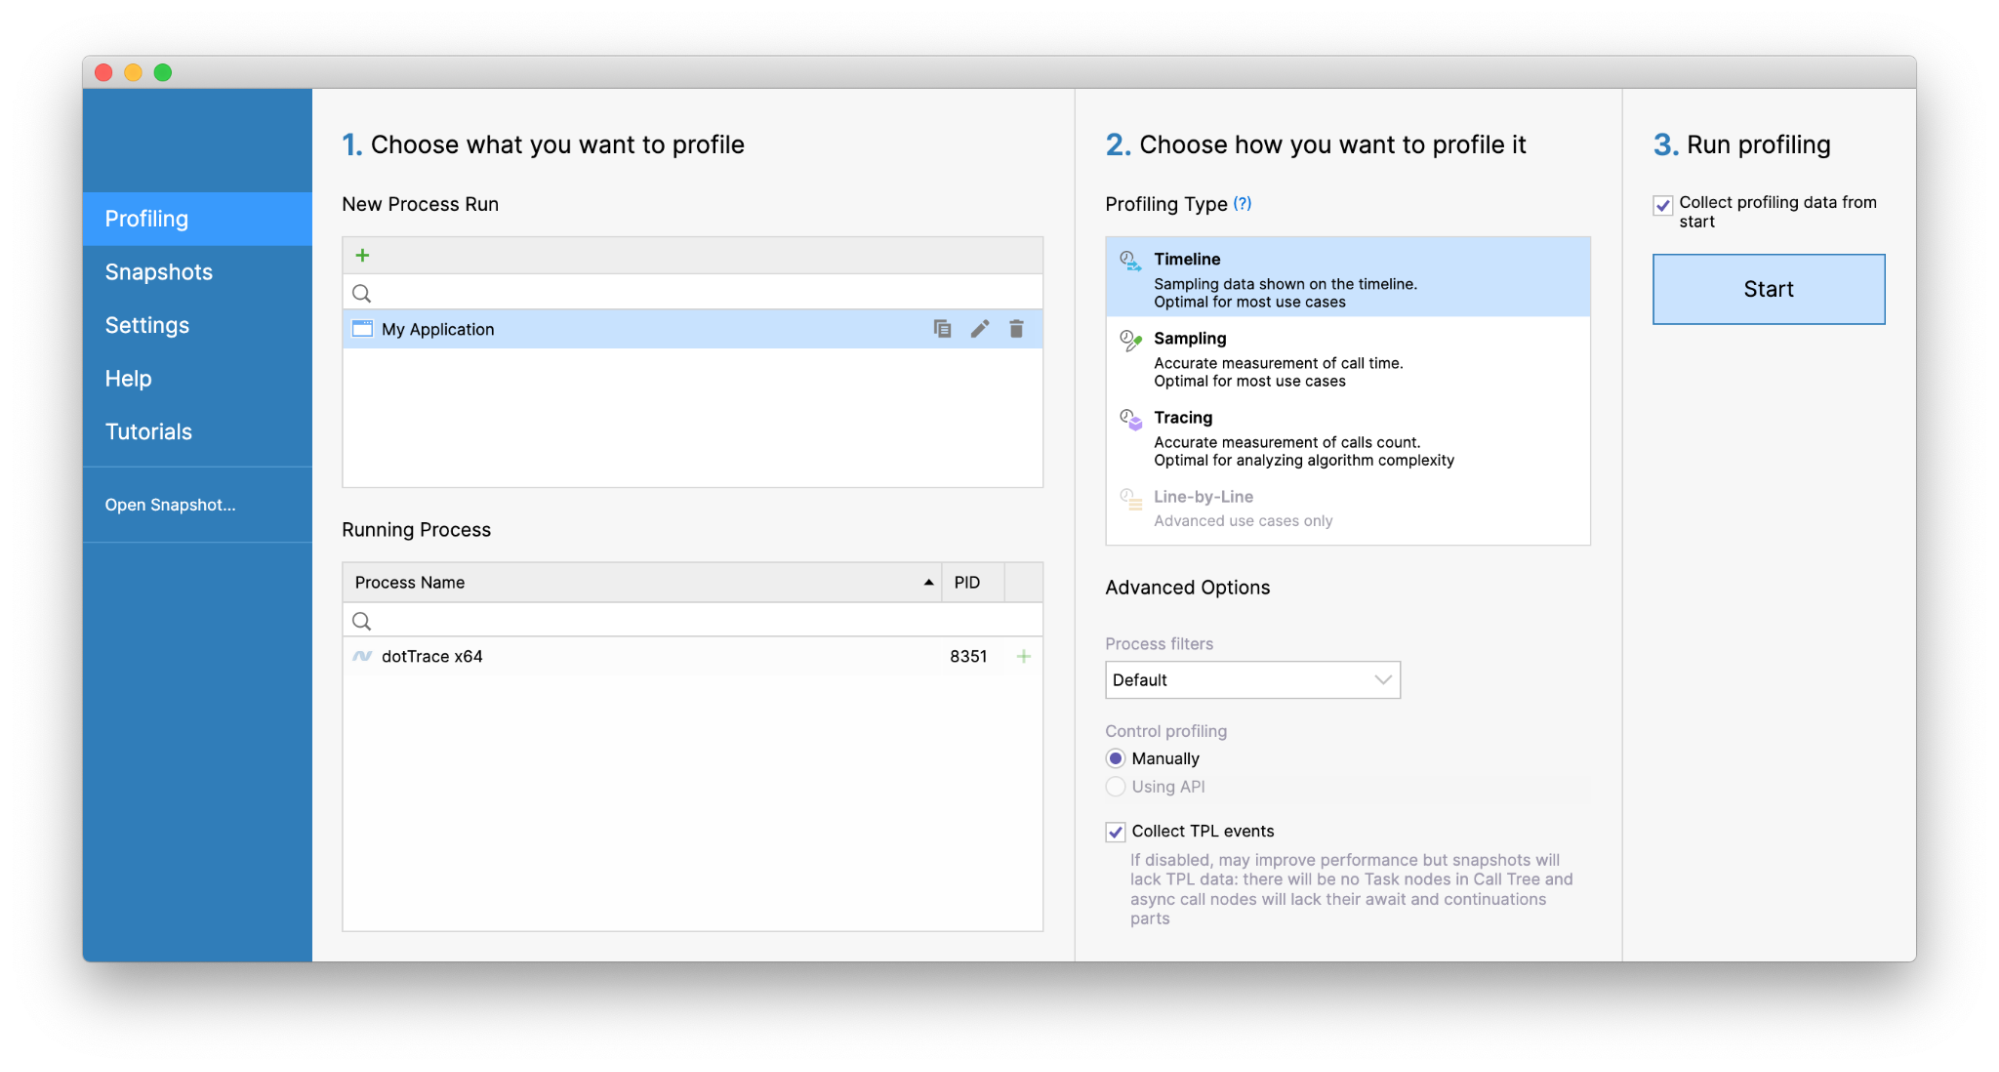
New Home Screen 2021.1
We’ve completely reworked the dotTrace Home screen. It’s much easier to configure and start new profiling sessions, work with snapshots, and perform other basic operations.
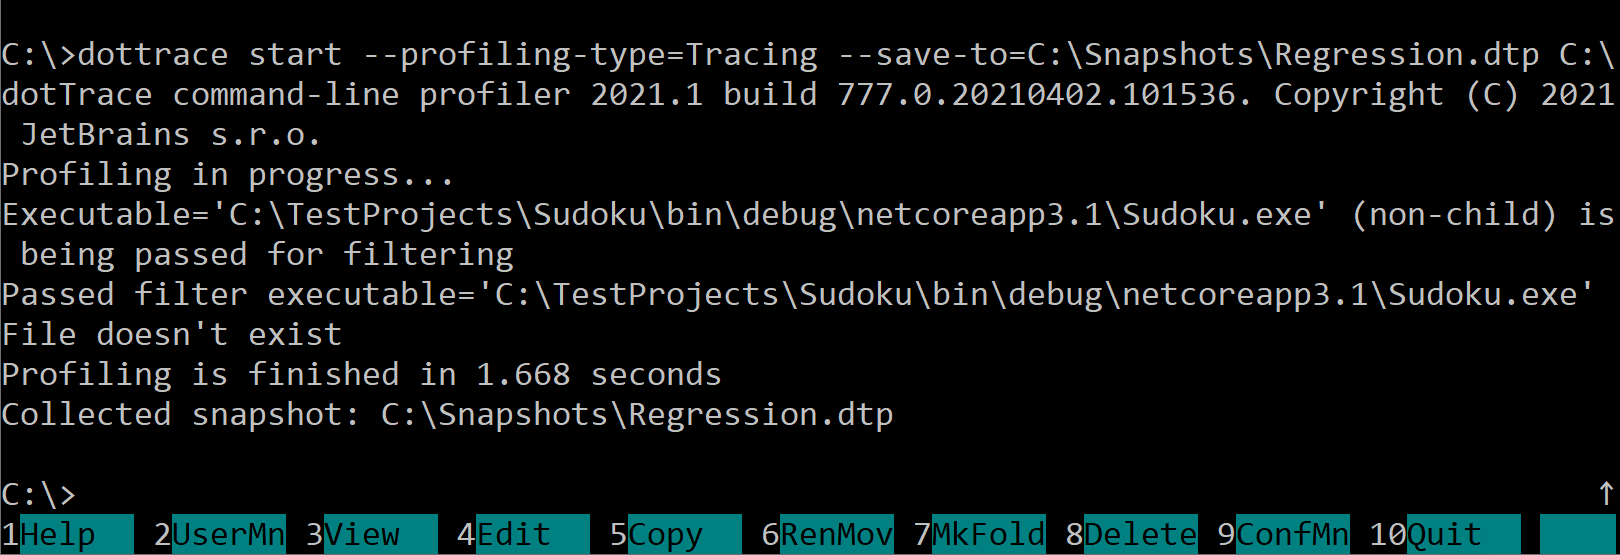
Command-line profiler as a .NET global tool 2021.1
You can install and use the dotTrace command-line profiler as a dotnet global tool:
dotnet tool install --global JetBrains.dotTrace.GlobalTools --version 2021.1.0