What′s New in dotTrace
This page details the latest updates and changes in dotTrace.
Reworked Monitoring tool window in JetBrains Rider 2025.2
The Monitoring tool window in Rider has been reworked to provide a more visual and integrated profiling experience. It now includes interactive charts for CPU usage, memory consumption, and garbage collection (GC) activity, giving you an at-a-glance view of your application's runtime behavior.
From the tool window, you can initiate performance or memory profiling sessions for deeper analysis in the built-in dotTrace and dotMemory profilers or their standalone counterparts. On Windows, the Monitoring tool also automatically detects performance bottlenecks, UI freezes, and GC issues. Detected problems and time intervals selected on the charts can be further investigated in dotTrace.
Tabbed snapshot analysis 2025.1
In this release, we’re introducing tabs to dotTrace. You can now open the same snapshot in multiple tabs with different filter configurations. This lets you examine various aspects of your performance data simultaneously. You can analyze one dataset in one tab while applying different filters in another and switch between views without resetting your filters.

Undo/Redo and filter history 2024.3
We’ve introduced comprehensive support for the Undo and Redo actions and filter history in the standalone version of dotTrace. Now, each filter change is recorded, making it easy to revert to any previous state. Use the Undo button or hotkey to undo the latest change and the Redo button to reapply it. You can also access a drop-down list to revert multiple steps at once, with changes listed in chronological order.
Improved performance 2024.2
All versions of dotTrace receive several performance improvements, including faster processing of Timeline snapshots and data on the Call Tree and Hotspots views.
Other improvements and bug fixes 2024.2
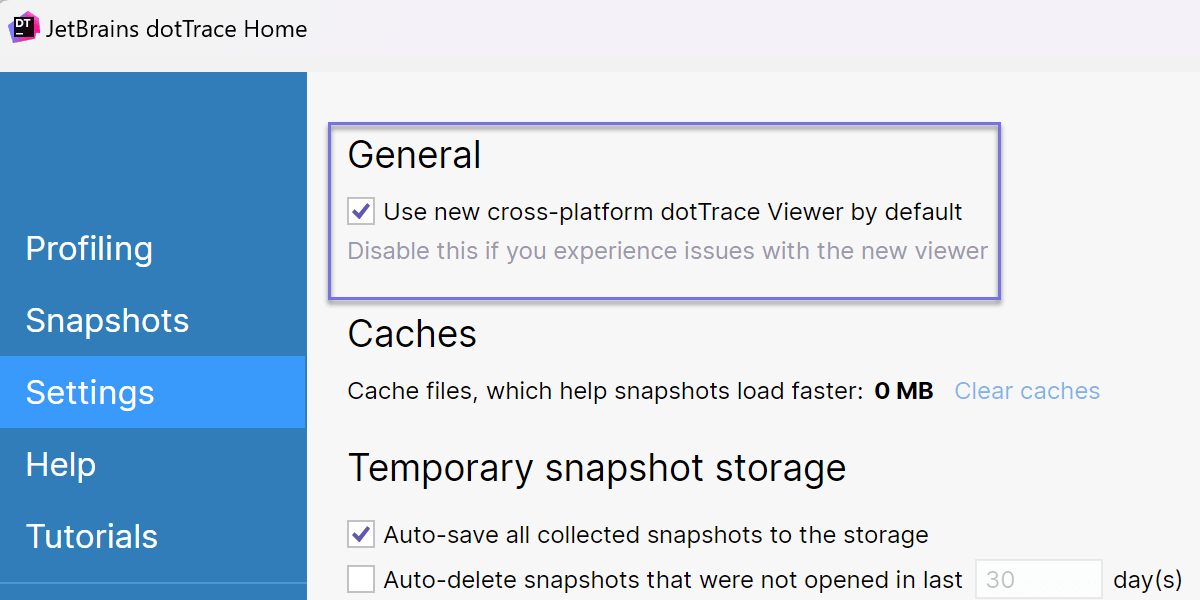
- dotTrace Viewer now uses a new rendering engine across all platforms. If you encounter issues with the updated viewer, you can disable the Use new cross-platform dotTrace Viewer by default option in dotTrace Home | Settings.
- The standalone version of dotTrace for macOS and Linux gets the Options window.
- We fixed the issue with missing kernel events on Windows: Kernel sampling events were missing in Timeline snapshots due to interference from Windows Defender.
- We've also made other smaller improvements and bug fixes to enhance usability.
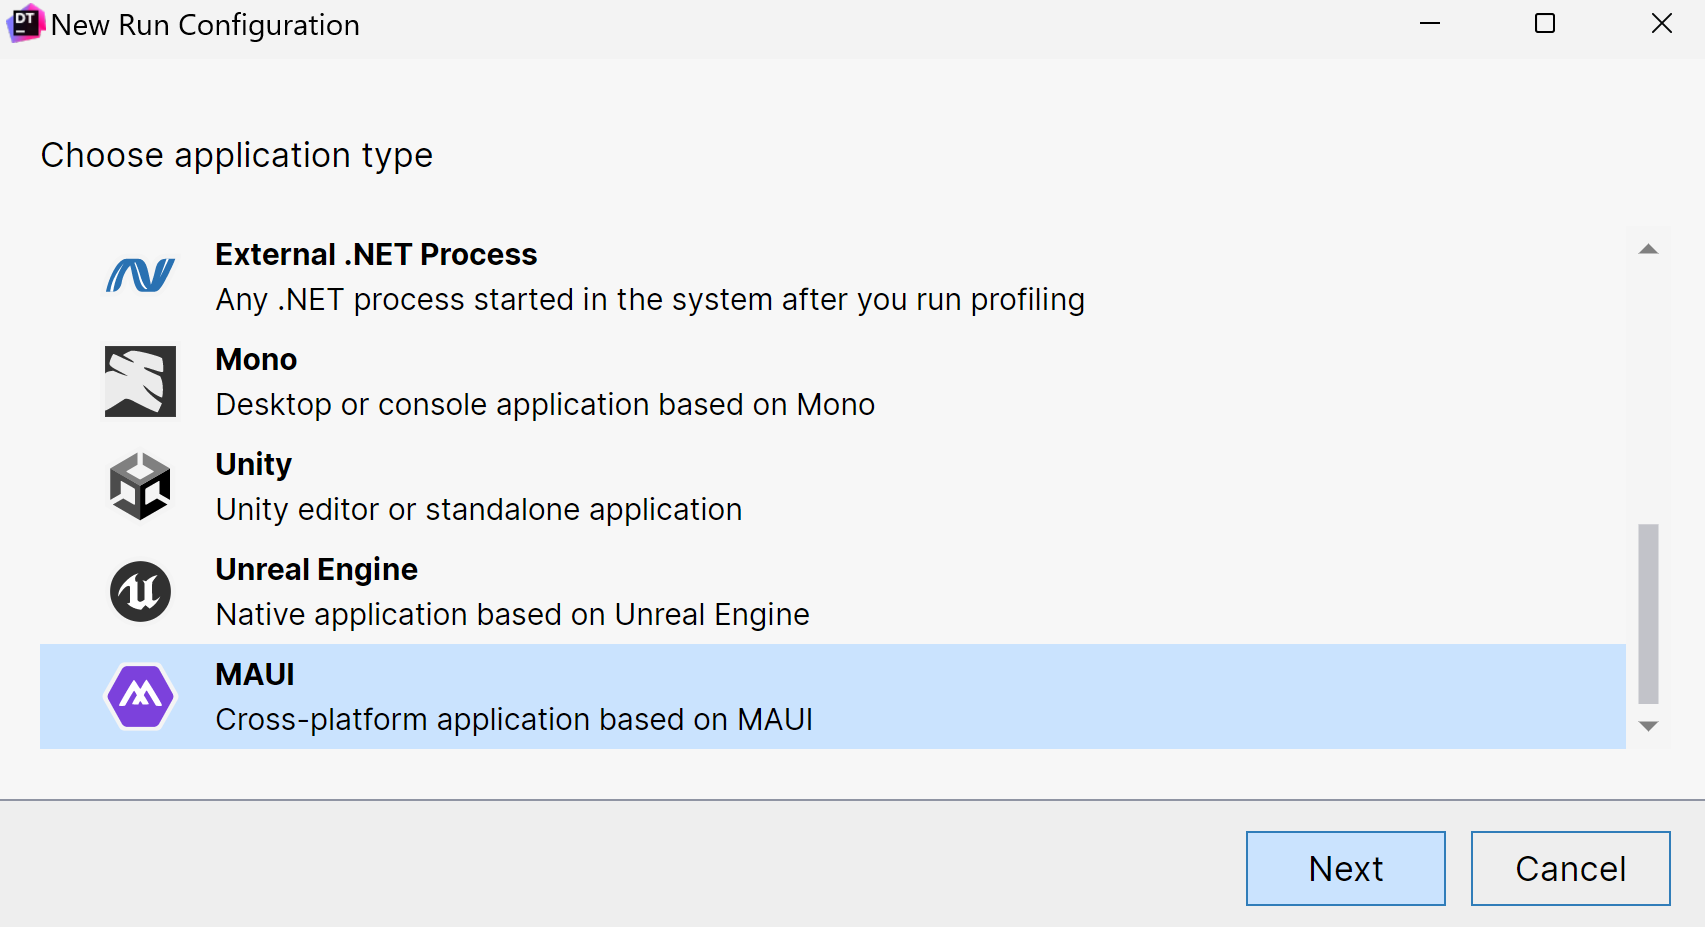
Support for MAUI applications 2024.1
Now, you can profile applications based on the MAUI framework.
Currently, dotTrace supports:
- macOS – Mac Catalyst applications targeting .NET 7.0+. Timeline profiling only.
- Windows – WinUI applications targeting .NET 7.0+. All profiling types are supported. Attaching to already running applications is available only for the Timeline and Sampling types.
The support is available for dotTrace standalone and dotTrace integrated into Rider and ReSharper.
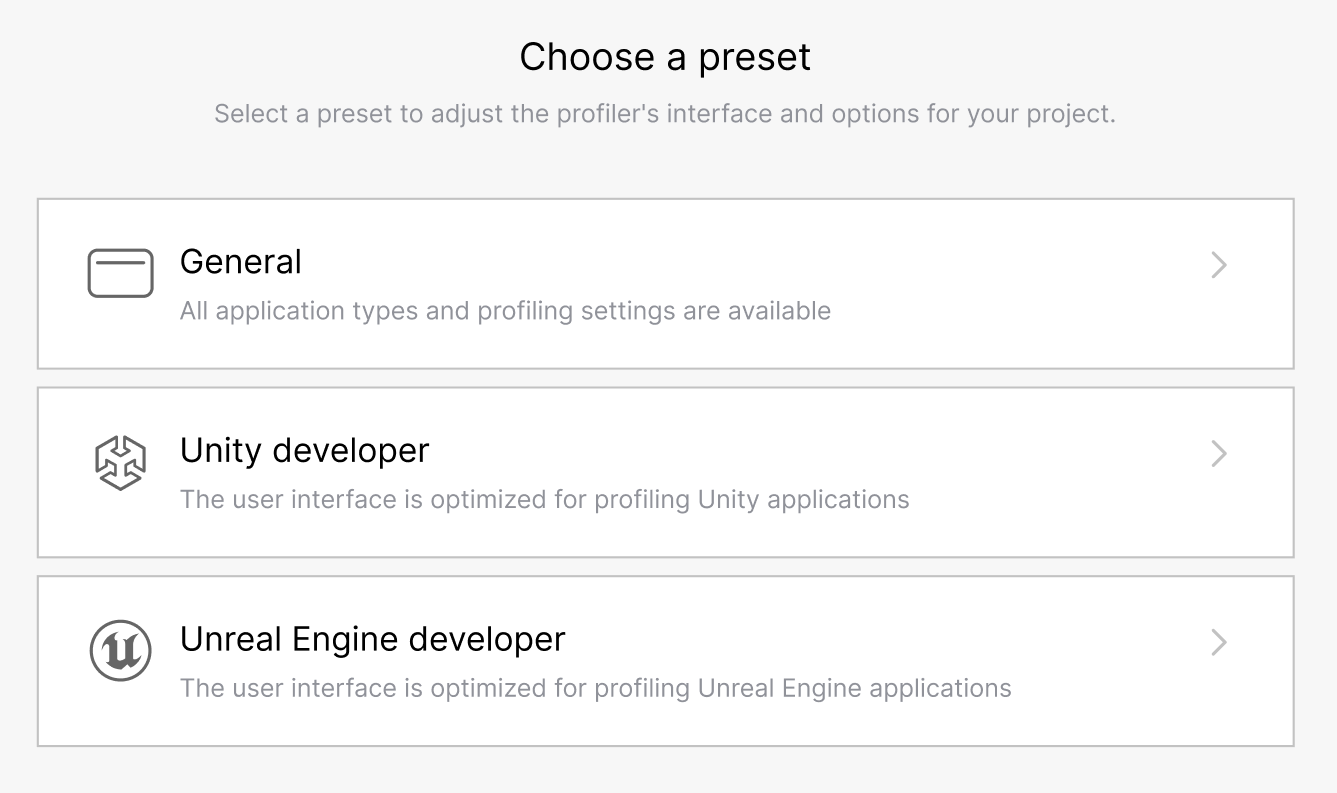
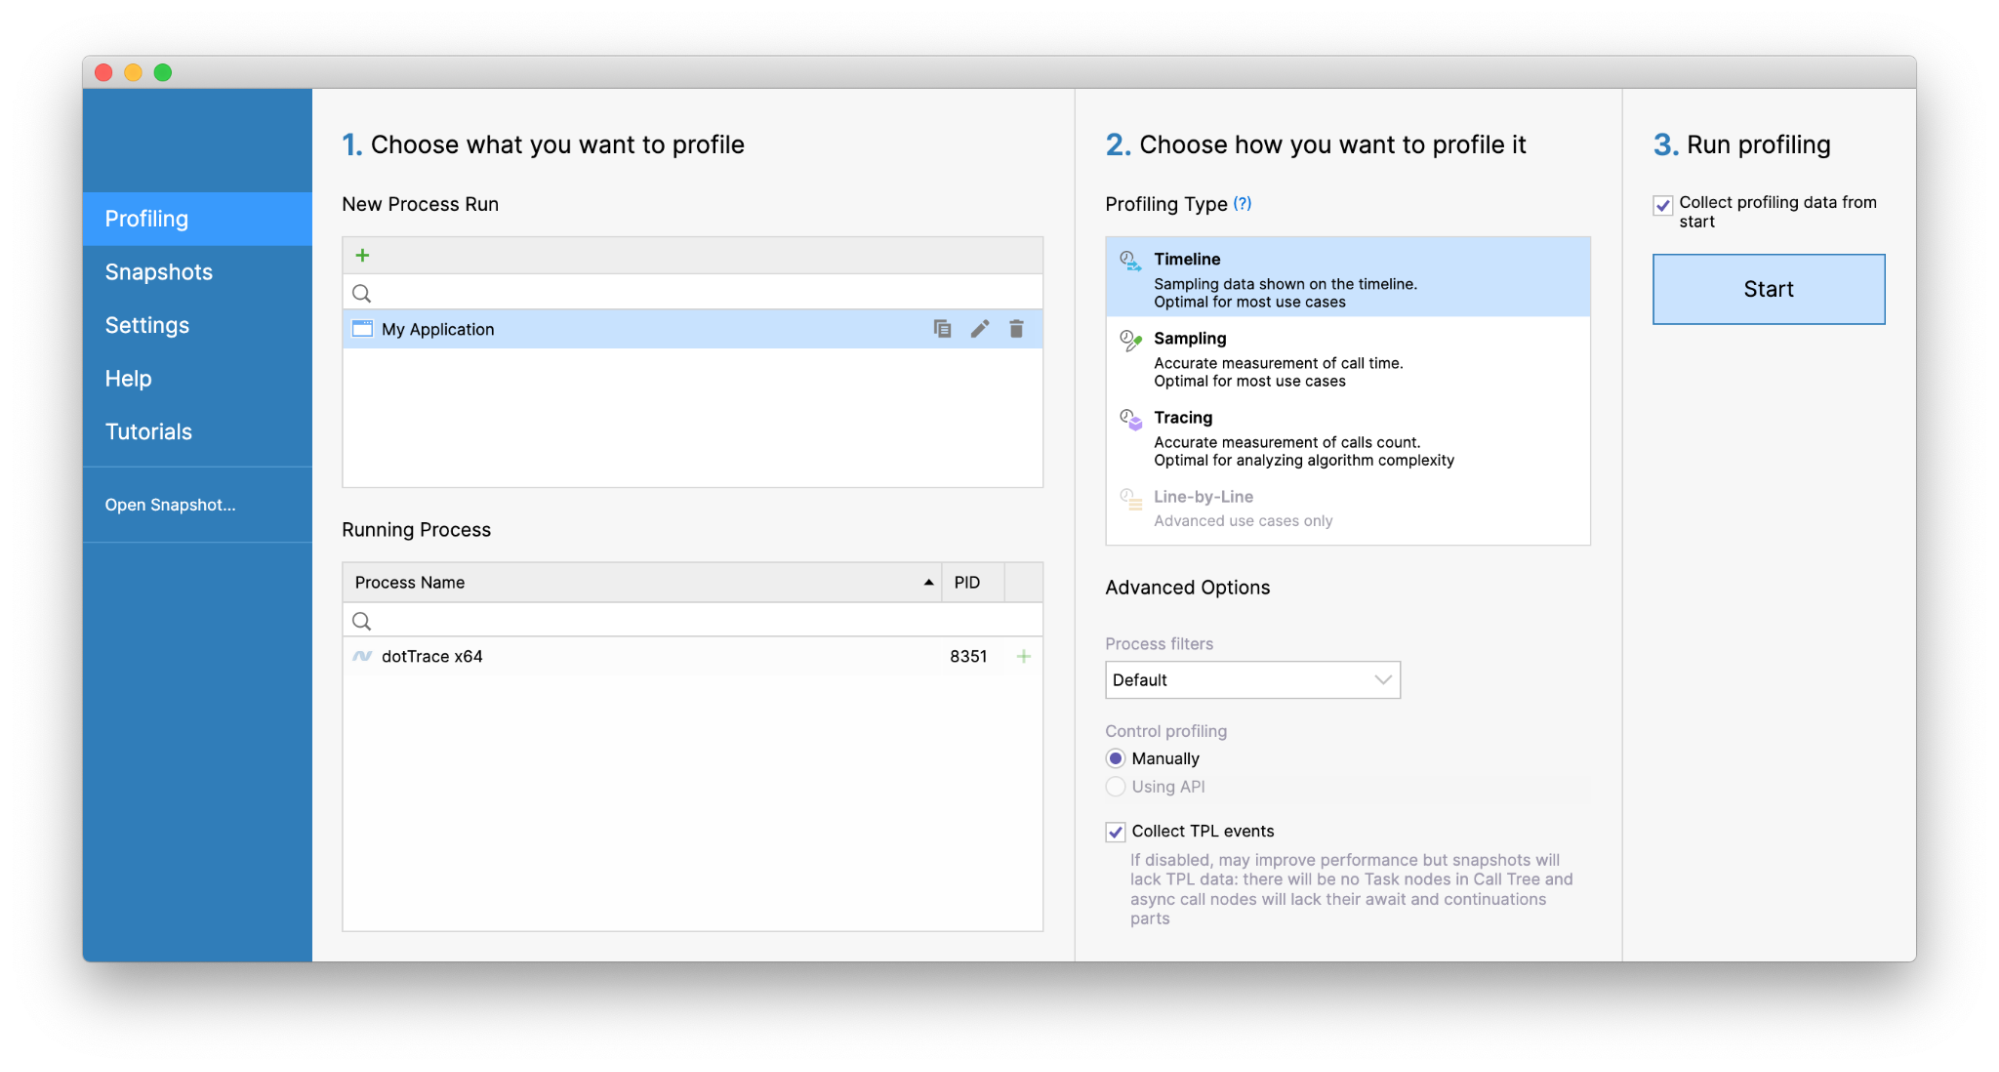
Profiling presets 2024.1
dotTrace now includes user interface (UI) presets. The presets adjust the UI to show only the profiling settings relevant to specific applications: General (all application types), Unity developer, and Unreal Engine developer.
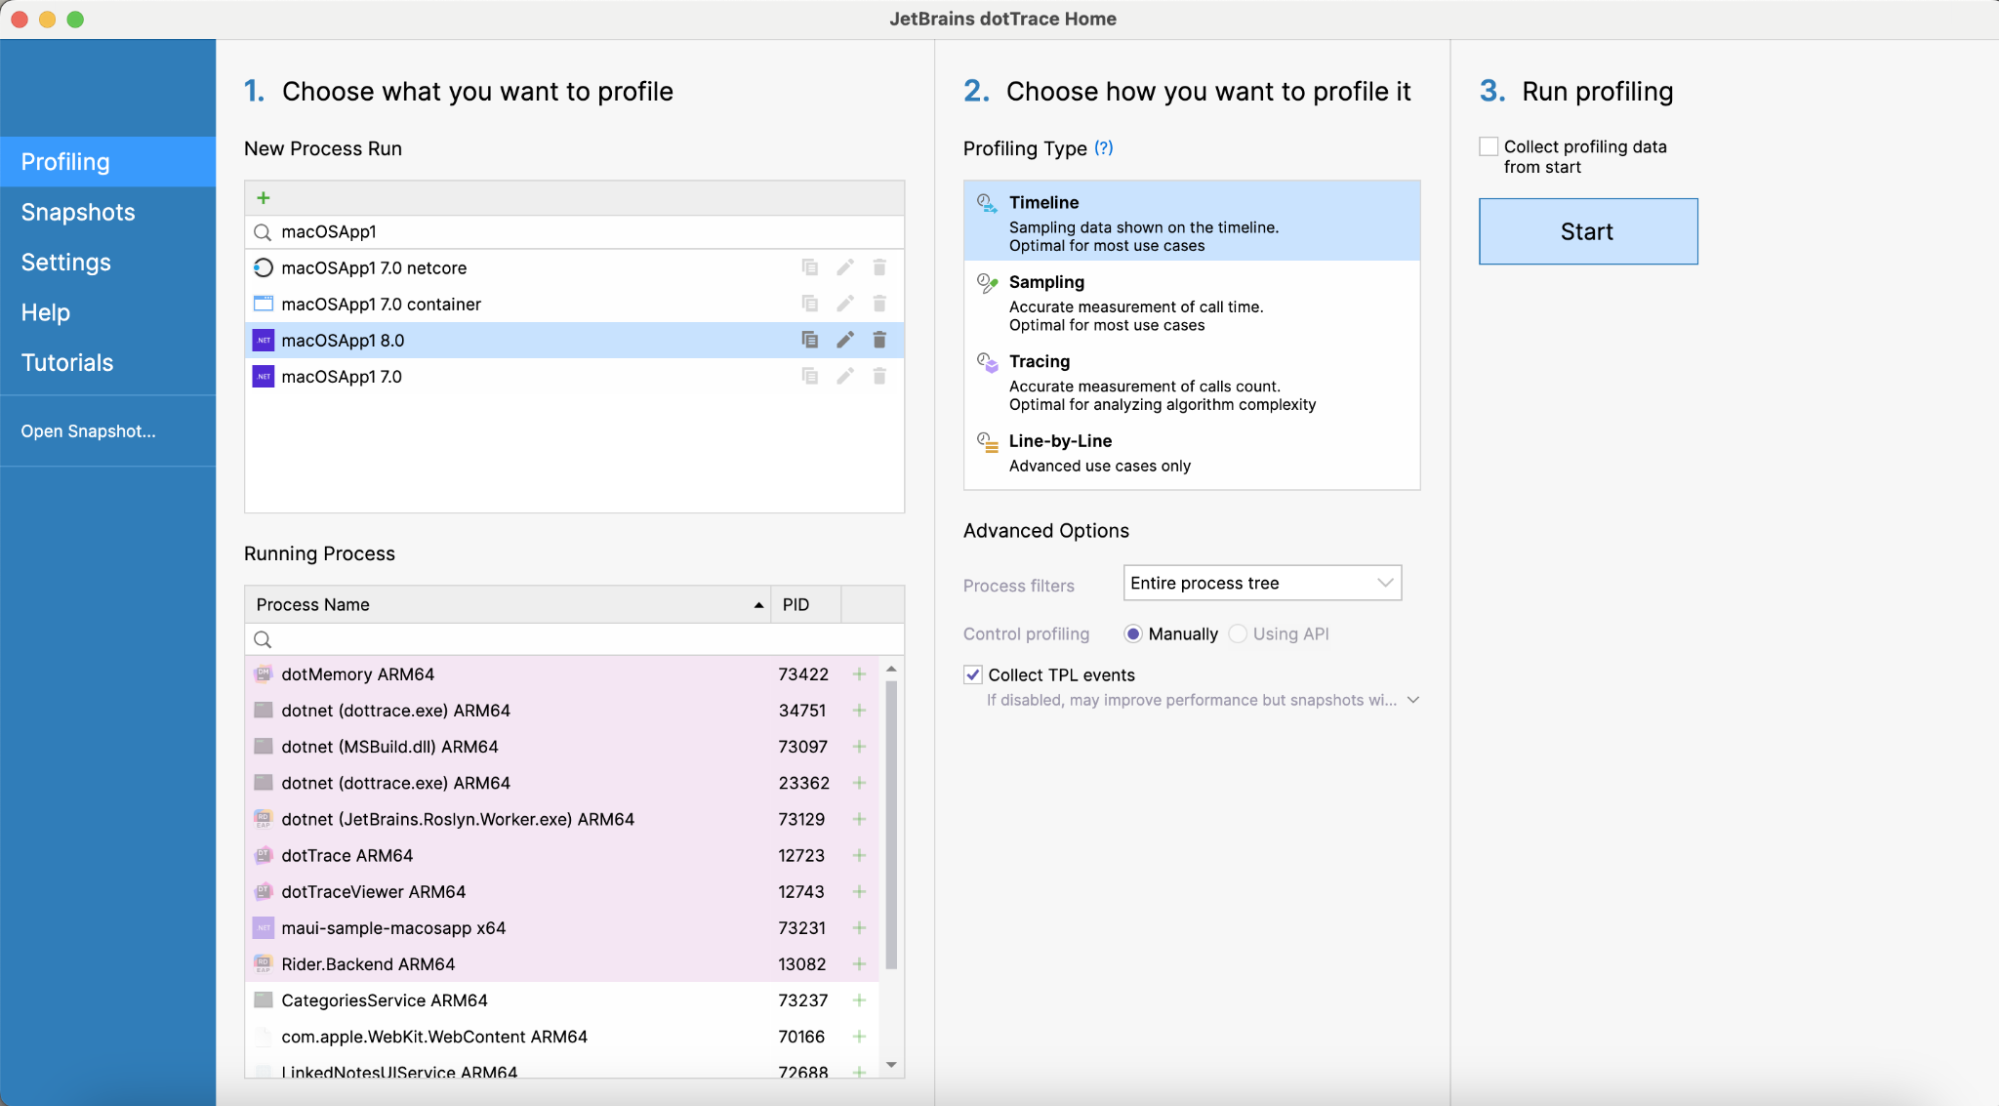
Improved support for macOS 2024.1
We improved profiling on macOS:
-
Now, the standalone version of dotTrace lets you specify application bundles
(
.app) instead of executable files. -
dotTrace in Rider can profile macOS run configurations. The following
target frameworks are supported:
net7.0-macos,net8.0-macos,net7.0-maccatalyst,net8.0-maccatalyst,Xamarin.Mac.
Improved configuration of the Timeline profiling mode 2023.3
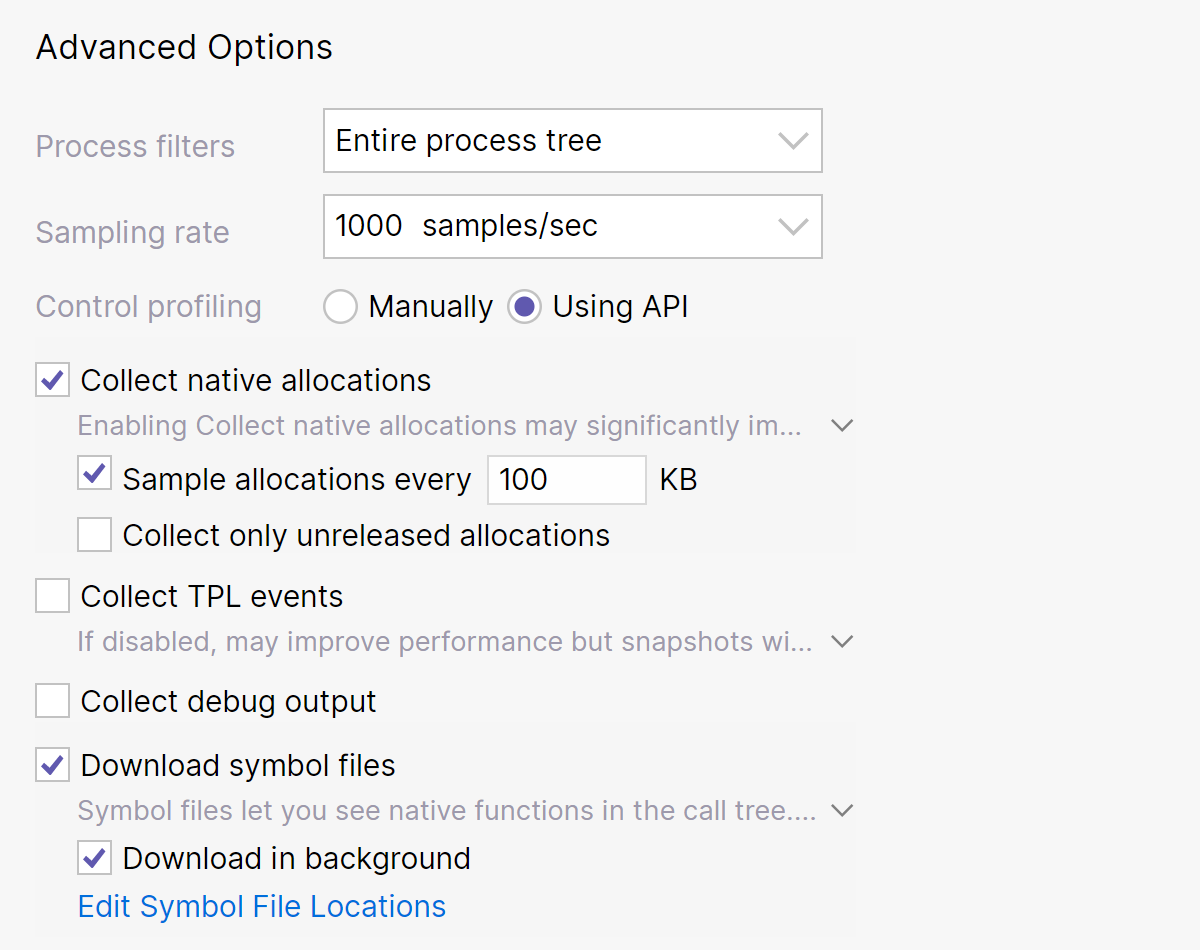
Now, when configuring a Timeline profiling session, you can specify the following advanced options:
- Sampling rate – Lets you find the optimal balance between the performance of the profiled application and data accuracy.
- Sample allocations every … KB for native allocations – Lets you improve the performance of snapshot analysis by reducing the amount of collected data, i.e. snapshot size.
- Download in background option for native symbol files – Downloads symbol files during the profiling session.
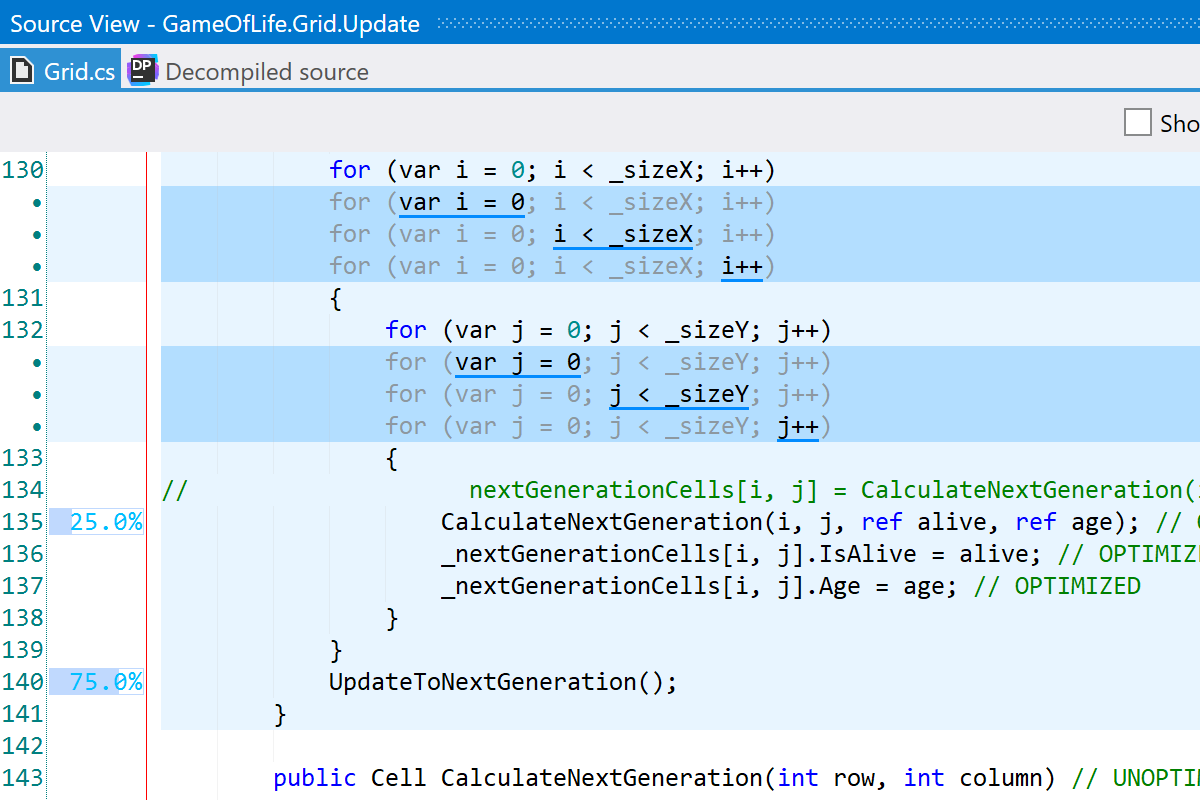
Profiling data in the Source view 2023.3
Instead of analyzing the Call Tree, you can now view performance profiling data right in the source code. The Source view displays time distribution information for specific lines of code. As of now, this feature is only available for timeline snapshots taken on Windows.
Improved native code analysis 2023.3
- Source code for native methods can now be viewed for timeline snapshots taken on Windows.
- Native threads are now displayed by default if there are no managed threads.
Other improvements 2023.3
-
The timeline profiling mode now supports the
System.Data.SqlClientdata provider for the .NET and .NET Core frameworks. You can view the corresponding events in the SQL Queries filter. - You can now view performance metrics inside the search window in the dotTrace viewer.
- Support for integration with third-party tools is now available on Linux and macOS.
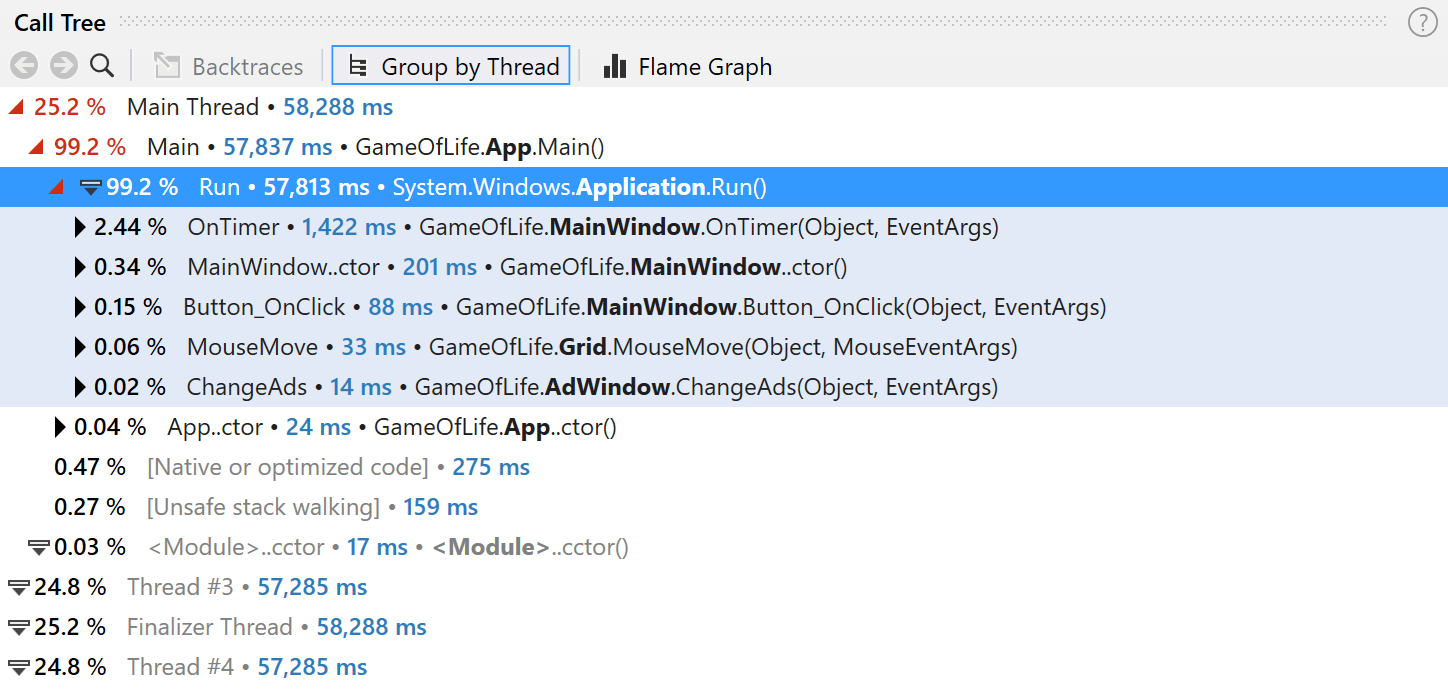
Grouping by a thread for sampling, tracing, and line-by-line snapshots 2023.2
Now, the Call Tree view lets you group call stacks by individual threads, allowing deeper insight into thread-specific performance issues.
Source View tool window on Linux and macOS 2023.2
The standalone version of dotTrace on Linux and macOS gets the Source View window. After you select a call in the Call Tree, Source View will show you the source code of the corresponding method.
Other improvements and bug fixes 2023.2
- For Timeline snapshots, dotTrace Viewer now shows the names of native threads instead of showing them all as Native. This feature will benefit Unity developers, letting them distinguish specific Unity threads. Available only on Windows.
- The Source View window in dotTrace Viewer now shows the number of invocations for each line of code.
dotTrace for macOS and Linux Beta 2023.1
The standalone version of dotTrace is now available on Linux and macOS. Now, you can perform the full profiling workflow on these operating systems, including collecting and analyzing performance snapshots.