Debugging assistance
ReSharper streamlines your debugging experience in C#, VB.NET, and C++ with inline debugging adornments and searchable DataTips, and also brings a number of breakpoint navigation features to all supported languages. On top of that, ReSharper helps you debug any external modules, even those that do not have debug information.
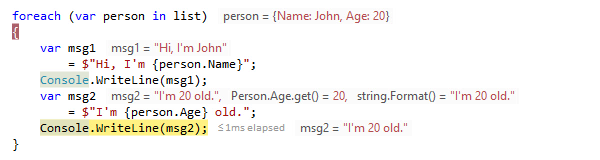
Inline debugging adornments
When you suspend execution while debugging your code, you can see values of local
variables, current line expressions, and function returns right in the editor,
next to the corresponding code lines.
ReSharper understands the
[DebuggerDisplayAttribute],
which means that values of types, properties, and fields marked with this attribute
will be displayed accordingly in the editor adornments.
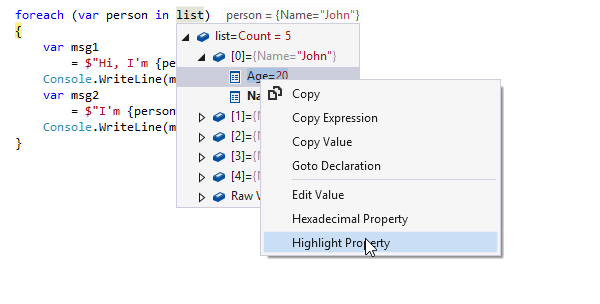
Improved, searchable DataTips
ReSharper provides an improved replacement for Visual Studio DataTips:
- You can search for specific values in the current suspended-execution context by typing in the DataTip.
-
If a type neither has a meaningful
ToString()override nor is it annotated with the[DebuggerDisplayAttribute], the presentation of objects of this type in debugger views could be quite uninformative. In ReSharper DataTips, you can customize presentation of such objects on-the-fly. - ReSharper DataTips do not disappear when you remove the mouse pointer, they stay on until you press Esc or click anywhere outside the DataTip.
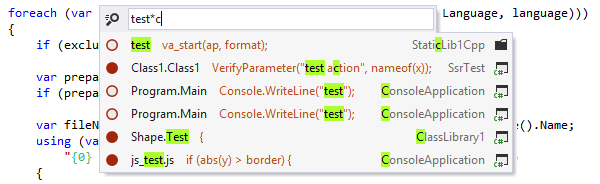
Go to Breakpoints
With ReSharper, you can quickly jump to any breakpoint/tracepoint in your solution with
Ctrl+Alt+F9 (ReSharper | Navigate | Breakpoints).
In the list that initially includes all breakpoints in your solution,
you can start typing to filter the results by context and then navigate
directly to the desired breakpoint.
You can also press
Delete right in the list to remove breakpoints.
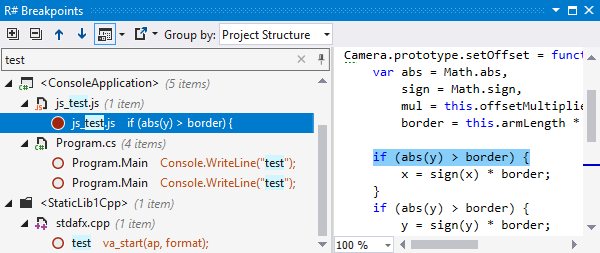
ReSharper Breakpoints window
ReSharper brings its own R# Breakpoints window, which you can use as an alternative to the native Visual Studio window. In ReSharper's window, you can:
- group breakpoints by file/folder/project/type/member,
- start typing in the window to search for a breakpoint by its context,
- use the context menu to enable/disable or remove breakpoints,
- get the preview of the code where the selected breakpoint is set,
- export breakpoints to a text, XML, or HTML file.
You can also see, toggle, and enable/disable breakpoints in the Find Results window, which is quite handy — for example, you can quickly set breakpoints for all the occurrences of a symbol that you are going to debug.
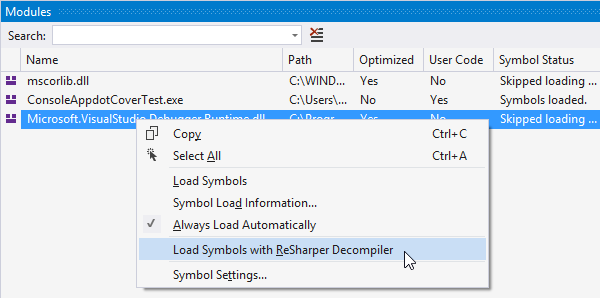
Debugging modules that have no debug information (PDB)
With ReSharper, you can debug any compiled module, even if it does not have debug information (PDB). ReSharper will decompile the module, generate PDB for it, and automatically load decompiled symbols for this module into the Visual Studio debugger.
Note on shortcuts
All keyboard shortcuts provided in this page are available in ReSharper's default "Visual Studio" keymap. For details on ReSharper's two keymaps, see ReSharper Documentation.