Unit testing
ReSharper provides a unit test runner that helps you run and debug unit tests based on NUnit, xUnit.net, MSTest, QUnit and Jasmine. You can explore tests, group them in different ways, break them down into individual sessions, see test output and navigate to source code from stack traces.
With dotUltimate, you can also run tests continuously, measure test coverage and performance.
Running and debugging unit tests
ReSharper automatically detects unit tests of NUnit, XUnit and MSTest frameworks in your .NET and .NET Core projects. Other unit testing frameworks such as MSpec are supported via ReSharper plugins.
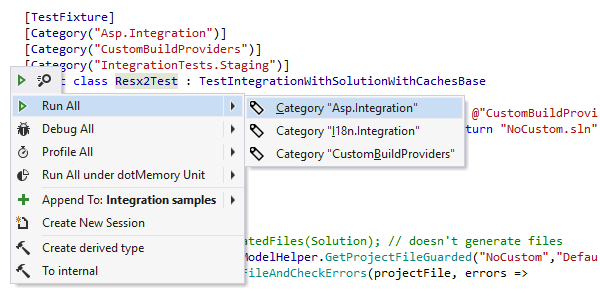
Next to declarations of test classes and single tests, ReSharper adds special icons, which you can click to run or debug tests. Alternatively, you can press Alt+Enter when your caret is on a test declaration.
Tests can also be executed from the context menu. In addition, you can run or debug an arbitrary set of unit tests from Visual Studio's Solution Explorer. Just select a file, folder, project or solution, and press Ctrl+U, R or Ctrl+U, D; alternatively, right-click the selection and choose Run unit tests or Debug unit tests.
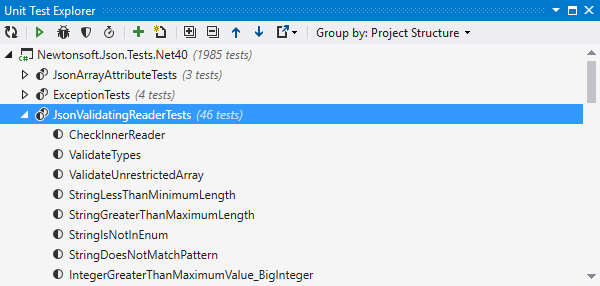
Unit Test Explorer
ReSharper presents Unit Test Explorer — a structured list of unit tests for reviewing the structure of tests in your whole solution. The tree is available with the Ctrl+Alt+U shortcut or via the menu, and is quickly populated after you build your project. Using Unit Test Explorer, you can run any combination of tests in one or more unit test sessions.
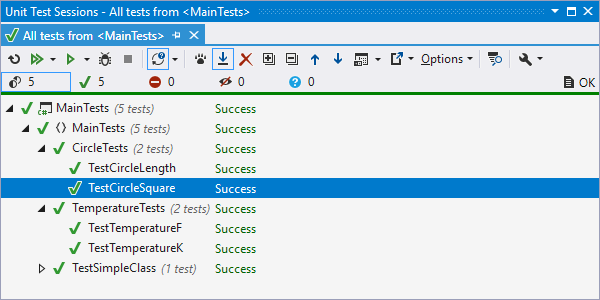
Unit Test Sessions
ReSharper runs unit tests in the Unit Test Sessions window. It is designed to help you run any number of unit test sessions, independently of each other, as well as simultaneously. Sessions can be composed of any combination of tests. In debugging mode, only one session can be run at a time.
The unit test tree shows the structure of tests belonging to a session, which you can filter to show only passed, failed or ignored unit tests. You can navigate to the code of any unit test by double-clicking it.
The progress bar and the status bar display the current progress. You can stop, run or re-build and re-run unit tests at any time.
The preview pane lets you analyze test results and navigate from a failed test's output to the code lines that originated the exception, all with a single click.
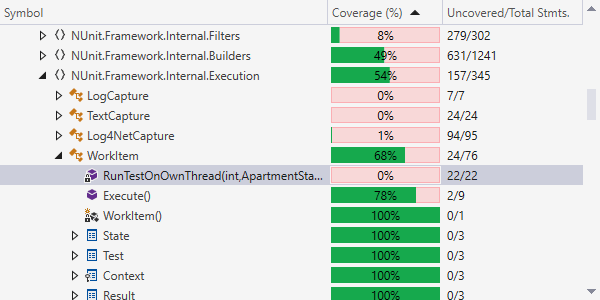
Analyzing code coverage with dotCover
With JetBrains dotCover (which is also available with the dotUltimate license), you can easily discover the degree to which the code of your solution is covered with unit tests.
When you install dotCover, it will analyze and visualize code coverage on unit tests from the selected scope and reveal code that is not covered with unit tests. This can be very helpful for setting the right priorities in application development and quality assurance.

Continuous testing with dotCover
If you use dotUltimate or dotCover, enjoy continuous testing: a modern unit testing workflow whereby dotCover figures out on-the-fly which unit tests are affected by your latest code changes, and automatically re-runs the affected tests for you.
dotCover can detect and/or run affected tests on saving a file, on building your solution or soon as you explicitly tell dotCover to do so.
You can use continuous testing with all your unit tests, or specify exactly which tests you want to run continuously and which to run in a traditional way.
Profiling unit tests with dotTrace
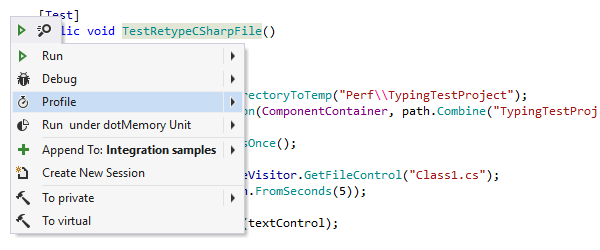
You can also quickly profile the performance of unit tests from Visual Studio via JetBrains dotTrace, a powerful .NET performance profiling tool and a part of dotUltimate.
With dotTrace installed, you will be able to start profiling directly from the editor using the sidebar marks that ReSharper adds for test classes and individual tests.
Monitoring memory usage with dotMemory Unit
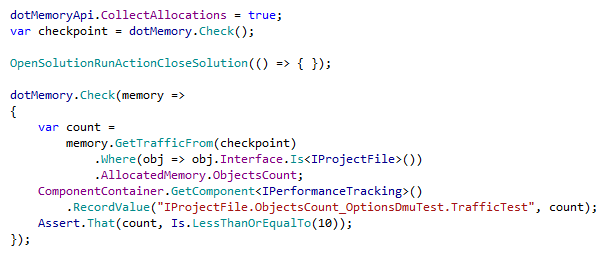
To analyze memory usage right from your unit tests, use dotMemory Unit, a free memory unit testing framework from JetBrains.
As soon as you reference dotMemory Unit, you will be able to make your unit tests pass or fail depending on memory traffic, presence of specific objects in memory, and other factors indicative of memory usage in your application.
Note on shortcuts
All keyboard shortcuts provided in this page are available in ReSharper's default "Visual Studio" keymap. For details on ReSharper's two keymaps, see ReSharper Documentation.