Debug JavaScript in Chrome
WebStorm provides a built-in debugger for your client-side JavaScript code.
The video and the instructions below walk you through the basic steps to get started with this debugger.
Before you start
Make sure the JavaScript Debugger bundled plugin is enabled in the settings. Press Ctrl+Alt+S to open settings and then select . Click the Installed tab. In the search field, type JavaScript Debugger. For more information about plugins, refer to Managing plugins.
Configure the built-in debugger as described in Configuring JavaScript debugger.
To have the changes you make to your HTML, CSS, or JavaScript code immediately shown in the browser without reloading the page, activate the Live Edit functionality. For more information about the live editing functionality, refer to Live Edit in HTML, CSS, and JavaScript.
Debug an application that is running on the built-in server
WebStorm has a built-in web server that can be used to debug your application in a web browser or preview your code in the WebStorm built-in browser. This server is always running and does not require any manual configuration.
Start debugging
Set the breakpoints in the JavaScript code, as required.
Open the HTML file that references the JavaScript to debug or select the HTML file in the Project tool window.
From the context menu of the editor or the selection, choose Debug <HTML_file_name>. WebStorm generates a debug configuration and starts a debugging session through it. The file opens in the browser, and the Debug tool window appears.
In the Debug tool window, proceed as usual: step through the program, stop and resume program execution, examine it when suspended, explore the call stack and variables, set watches, evaluate variables, view actual HTML DOM, and so on.
Example
Let's suppose that you have a simple application that consists of a debug_from_run.html file and a debug_from_run.js file, where debug_from_run.html references debug_from_run.js.

To start debugging this application using the built-in server, set a breakpoint in debug_from_run.js, open debug_from_run.html in the editor, and select from the context menu.

WebStorm creates a run/debug configuration automatically, and a debugging session starts.

To restart the new run/debug configuration, select it from the list and click ![]() .
.

Reload the current page in browser
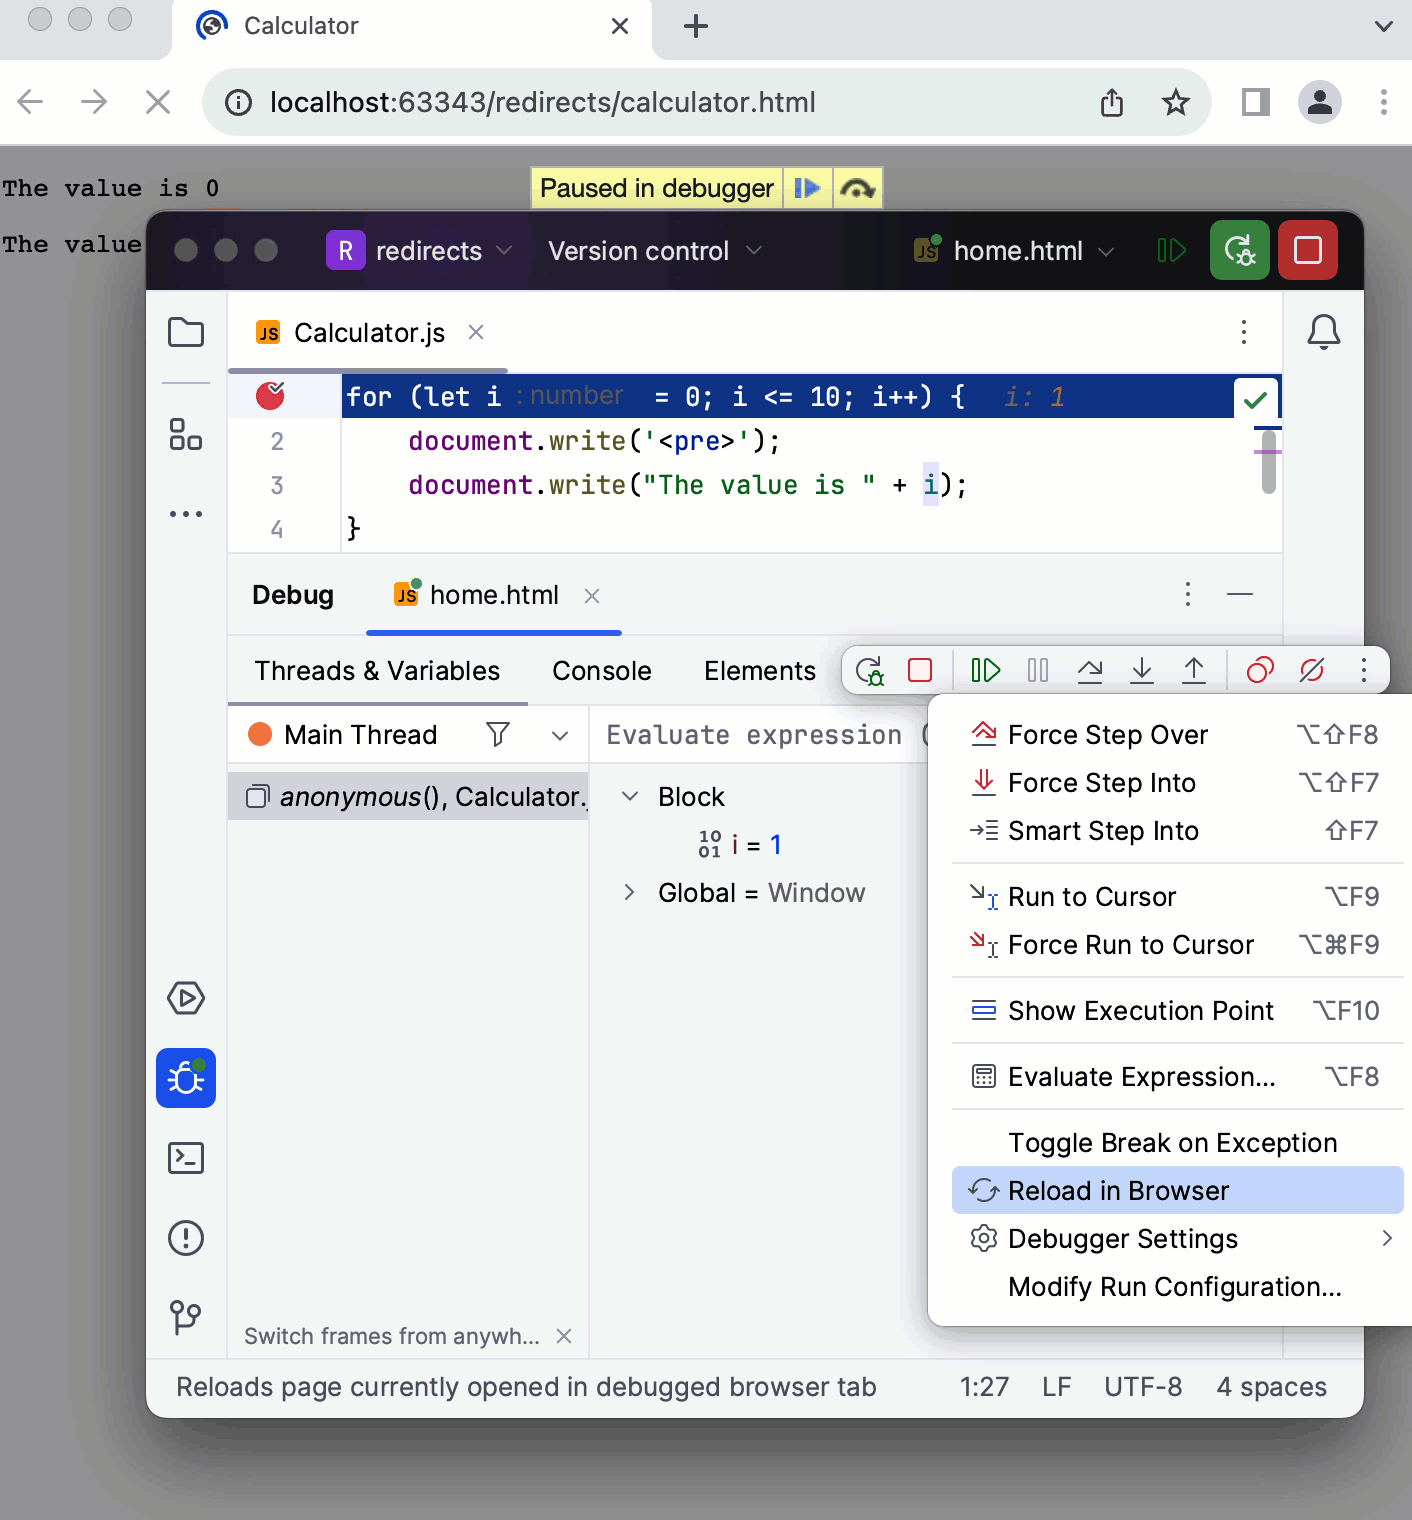
Besides restarting your application by clicking the Rerun button (![]() ) in the Debug tool window, you can also use the Reload in Browser action to reload the page where you have currently navigated. This works the same way as the Reload Page functionality (Ctrl+R) in Chrome.
) in the Debug tool window, you can also use the Reload in Browser action to reload the page where you have currently navigated. This works the same way as the Reload Page functionality (Ctrl+R) in Chrome.
To reload the current page, click
 on the toolbar and select Reload in Browser (
 ).
).
The example below shows a simple application that consists of two HTML pages and a JavaScript script. The starting home.html page has a Submit button on pressing which the calculator.html page opens with the results of the Calculator.js script execution.
During a debugging session, clicking the Rerun button (![]() ) reloads the home.html page with the Submit button. Clicking the Reload in Browser button (
) reloads the home.html page with the Submit button. Clicking the Reload in Browser button (![]() ) reloads the calculator.html page so all the previous script output is cleared and the debugger returns to line 1 in Calculator.js.
) reloads the calculator.html page so all the previous script output is cleared and the debugger returns to line 1 in Calculator.js.
Debug an application running on the localhost in the development mode
If your application is running in the development mode on localhost, you can start debugging it from the built-in Terminal (Alt+F12), from the Run tool window, or from the Debug tool window. Just hold Ctrl+Shift and click the URL at which the application is running.
Set the breakpoints in your code.
Start the application in the development mode, for example, using an npm script.
The Run tool window or the Terminal shows the URL at which your application is running. Hold Ctrl+Shift and click this URL link. WebStorm starts a debugging session with an automatically generated configuration of the type JavaScript Debug.

This also works for debugging Vue.js, Angular, React, and Node.js applications.
Debug an application that is running on a remote web server
Often you may want to debug client-side JavaScript of an application that is running on an external development web server.
What is a remote web server?
In WebStorm, any server with the document root outside the current project is called remote. This server may be actually running on a physically remote host or on your machine.
For example, if your project is in C:/WebStormProjects/MyProject and the web server document root is C:/XAMPP/htdocs, for WebStorm this web server is remote.
How do I synchronize my application sources on the server with their local copies in my WebStorm project?
To debug an application on a remote web server, you need to have the copies of its sources in a WebStorm project. To synchronize local and remote sources, create a deployment configuration as described in Create a remote server configuration and Connect to a web server.
Debug an application on a remote web server
Set the breakpoints in the JavaScript code, as required.
Create a run/debug configuration of the JavaScript Debug type:
Go to , then in the Edit Configurations dialog, in the Edit Configurations dialog that opens, click the Add button (
 ) on the toolbar and select JavaScript Debug from the list.
 In the Run/Debug Configuration: JavaScript Debug dialog that opens, specify the URL address at which the application is running. This URL address should be a concatenation of the Web server root URL and the path to the HTML file relative to the web server document root in accordance with server access configuration. For more information, refer to Connect to a web server.
Click OK to save the configuration settings.
Choose the newly created configuration in the Select run/debug configuration list on the toolbar and click the Debug button
 . The HTML file specified in the run configuration opens in the chosen browser and the Debug tool window appears.
In the Debug tool window, proceed as usual: step through the program, stop and resume program execution, examine it when suspended, explore the call stack and variables, set watches, evaluate variables, view actual HTML DOM, and so on.
Example: Debug without mappings
Suppose you have a simple application that consists of an index.html file and an App.js file, where index.html references App.js.
Let's now deploy our simple application to a local web server , refer to Deploy your application. In the following example, it is Apache:

When using a local web server, such as Nginx or Apache, as in our example, or the web server is on a remote host, you need to create a Run/Debug configuration to start the JavaScript debugger. To do that, click the list at the upper right-hand corner of the WebStorm window and choose Edit Configurations. Alternatively, choose from the main menu:

In the Run/Debug Configurations dialog, click
and choose JavaScript Debug from the list:
Specify the URL of your running application, in our example it is
http://localhost:8888/MySimpleApp/index.html
In our example, the local project structure and the file structure on the server are the same so no mappings are required.
Now we can start debugging: choose the new run/debug configuration from the list in the upper right-hand corner of the WebStorm window, and then click
:
In the Debug tool window, proceed as usual: step through the program, stop and resume program execution, examine it when suspended, explore the call stack and variables, set watches, evaluate variables, view actual HTML DOM, and so on.
Mappings
Mappings set correspondence between files on a web server and their local copies. You need mappings:
When your application is deployed and running on a remote web server.
When you have defined several resource root folders in addition to the project root.
WebStorm attempts to guess path mappings from the deployment configuration or based on file and script names and content. However, if your application structure is complicated, you need to specify path mappings manually.
Configure mappings
Create a debug configuration of the type JavaScript Debug as described in Debugging an application.
In the Remote URLs of local files area, map the files and folders to URL addresses of files and folders on the server according to the currently used deployment configuration, see Mapping local folders to folders on the server and the URL addresses to access them.
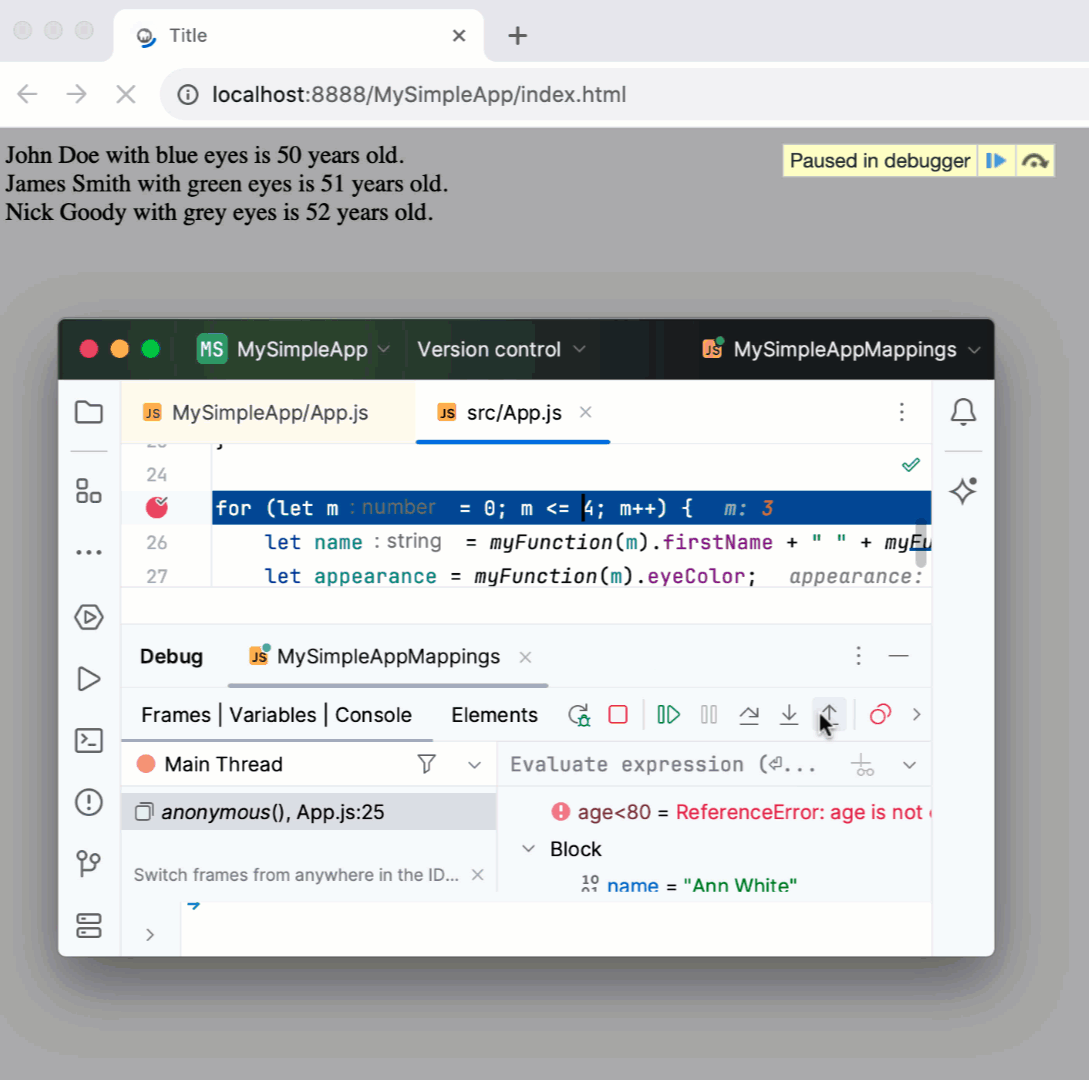
Example: Debug with mappings
Suppose that for some reason you decide to change the folder structure of the application from the previous example and move index.html and App.js to a separate folder src.

Because the local sources and the application on the web server are structured differently, the debugger will be unable to sync the local sources with the code that is actually executed.
To solve the problem, let's map the URL address of the application root with the src folder.
Start creating a run/debug configuration as described above.
In the Run/Debug Configurations dialog, click
in the Remote URLs of local files area.In the dialog that opens, select the src folder under MySimpleApp.
In the Remote URL field, type the URL address of the application, in our example it is
http://localhost:8888/MySimpleApp
Save the run/debug configuration and launch it as described above.
For more debugging examples, refer to the following posts in the WebStorm blog: Debugging React Applications and Debugging Angular Applications.
Debug in Code with Me session
You can also start debugging during a Code with Me session. No matter whether you act as a host or a client, the browser opens on the side that started a debugging session.
Debug asynchronous code
WebStorm supports debugging asynchronous client-side JavaScript code. WebStorm recognizes breakpoints inside asynchronous code, stops at them, and lets you step into such code. As soon as a breakpoint inside an asynchronous function is hit or you step into asynchronous code, a new element Async call from <caller> is added in the Frames pane of the Debugger tab. WebStorm displays a full call stack, including the caller and the entire way to the beginning of the asynchronous actions.
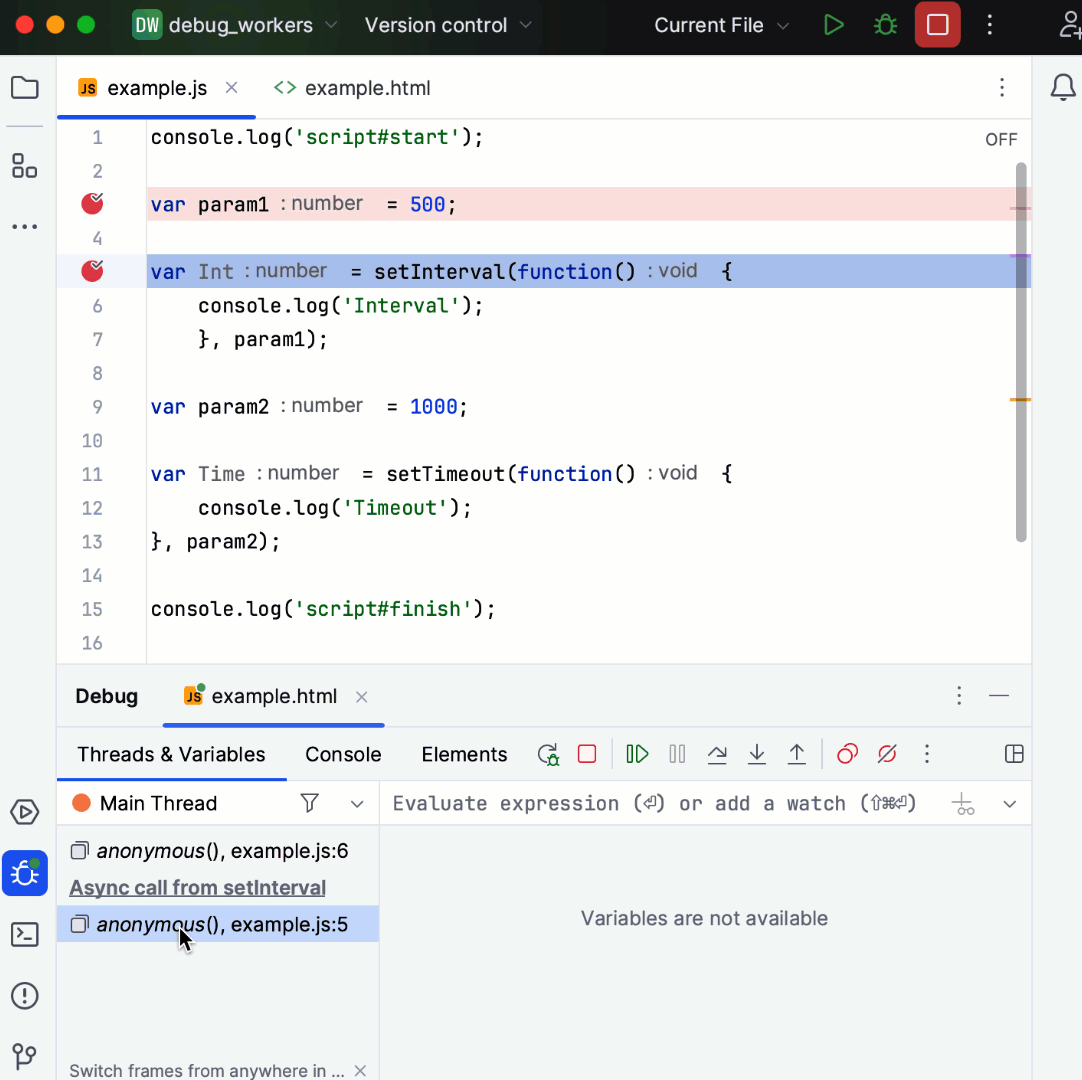
In the example above, the debugger stops at line3(breakpoint), then at line5(breakpoint). On clicking Step into, the debugger will stop at line5 (on function), then will move to line6.
The asynchronous debugging mode is turned on by default. To disable asynchronous stack traces, set js.debugger.async.call.stack.depth in Registry to 0.
Debug workers
WebStorm supports debugging Service Workers and Web Workers. WebStorm recognizes breakpoints in each worker and shows the debug data for it as a separate thread in the Frames pane on the Debugger tab of the Debug tool window.
Note that WebStorm can debug only dedicated workers, debugging for shared workers is currently not supported.
Set the breakpoints in the Workers to debug.
If you are using Service Workers, make sure the Allow unsigned requests checkbox is selected on the Debugger page (). Otherwise your service workers may be unavailable during a debug session.
Create a debug configuration of the type JavaScript Debug as described above in Debugging client-side JavaScript running on an external web server.
From the Run widget list on the toolbar, select the newly created configuration and click
next to it. The HTML file specified in the run configuration opens in the browser and the Debug tool window opens with the Frames list showing all the available Workers:

To examine the data (variables, watches, and so on) for a Worker, select its thread in the list and view its data in the Variables and Watches panes. When you select another Worker, the contents of the panes are updated accordingly.
Debug Chrome extensions
You can debug Chrome extensions in WebStorm using a run/debug configuration of the type Attach to Node.js/Chrome. Note that you have to start Chrome with your custom Chrome user data profile, learn more from Start a debugging session with your preferred Chrome user data.
Create an Attach to Node.js/Chrome run/debug configuration
Go to . Alternatively, select Edit Configurations from the Run widget on the toolbar.

In the Edit Configurations dialog that opens, click the Add button (
) on the toolbar and select Attach to Node.js/Chrome from the list. 
The Run/Debug Configuration: Attach to Node.js/Chrome dialog opens.
Specify the configuration name and accept the predefined host and port values
localhost:9229.
Click Apply and OK to save the configuration and leave the dialog.
Run Chrome and load the extension
Run Chrome from the command line to specify the remote debugging port and your Chrome user data directory.
Open the embedded Terminal (Alt+F12) and type:
<path_to_chrome_executable> --remote-debugging-port=<port_specified_in_run_configuration> --user-data-dir=<your_Chrome_user_data_directory>Load your unpacked extension to the Chrome window that opens.
Start debugging
Set the breakpoints where necessary.
From the Run widget list on the toolbar, select the newly created Attach to Node.js/Chrome configuration and click
next to it. 
The Debug tool window opens.
Go to the Chrome tab where your extension is loaded.
Switch to WebStorm. In the Debug tool window, step through the breakpoints, switch between frames, change values on-the-fly, examine a suspended program, evaluate expressions, and set watches.