What's New in DataGrip 2026.1
Support for AI agents, a new flow for creating query files, data source templates, and more!
Welcome to the first DataGrip What's New of 2026. The new version brings practical improvements to make database workflows more efficient. Updates include AI agent integration, improvements to query files and consoles, and an easier way to reuse data source settings across your JetBrains IDEs.
- AI:
- Query files and consoles:
- Connectivity and data sources:
- Other improvements:
AI improvements: Agentic flow
JetBrains AI is evolving to give you more choice, transparency, and flexibility in how you use AI inside DataGrip.
This release brings smarter SQL file creation from the AI chat, the integration of Claude Agent and Codex into the chat interface, and database-specific tools in the MCP server for agentic workflows.
Integration of AI agent into the AI chat
Claude Agent and Codex are now natively integrated in the AI chat interface. This makes it easier to get the right kind of assistance for every task.
Currently, Codex integration requires configuring the MCP server manually. For further instructions, refer to the corresponding documentation page for Codex.
Find more information about the integration in JetBrains AI blog posts: Introducing Claude Agent in JetBrains IDEs, Codex Is Now Integrated Into JetBrains IDEs.
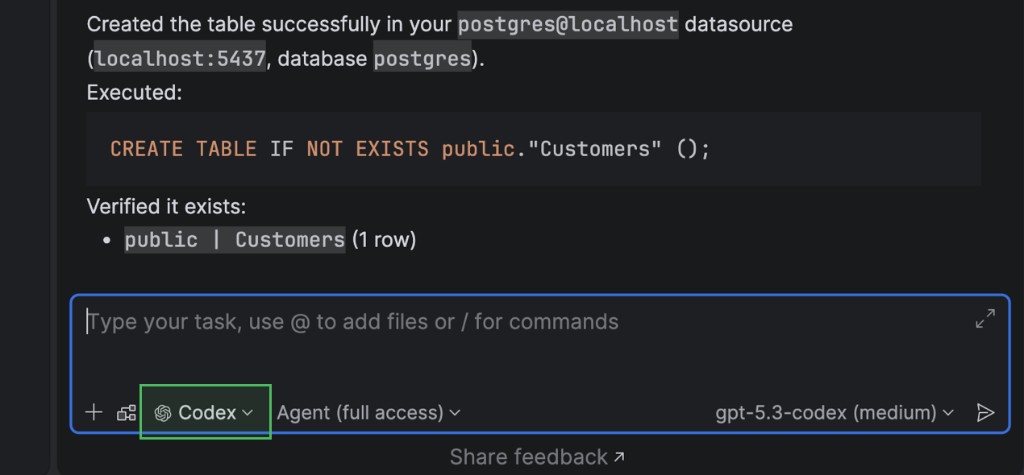
Database-specific capabilities of the MCP server
We have extended the MCP server with database-specific functionalities. With this enhancement, built-in AI agents and third-party tools can work with databases in a more structured way.
The new capabilities include:
- Obtain connection configurations and test them.
- List database schemas.
- Retrieve supported schema object types (such as tables and views) and browse schema objects.
- View recent and currently running SQL queries.
- Execute and cancel running SQL queries.
- Preview table data and get result sets in CSV format.
For security, four types of user consent are required by default:
- Schema access requests.
- Data access requests.
- Schema modification requests.
- Data modification requests.
The IDE will ask for your consent when permission is required.
You can change your consent preferences in the IDE settings under Tools | AI Assistant.
File creation with the SQL dialect and data source attached
When chatting with AI Assistant in the AI Chat tool window, you can create a file from a code snippet.
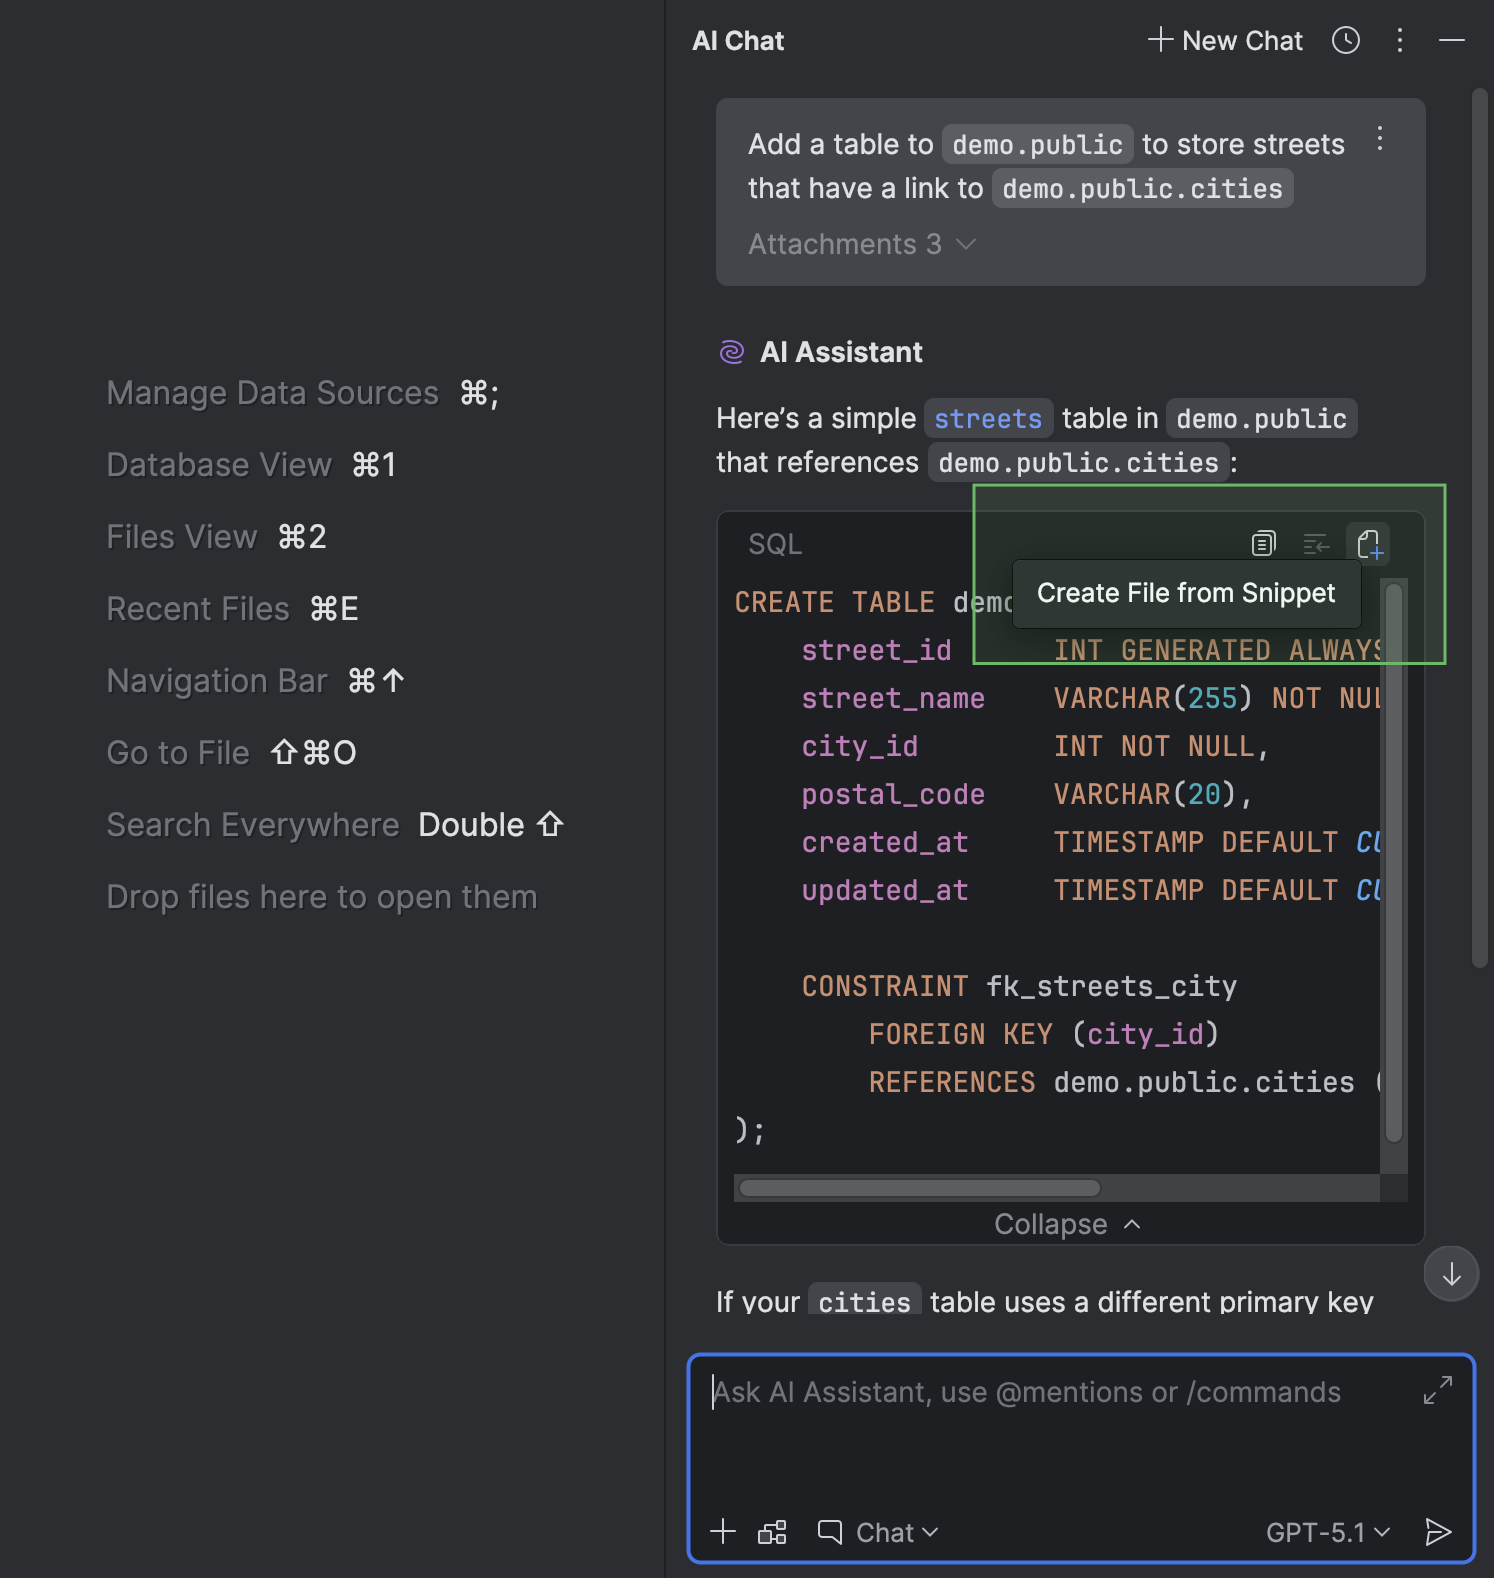
If any context relating to the SQL dialect, a data source, or a schema is provided in the chat, you don't have to attach the data source or schema or set the dialect because DataGrip will do this automatically. The same goes for questions you ask AI Assistant about a file that already has a data source attached: DataGrip will attach that data source to the newly created file.
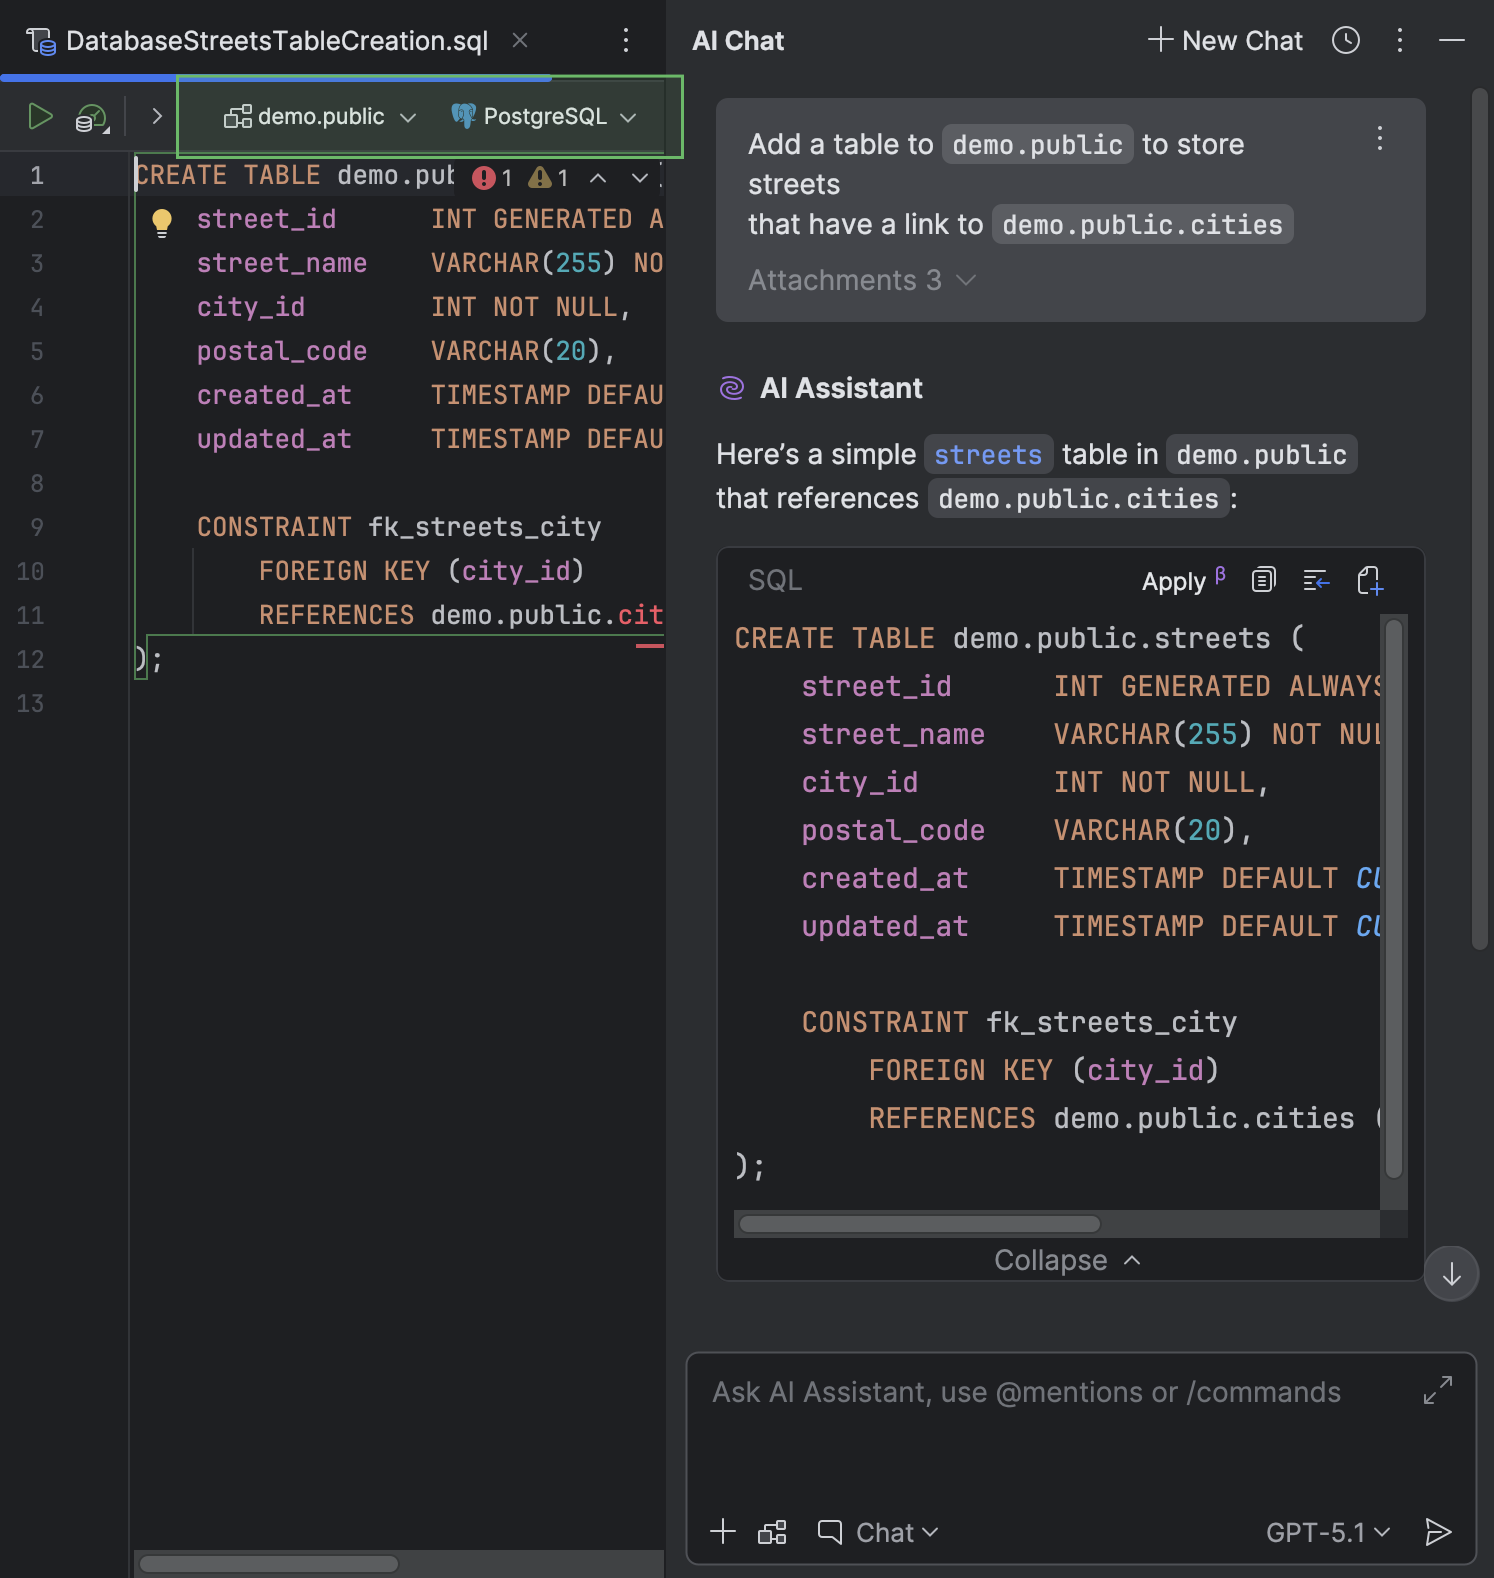
DataGrip will store the created file in the current project directory.
Query files and consoles
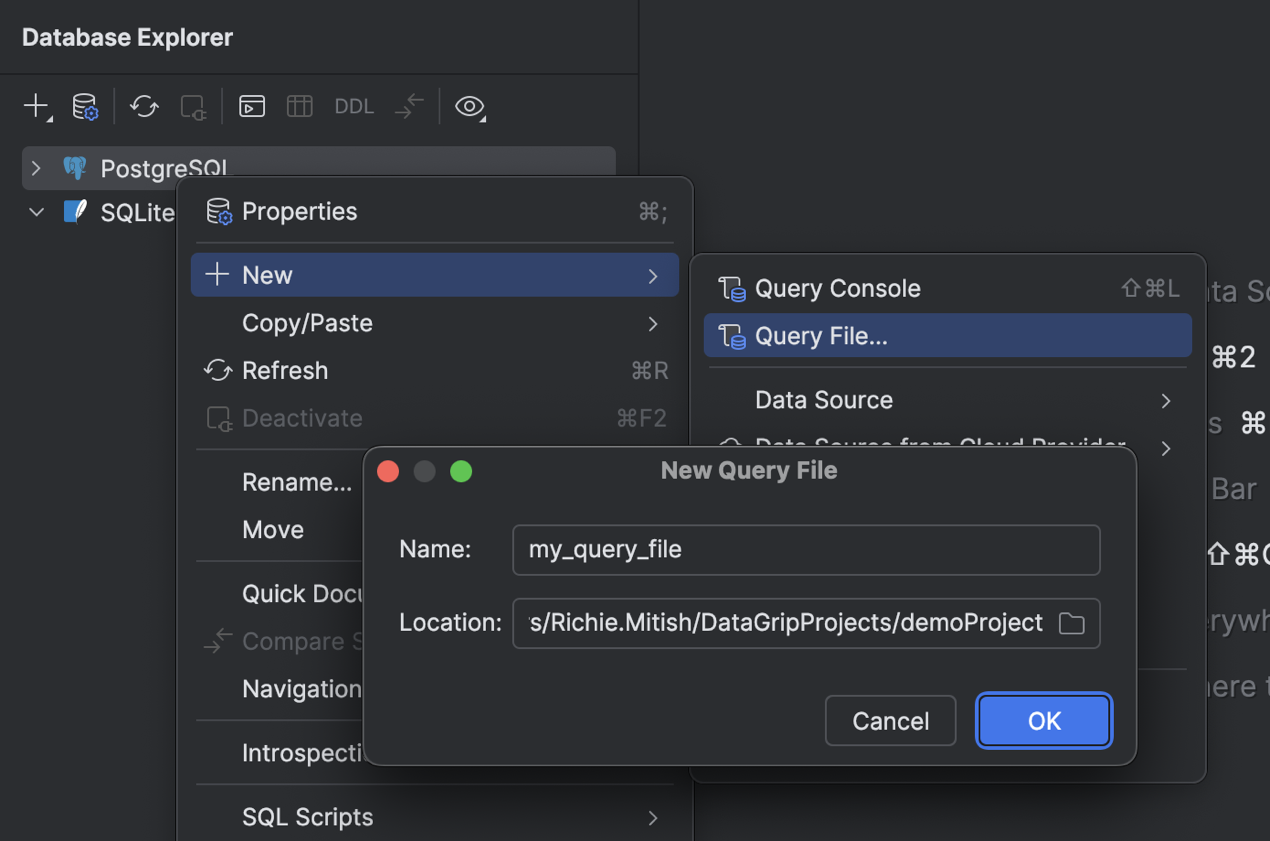
New flow for creating a query file
We have redesigned the flow for working with query files side by side with query consoles. You can now use either just files or just consoles, or both at the same time, depending on your tasks and workflow.
To create a new query file, right-click a data source and select New | Query File or press Shift+Cmd+J (macOS) or Ctrl+Alt+Shift+Q (Windows/Linux). Then, in the New Query File dialog, specify the file's name and the directory where you want to store it. To store it within the current project and associate the file with it, specify the current project directory or one of its subdirectories.
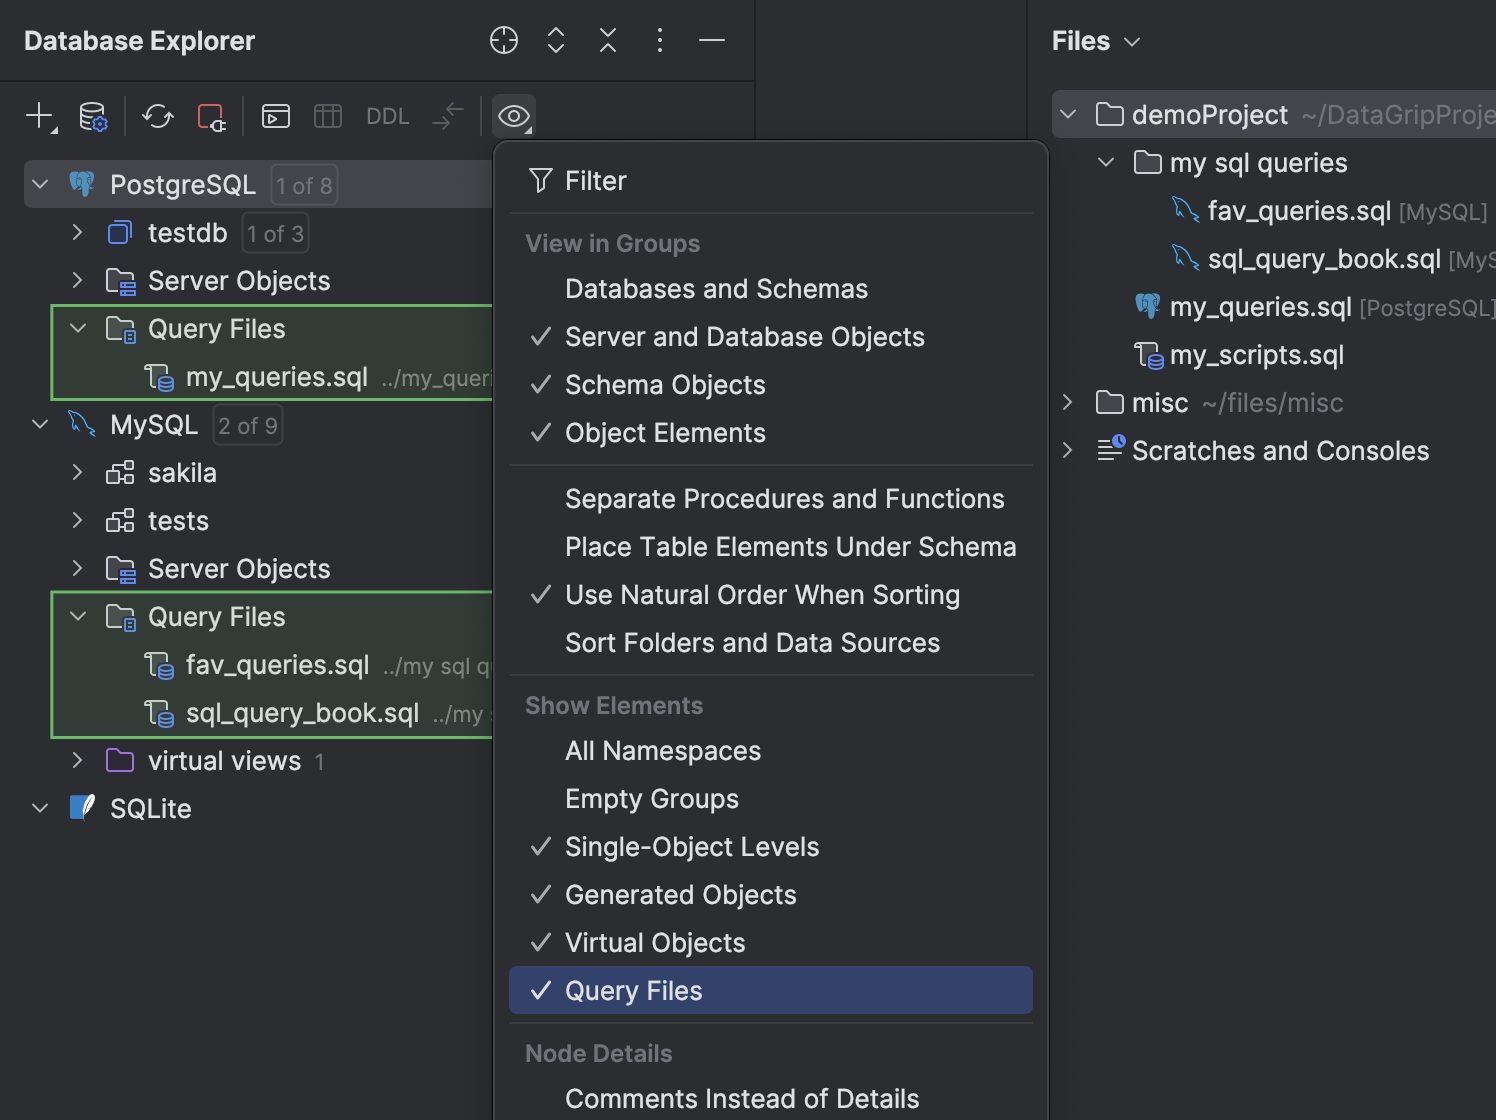
Query Files folder in the database explorer
You can now access your query files in the database explorer. We have added a Query Files folder, which appears under each data source node. To toggle this folder's visibility, click View Options on the tool window toolbar, and then select or deselect the Query Files option.
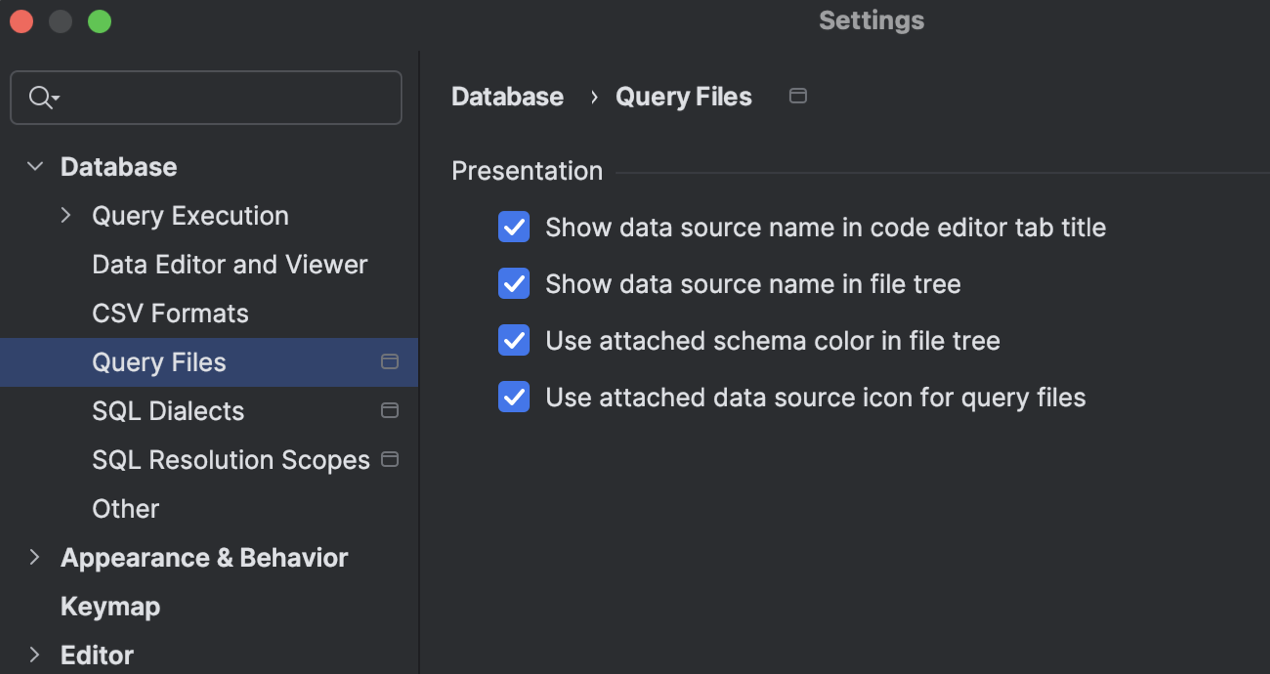
New options for tailoring how files are displayed
Different tasks require different information to be visible. We've added some settings to ensure that the presentation of query files gives you the right info for your specific use case. You can use these settings to toggle whether data source names are displayed, apply schema colors, and use the icon of the attached data source with your query files.
Connectivity
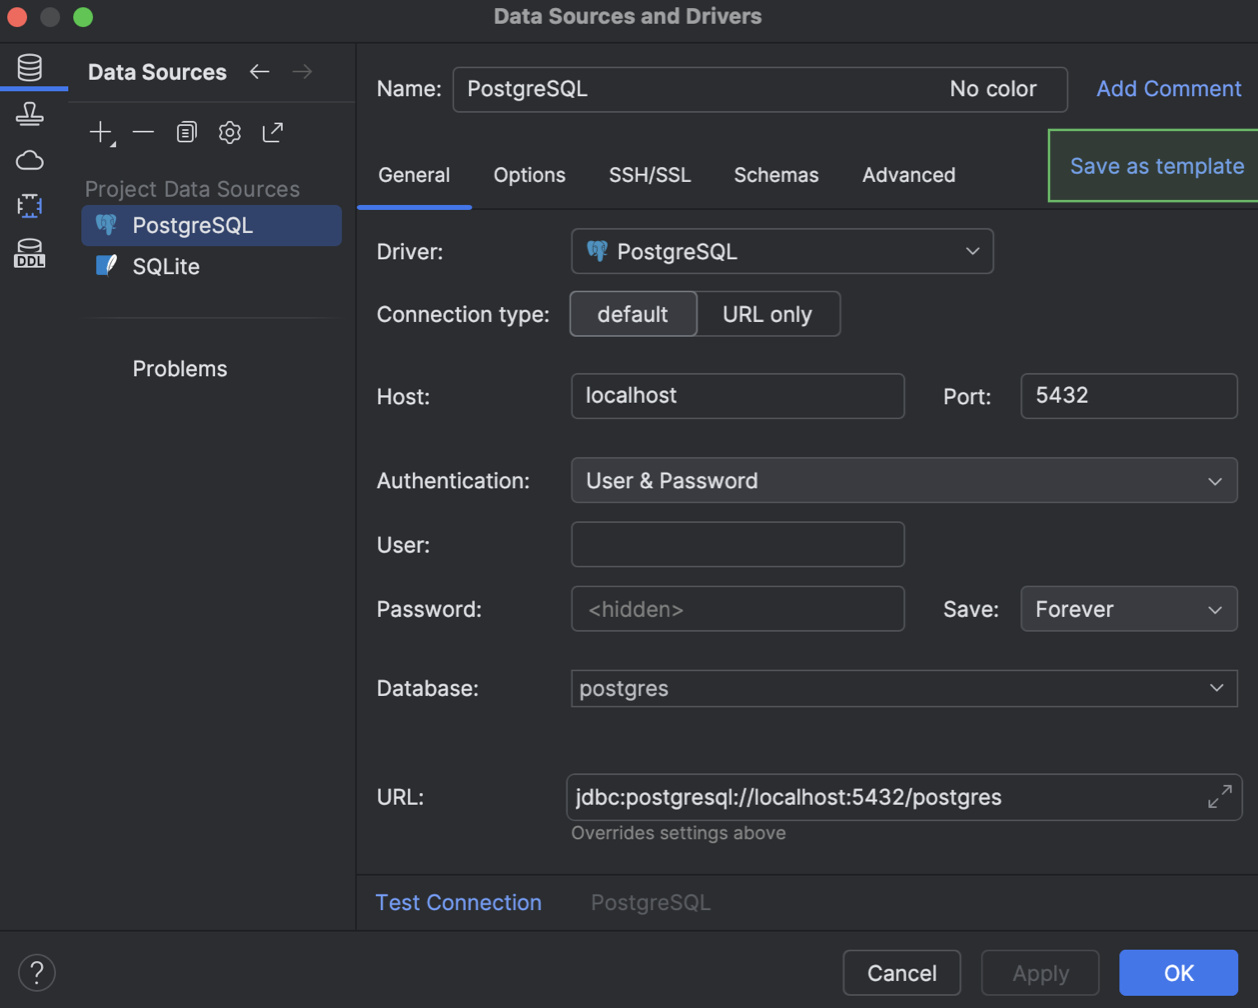
Data source templates
We have implemented a way to store data source settings as a template in your JetBrains Account. When stored this way, the template is available in every JetBrains IDE with database functionality provided through your JetBrains Account. These templates store settings from the General and Advanced tabs of the Data Source and Drivers dialog, but exclude your database credentials.
You can create a template in the Data Source and Drivers dialog. On the Data Sources tab, select the data source you want to create a template from and click Save as template.
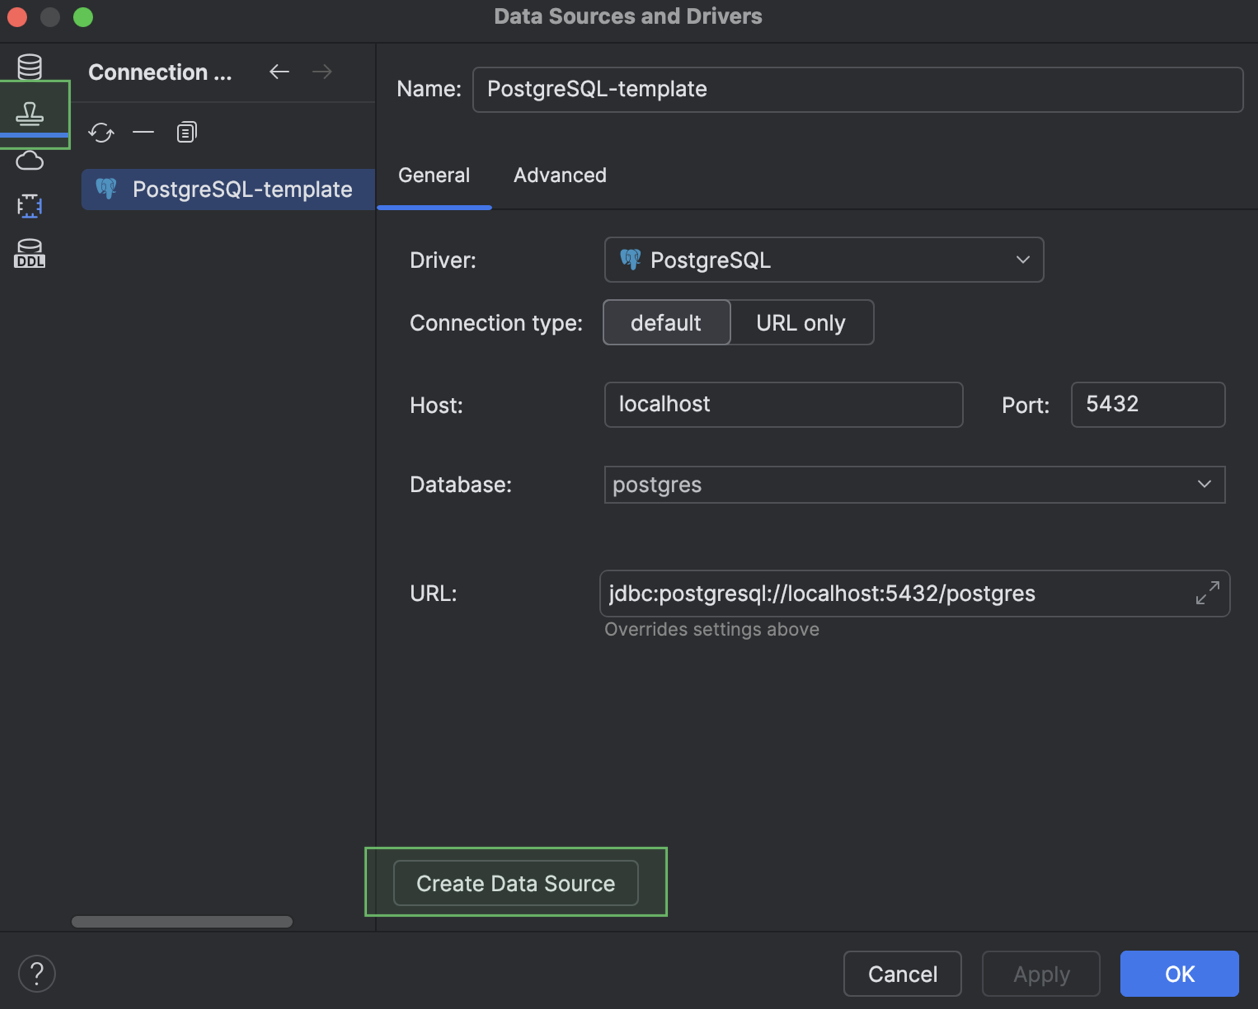
The new template will appear on the Data Source Templates tab. You can create a new data source that uses the template at any time with the Create Data Source button.
PostgreSQL 18 support PostgreSQL
DataGrip now supports PostgreSQL 18, which was released last year. Full support includes the following keywords and commands, among others:
OLDandNEWresolution inRETURNINGclauses.WITHOUT OVERLAPSin primary and unique constraints.PERIODin foreign key constraints.GENERATED ALWAYS AS (...) [STORED | VIRTUAL]for columns.NOT ENFORCEDandNOT VALIDconstraints.
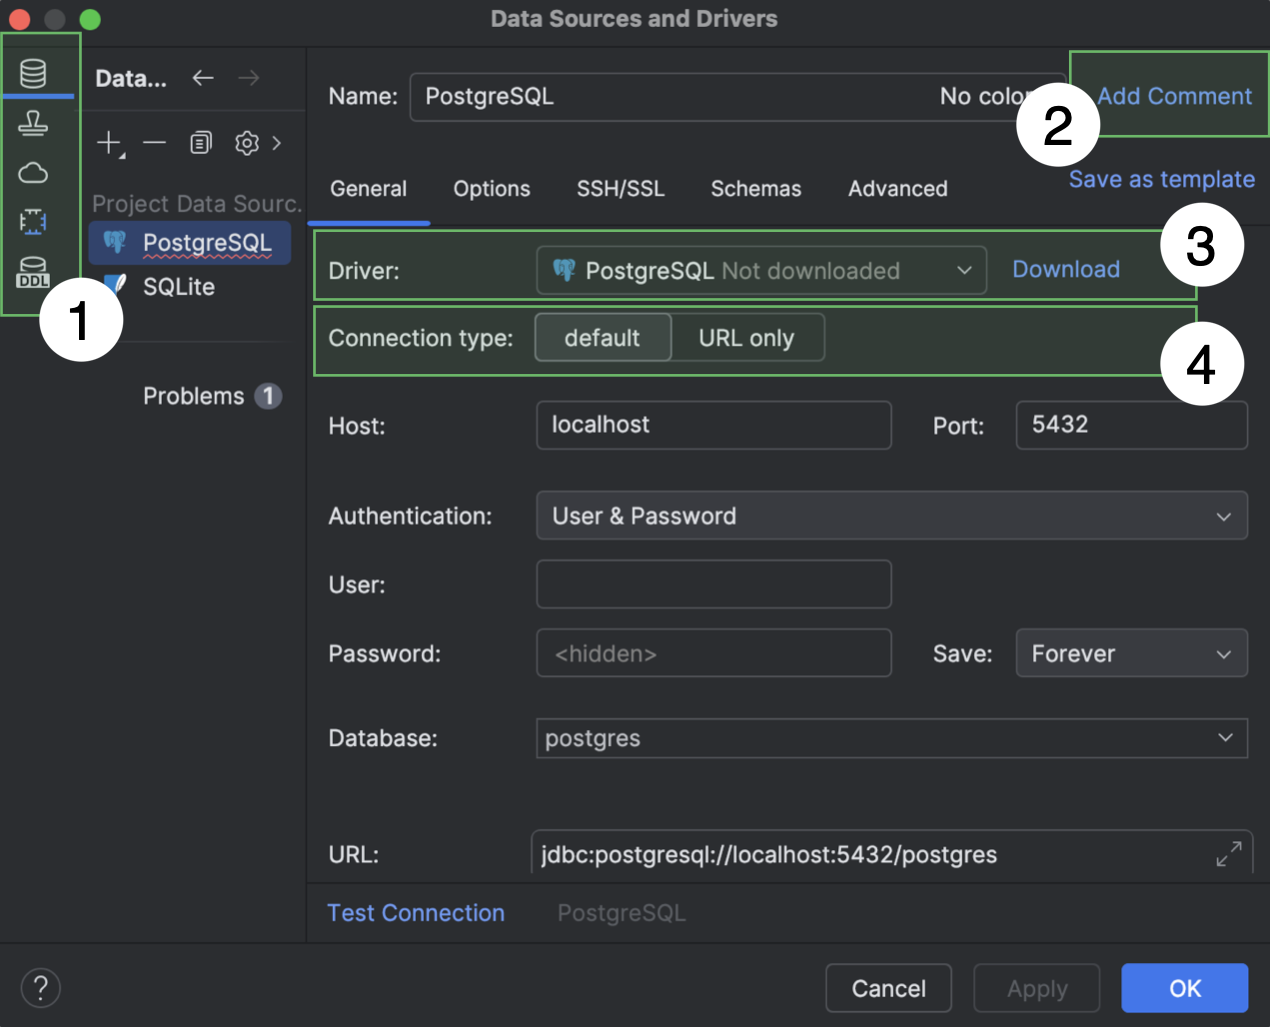
Data Sources and Drivers dialog improvements
We have made a few changes to the Data Sources and Drivers dialog.
- The Data Sources, Clouds, Drivers, and DDL Mappings sections are now the main tabs in the dialog, located on the left-hand side.
- If the Comment field is empty, it is hidden by default. To display it, click Add Comment next to the Name field.
- If the driver selected in the Driver dropdown menu has yet to be downloaded, a Download option appears next to the menu. Click this to download the driver.
- The Connection type dropdown options are now tabs. If a data source has more than three connection types, they are displayed as a dropdown.
In addition, the Create DDL Mapping action has been removed. You can create a DDL mapping on the DDL Mappings main tab.
Explain Plan workflow

UI and UX improvements
We have made a few updates to the Explain Plan workflow to make it more discoverable, informative, and easy to use:
- The list of options in the Explain Plan dropdown on the code editor toolbar has been shortened to just two: Explain Plan and Explain Analyse.
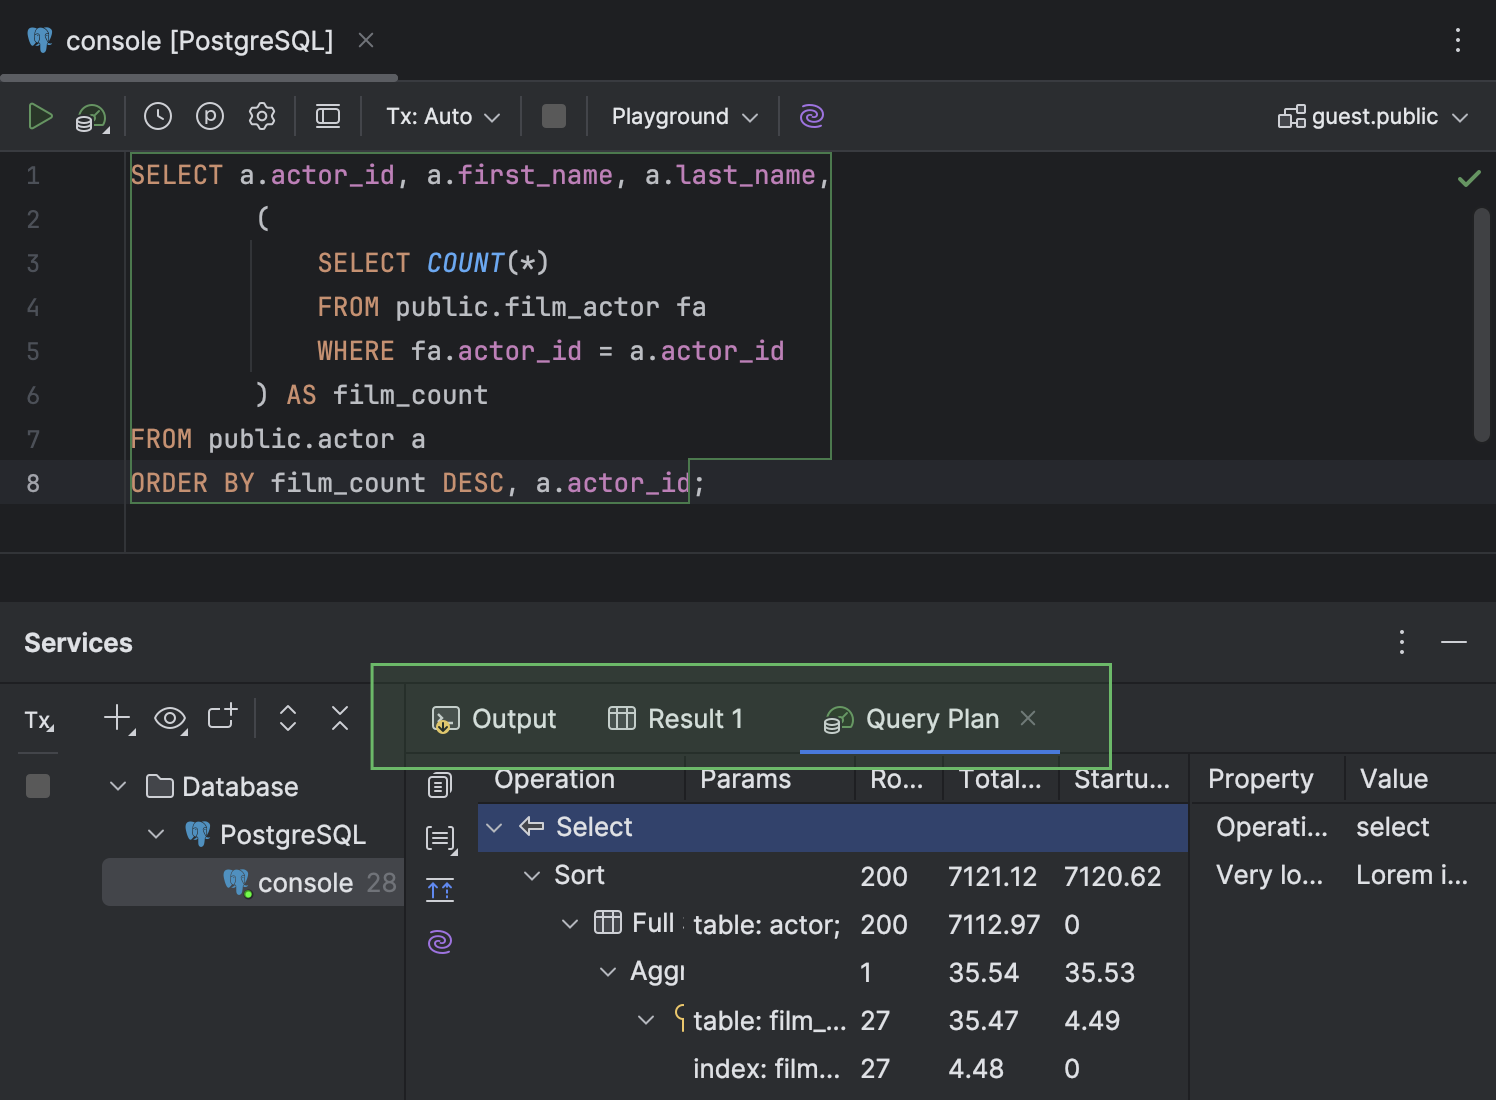
- In the Services tool window, the Query Plan tab that displays the plan has been moved to the same level as the Output and Result tabs. It also has a new icon.
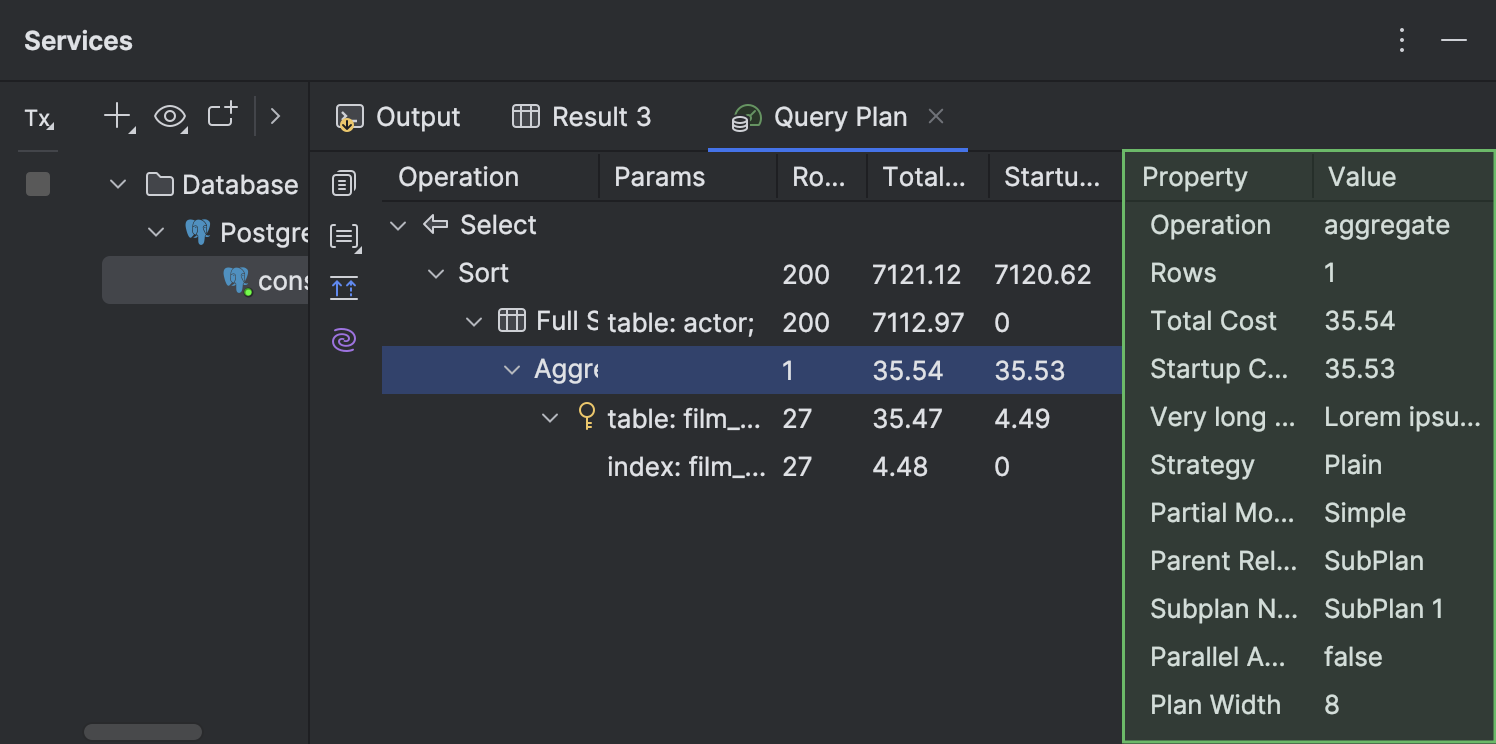
- In the Query Plan tab, you can now view the details of each plan row in a separate panel on the right-hand side of the tab.
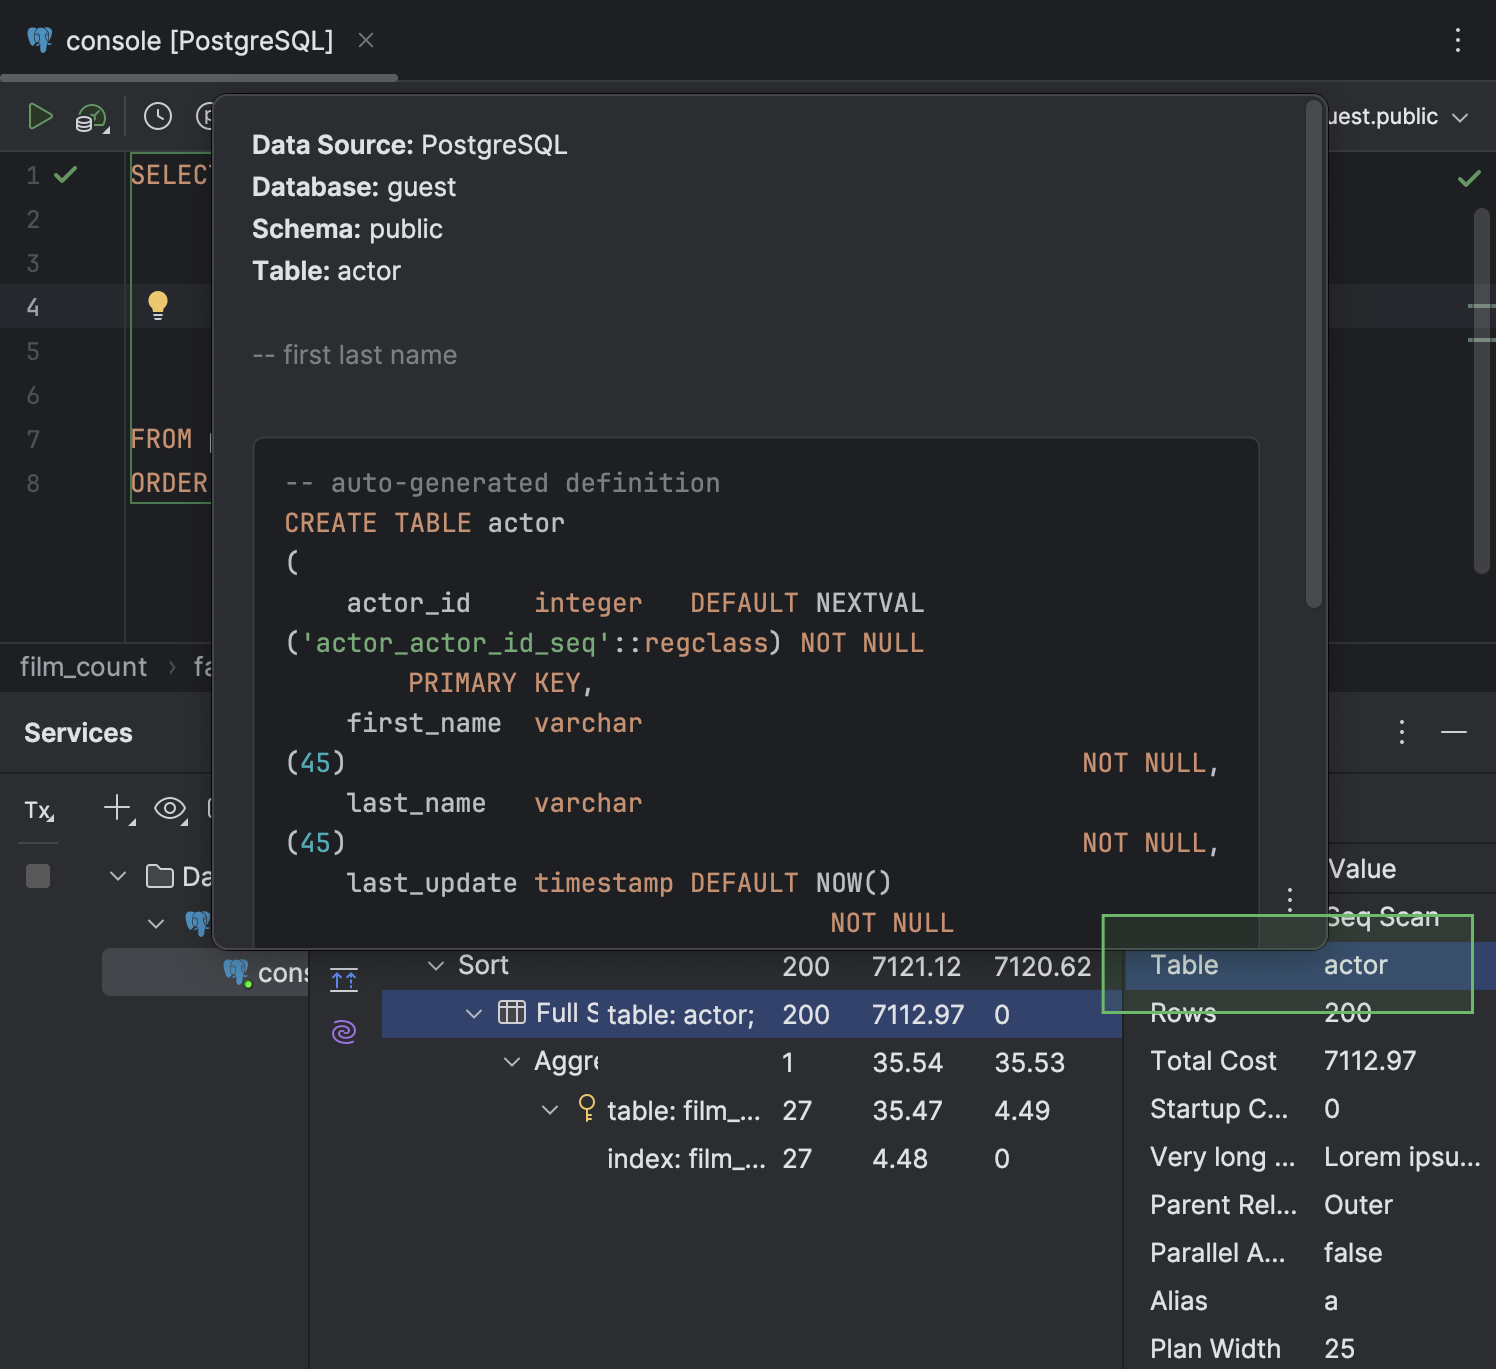
- For the cells that contain a table name, quick documentation is available in a popup when you hover the cursor over the table.
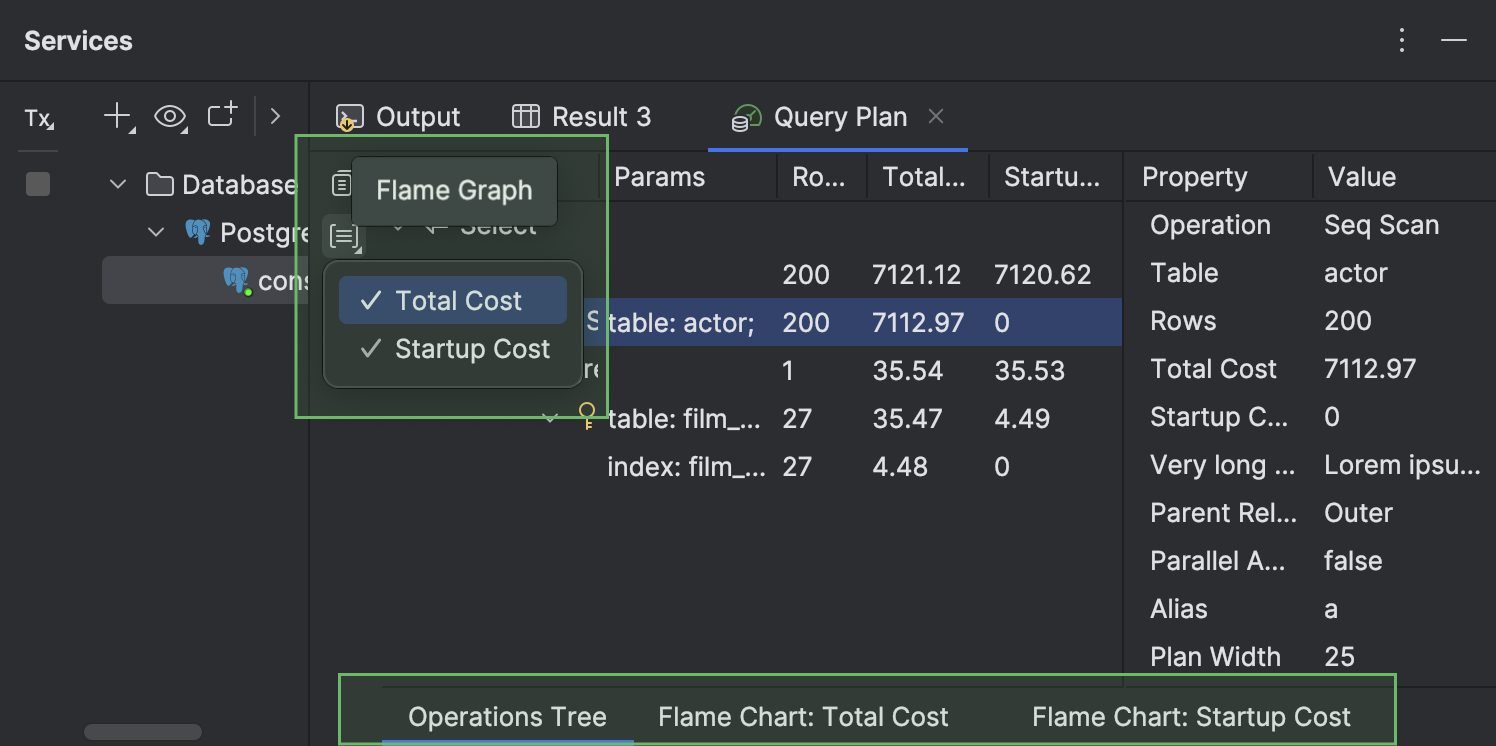
- The different views available for a query plan are displayed in separate sub-tabs. These inner tabs can be seen at the bottom of the Query Plan tab. They are hidden by default and appear only when more than one tab is open. To open the Total Cost or Startup Cost tab, click Flame Graph on the left-hand toolbar and select the view you need.

Option to copy a query plan in its native format
You can now copy a query plan in the database's native format, for example, JSON or XML. To do this, click the Copy Original Query Plan button at the top of the left toolbar. This is supported for PostgreSQL, Amazon Redshift, MySQL, MariaDB, Oracle, Microsoft SQL Server, and Snowflake.
Code editor
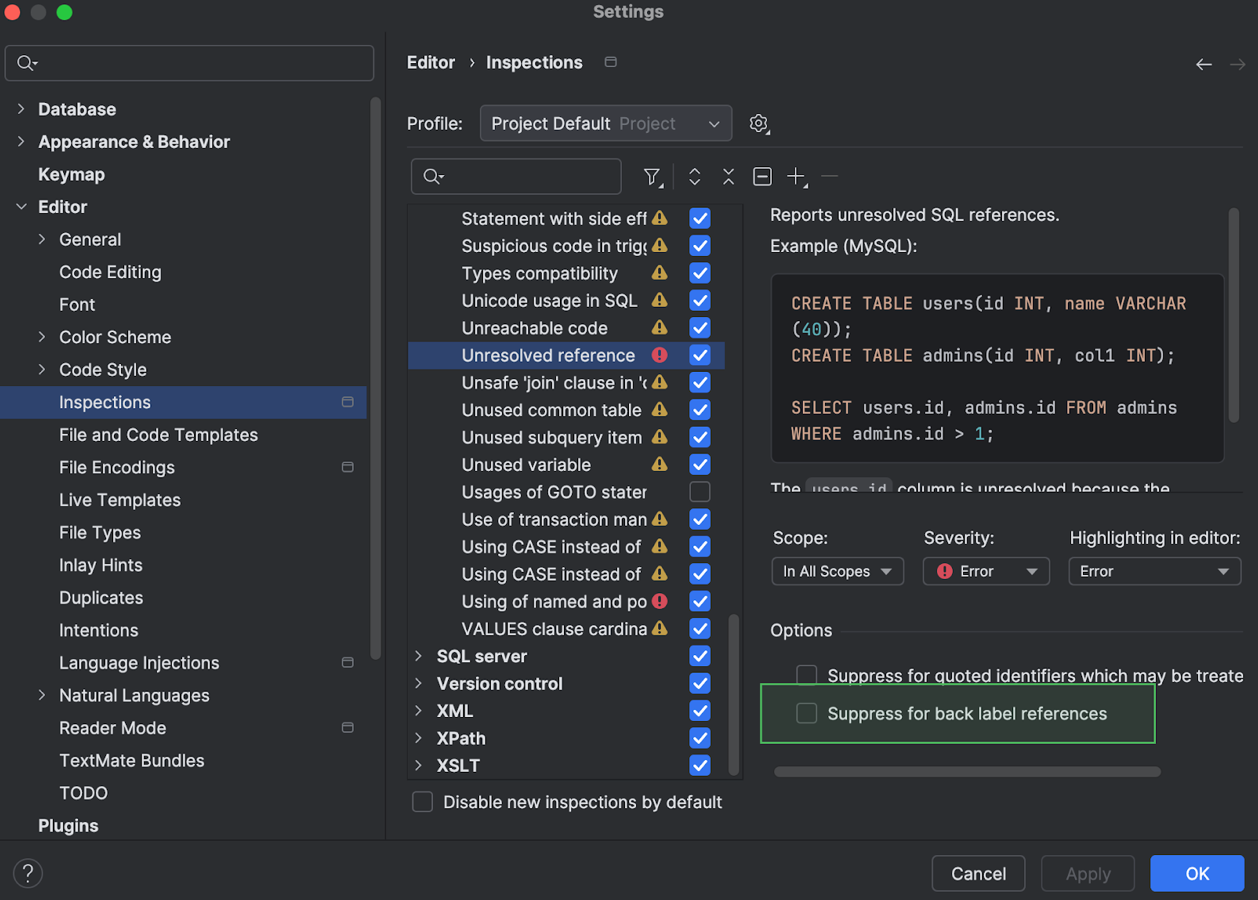
Intention action for suppressing the resolve inspection for back label references Oracle
We have made the Suppress for back label references option easier to find and use. Previously, it was only available in the Settings dialog under Editor | Inspections | SQL.
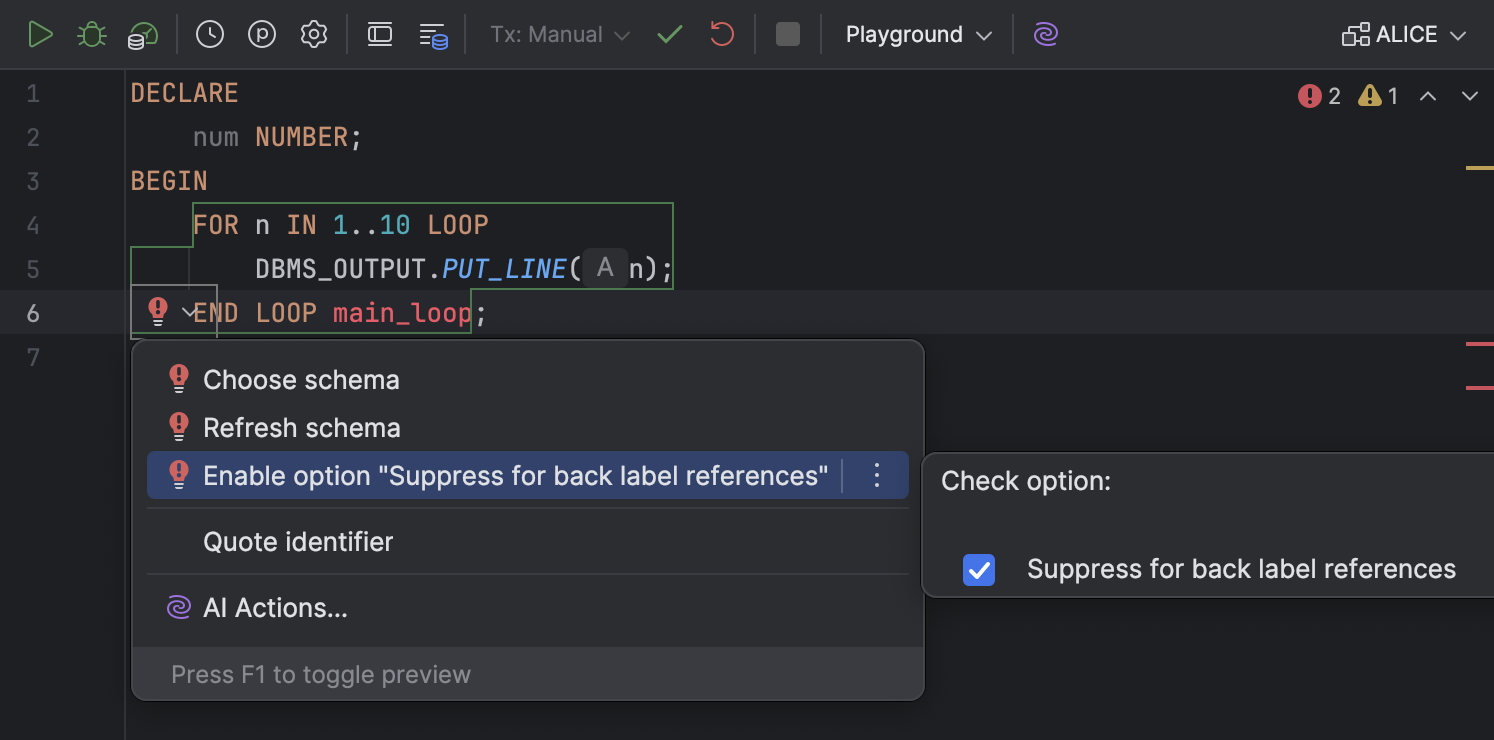
Now, it can be toggled in intention actions. To enable or disable it, open the list of intention actions by pressing Alt+Enter (Windows/Linux) or Option+Enter (macOS), navigate to Enable option "Suppress for back label references", and select or deselect the Suppress for back label references checkbox.
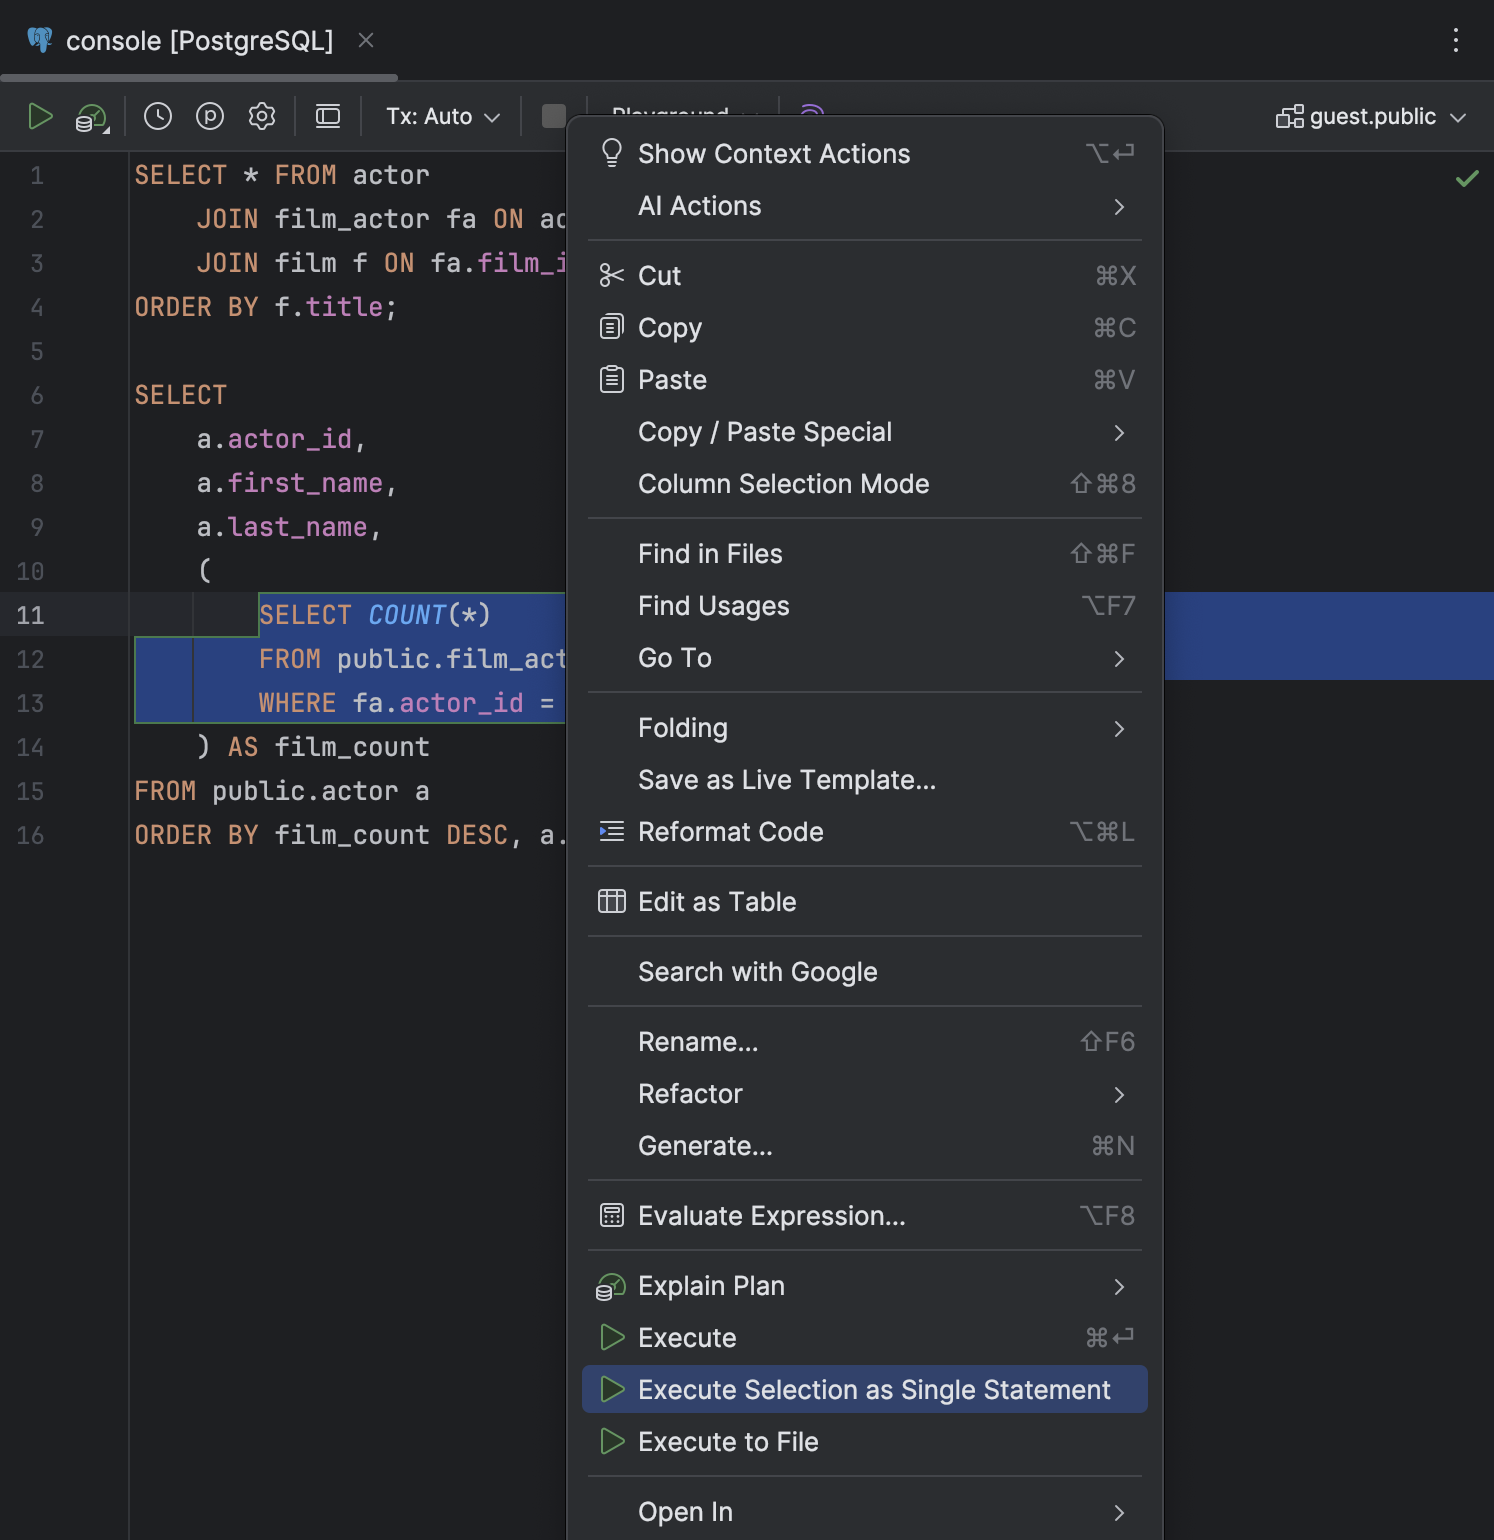
Execute Selection as Single Statement action in the context menu
We have added the Execute Selection as Single Statement action to the context menu of a code selection. Use this when you need to execute a certain chunk of code and DataGrip isn't parsing it properly.
Editor caret movement animation
The code editor caret has received two new options for the movement animation to improve your typing experience.
We realize that animation preferences vary quite a lot. With this in mind, we carefully developed our own mode of caret movement: Snappy. It ensures smooth animation without making the caret feel slow and unresponsive or overloading the interface with excessive action. In this mode, the caret initially jumps quickly to its new position, but then slows down a bit and "settles into" position. The result feels quick yet smooth.
In the other caret animation mode, Gliding, the caret moves smoothly, making jumps easy to follow with your eyes. This mode is similar to the ones you see in other popular text editors.
To try these new animation modes, open the Settings dialog, navigate to Settings | Editor | General | Appearance, enable the Use smooth caret movement option, and select the mode you want to use.
Working with data
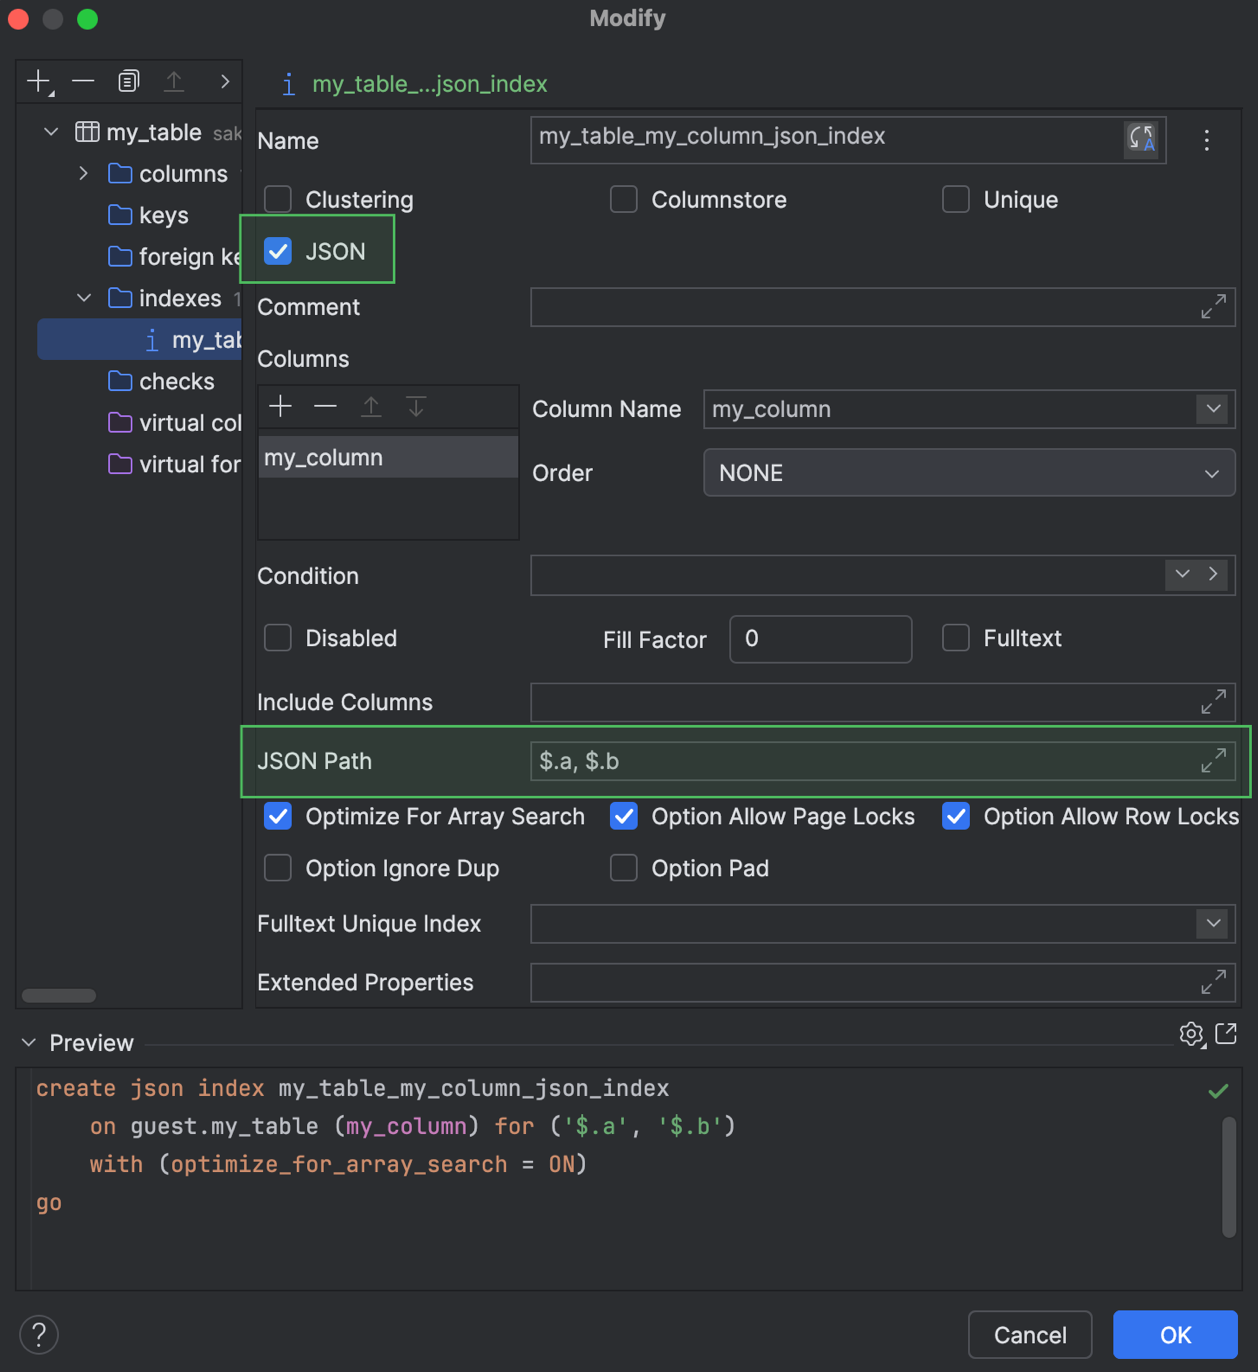
Support for JSON indexes Microsoft SQL Server
DataGrip now supports creating and modifying JSON indexes for Microsoft SQL Server. You can work with them in code generation and also use the indexes in the Create and Modify dialogs.
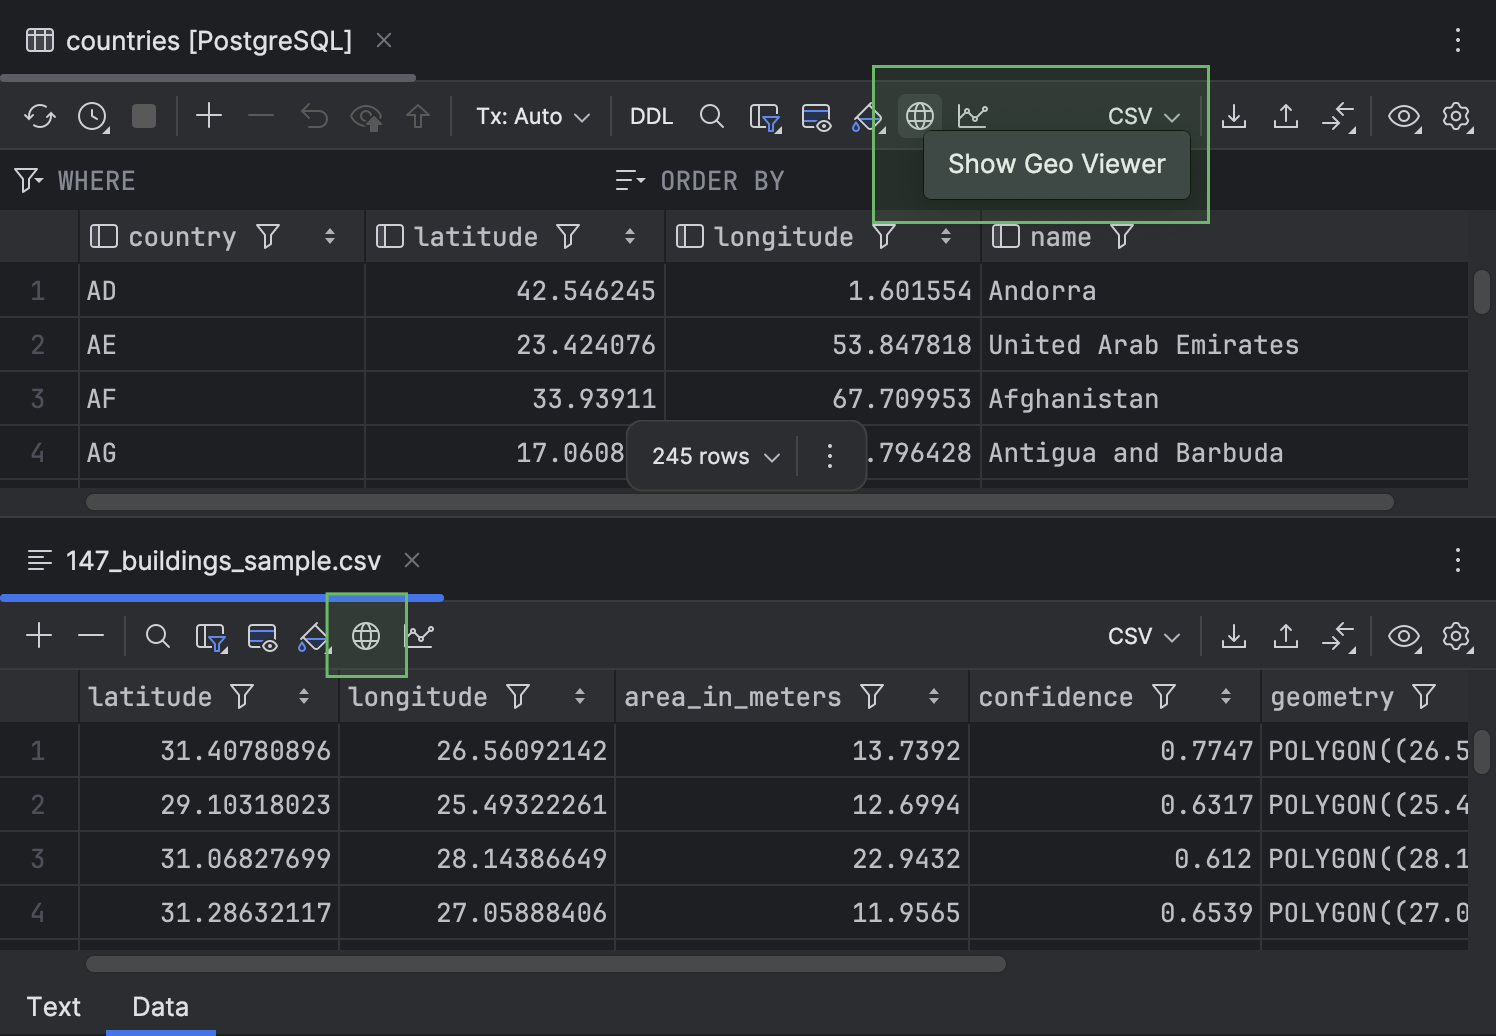
Show Geo Viewer button on the toolbar
For better discoverability, we have moved the Show Geo Viewer button to the data editor toolbar.
Working with files
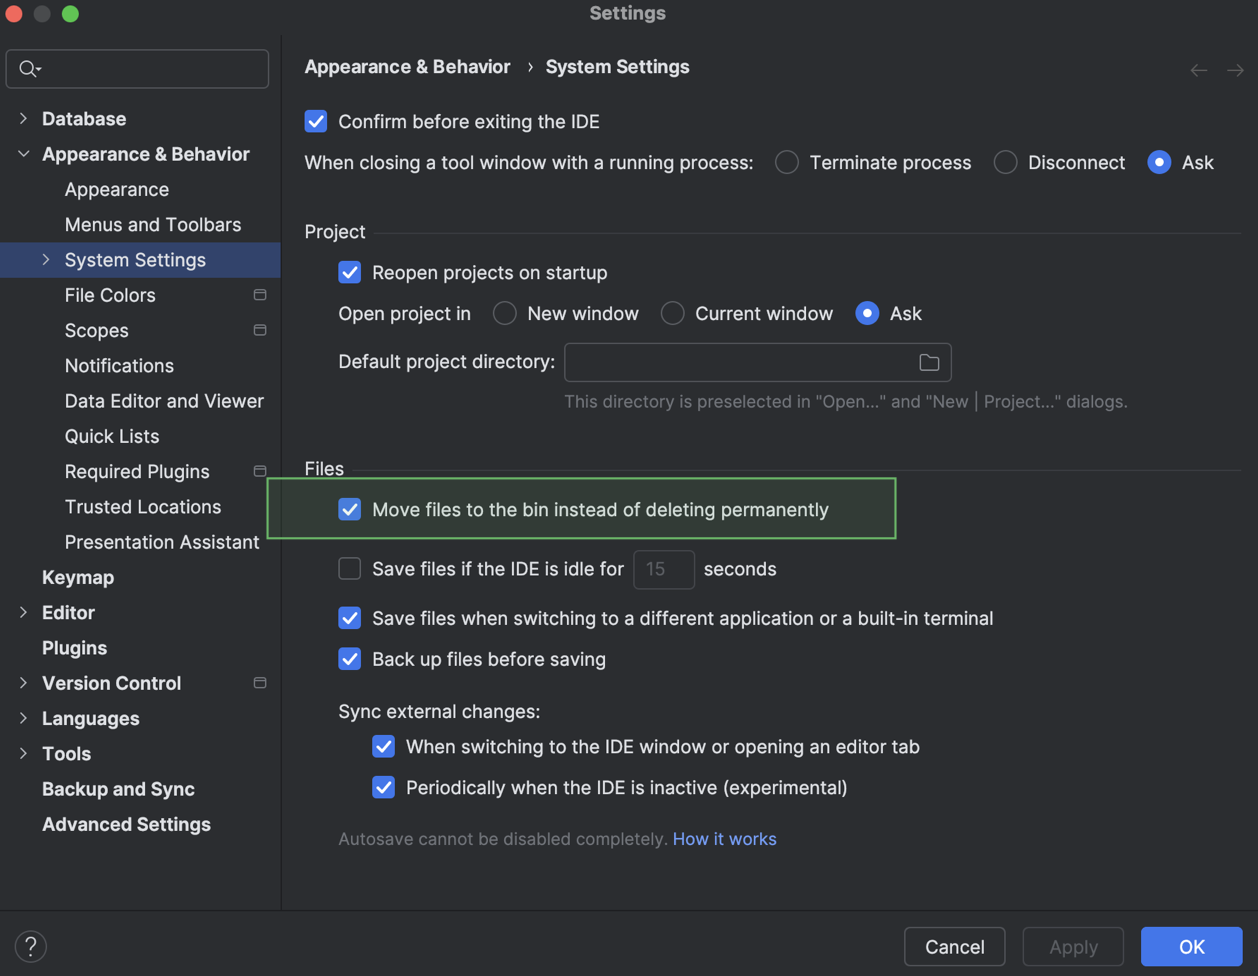
Deleted files go to the bin by default
Previously, when Delete actions were invoked, DataGrip deleted files permanently instead of moving them to the bin. We've added a setting that sends files to the bin instead. It's called Move files to the bin instead of deleting permanently, and it is enabled by default.
You can change this setting in Settings | Appearance & Behavior | System Settings.
We hope you enjoy these updates! If you come across a bug or would like to submit a feature suggestion, please do so via DataGrip's issue tracker.
Want to stay up to date on the latest features and receive tips on how to work with databases more productively? Subscribe to DataGrip's blog and follow us on X!