Reporting
With Datalore you can impress your stakeholders with clean, interactive data apps and ad-hoc reports built from Jupyter notebooks. You can completely hide Python, SQL, Scala, or R code cells and focus on markdown cells, visualizations, and interactive widgets instead. Or you can share the full version of the Jupyter notebook – you decide what content to include!
Watch an overview of Reporting features below:
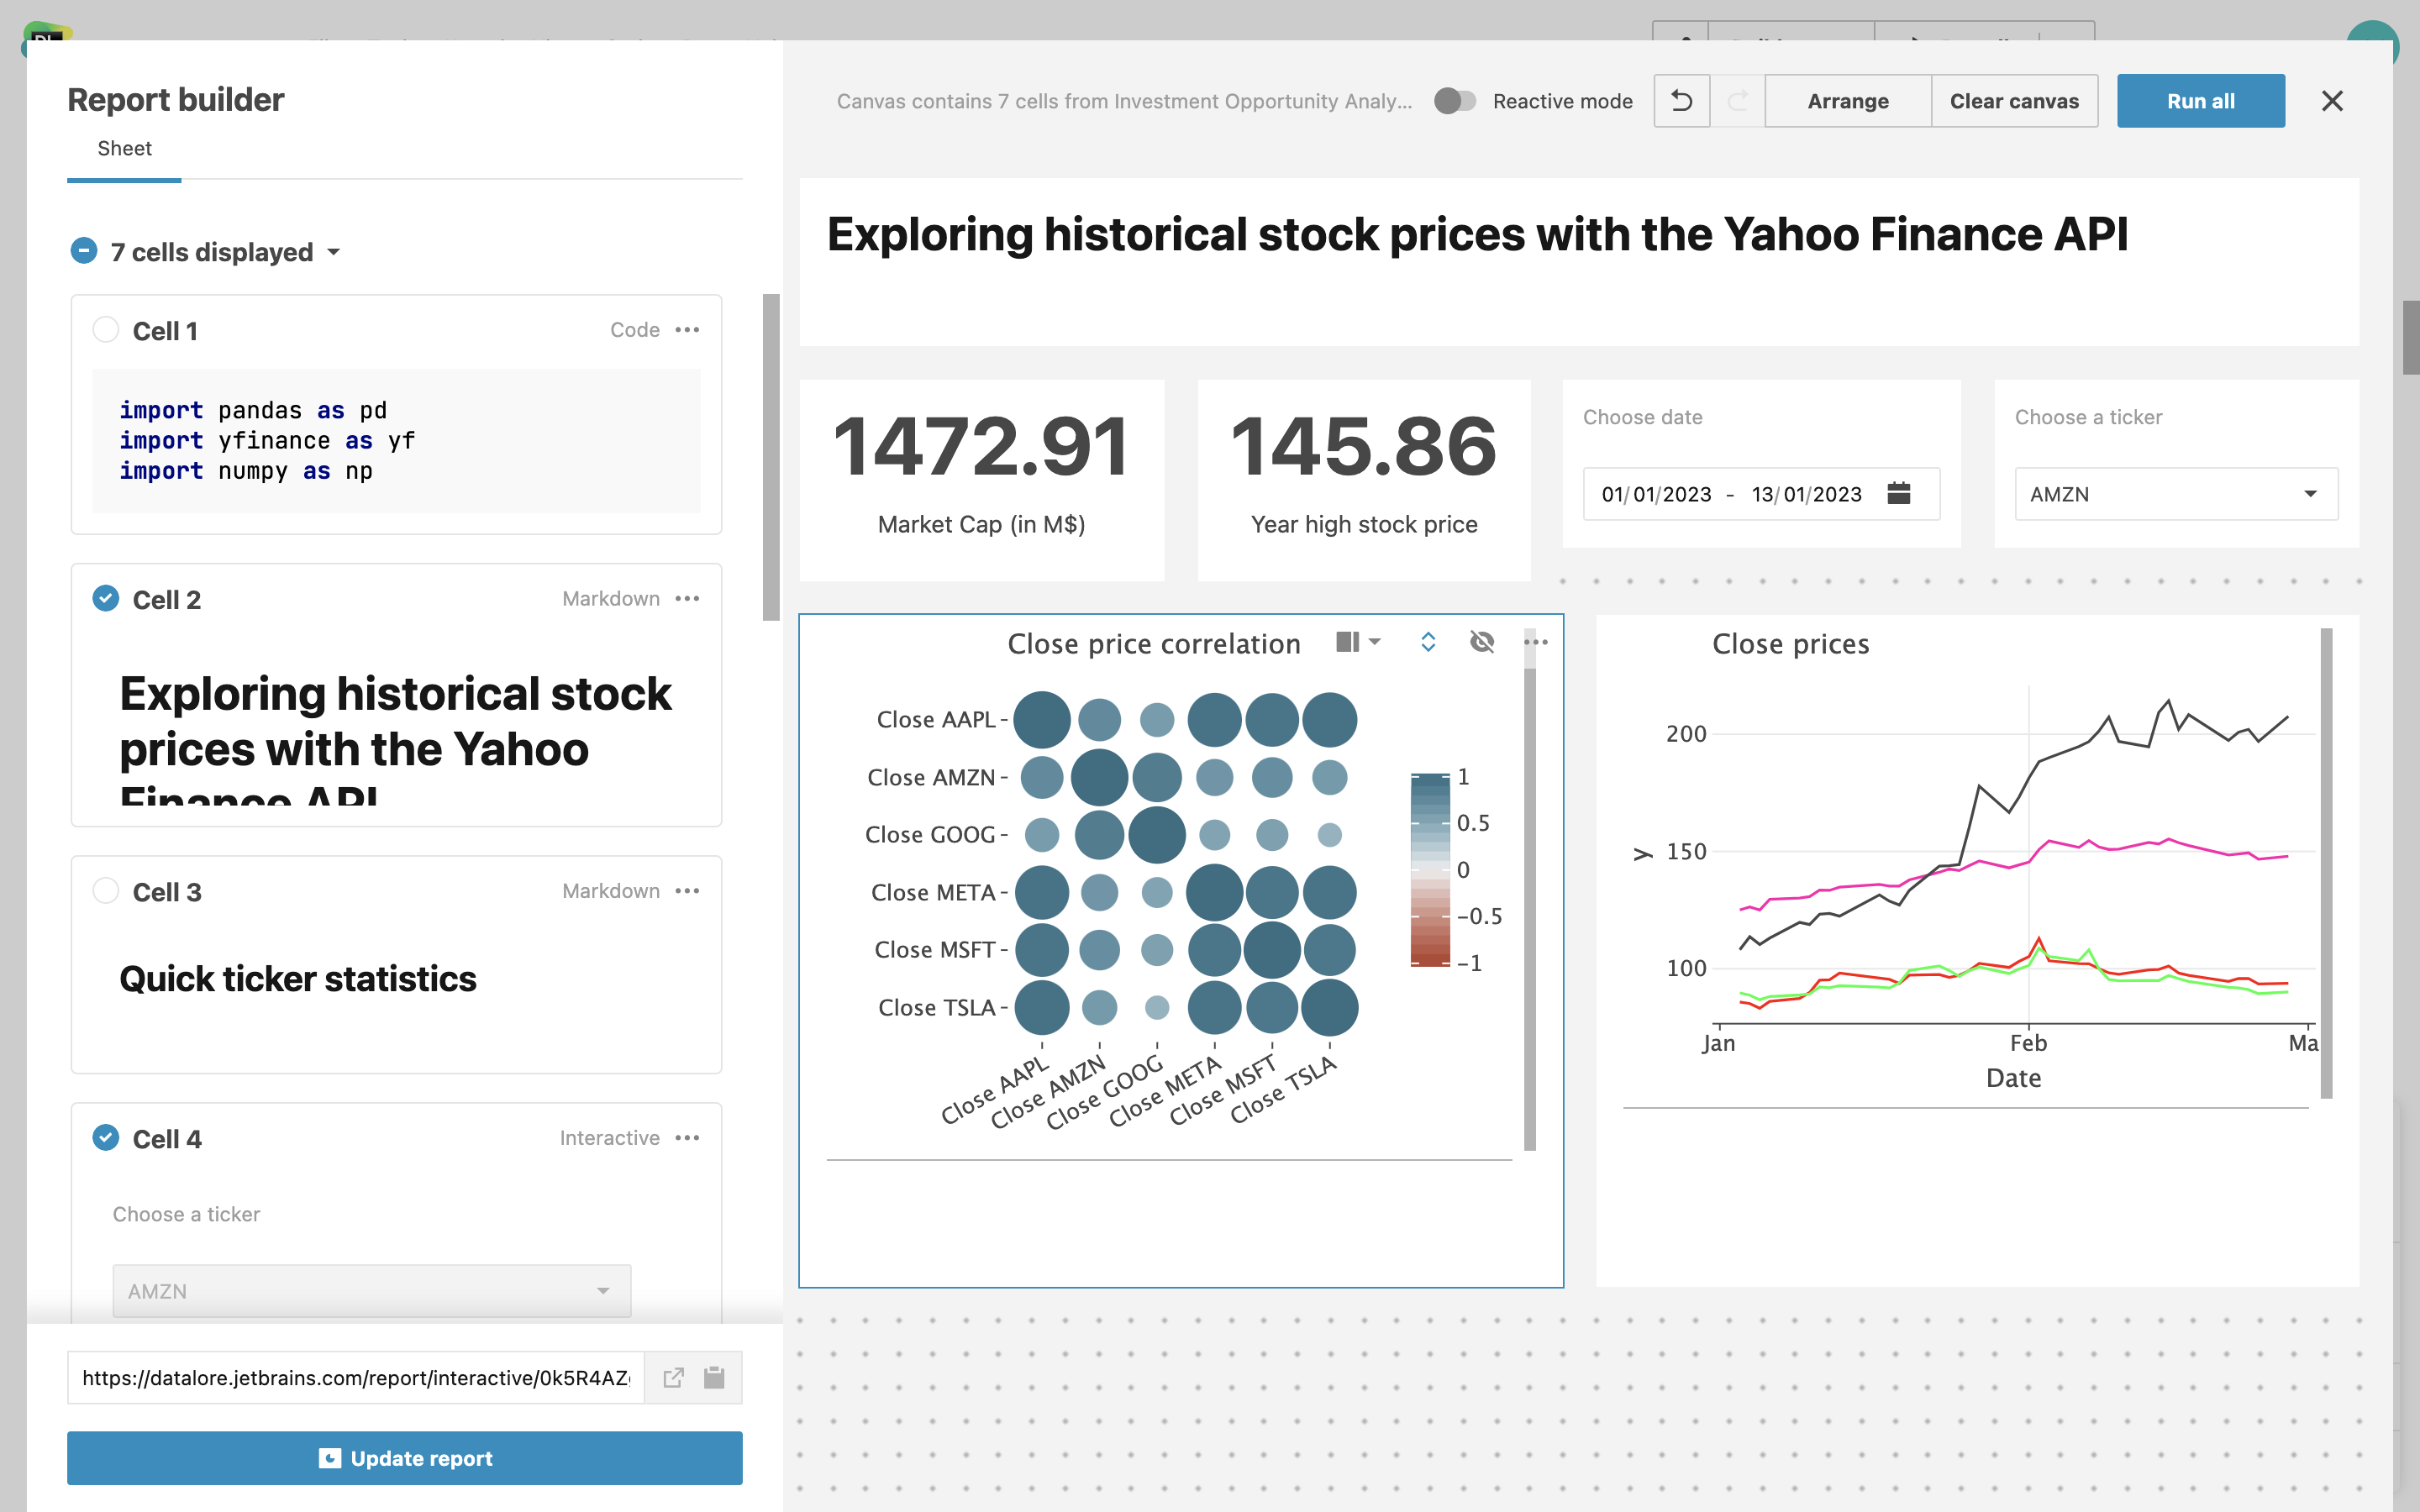
Report builder
Report builder revolutionizes the way you build interactive reports from notebooks in Datalore. Arrange the cells on the canvas, easily adjust their height and width, hide unnecessary steps, and share a static or interactive report with your stakeholders via a link.
Interactive reports
Share notebooks as data stories by publishing an interactive report and sending your team a public link to access it. Each report viewer will get their own copy of the report and will be able to change controls, widgets, and chart cell inputs and recompute the report on demand. No Datalore account is required to access the reports.

Interactive controls
Add interactive inputs such as dropdowns, sliders, text inputs, and date cells inside your notebooks, and use the input values as variables inside your code. Present the visualizations with Chart cells and highlight specific numbers within Metric cells.
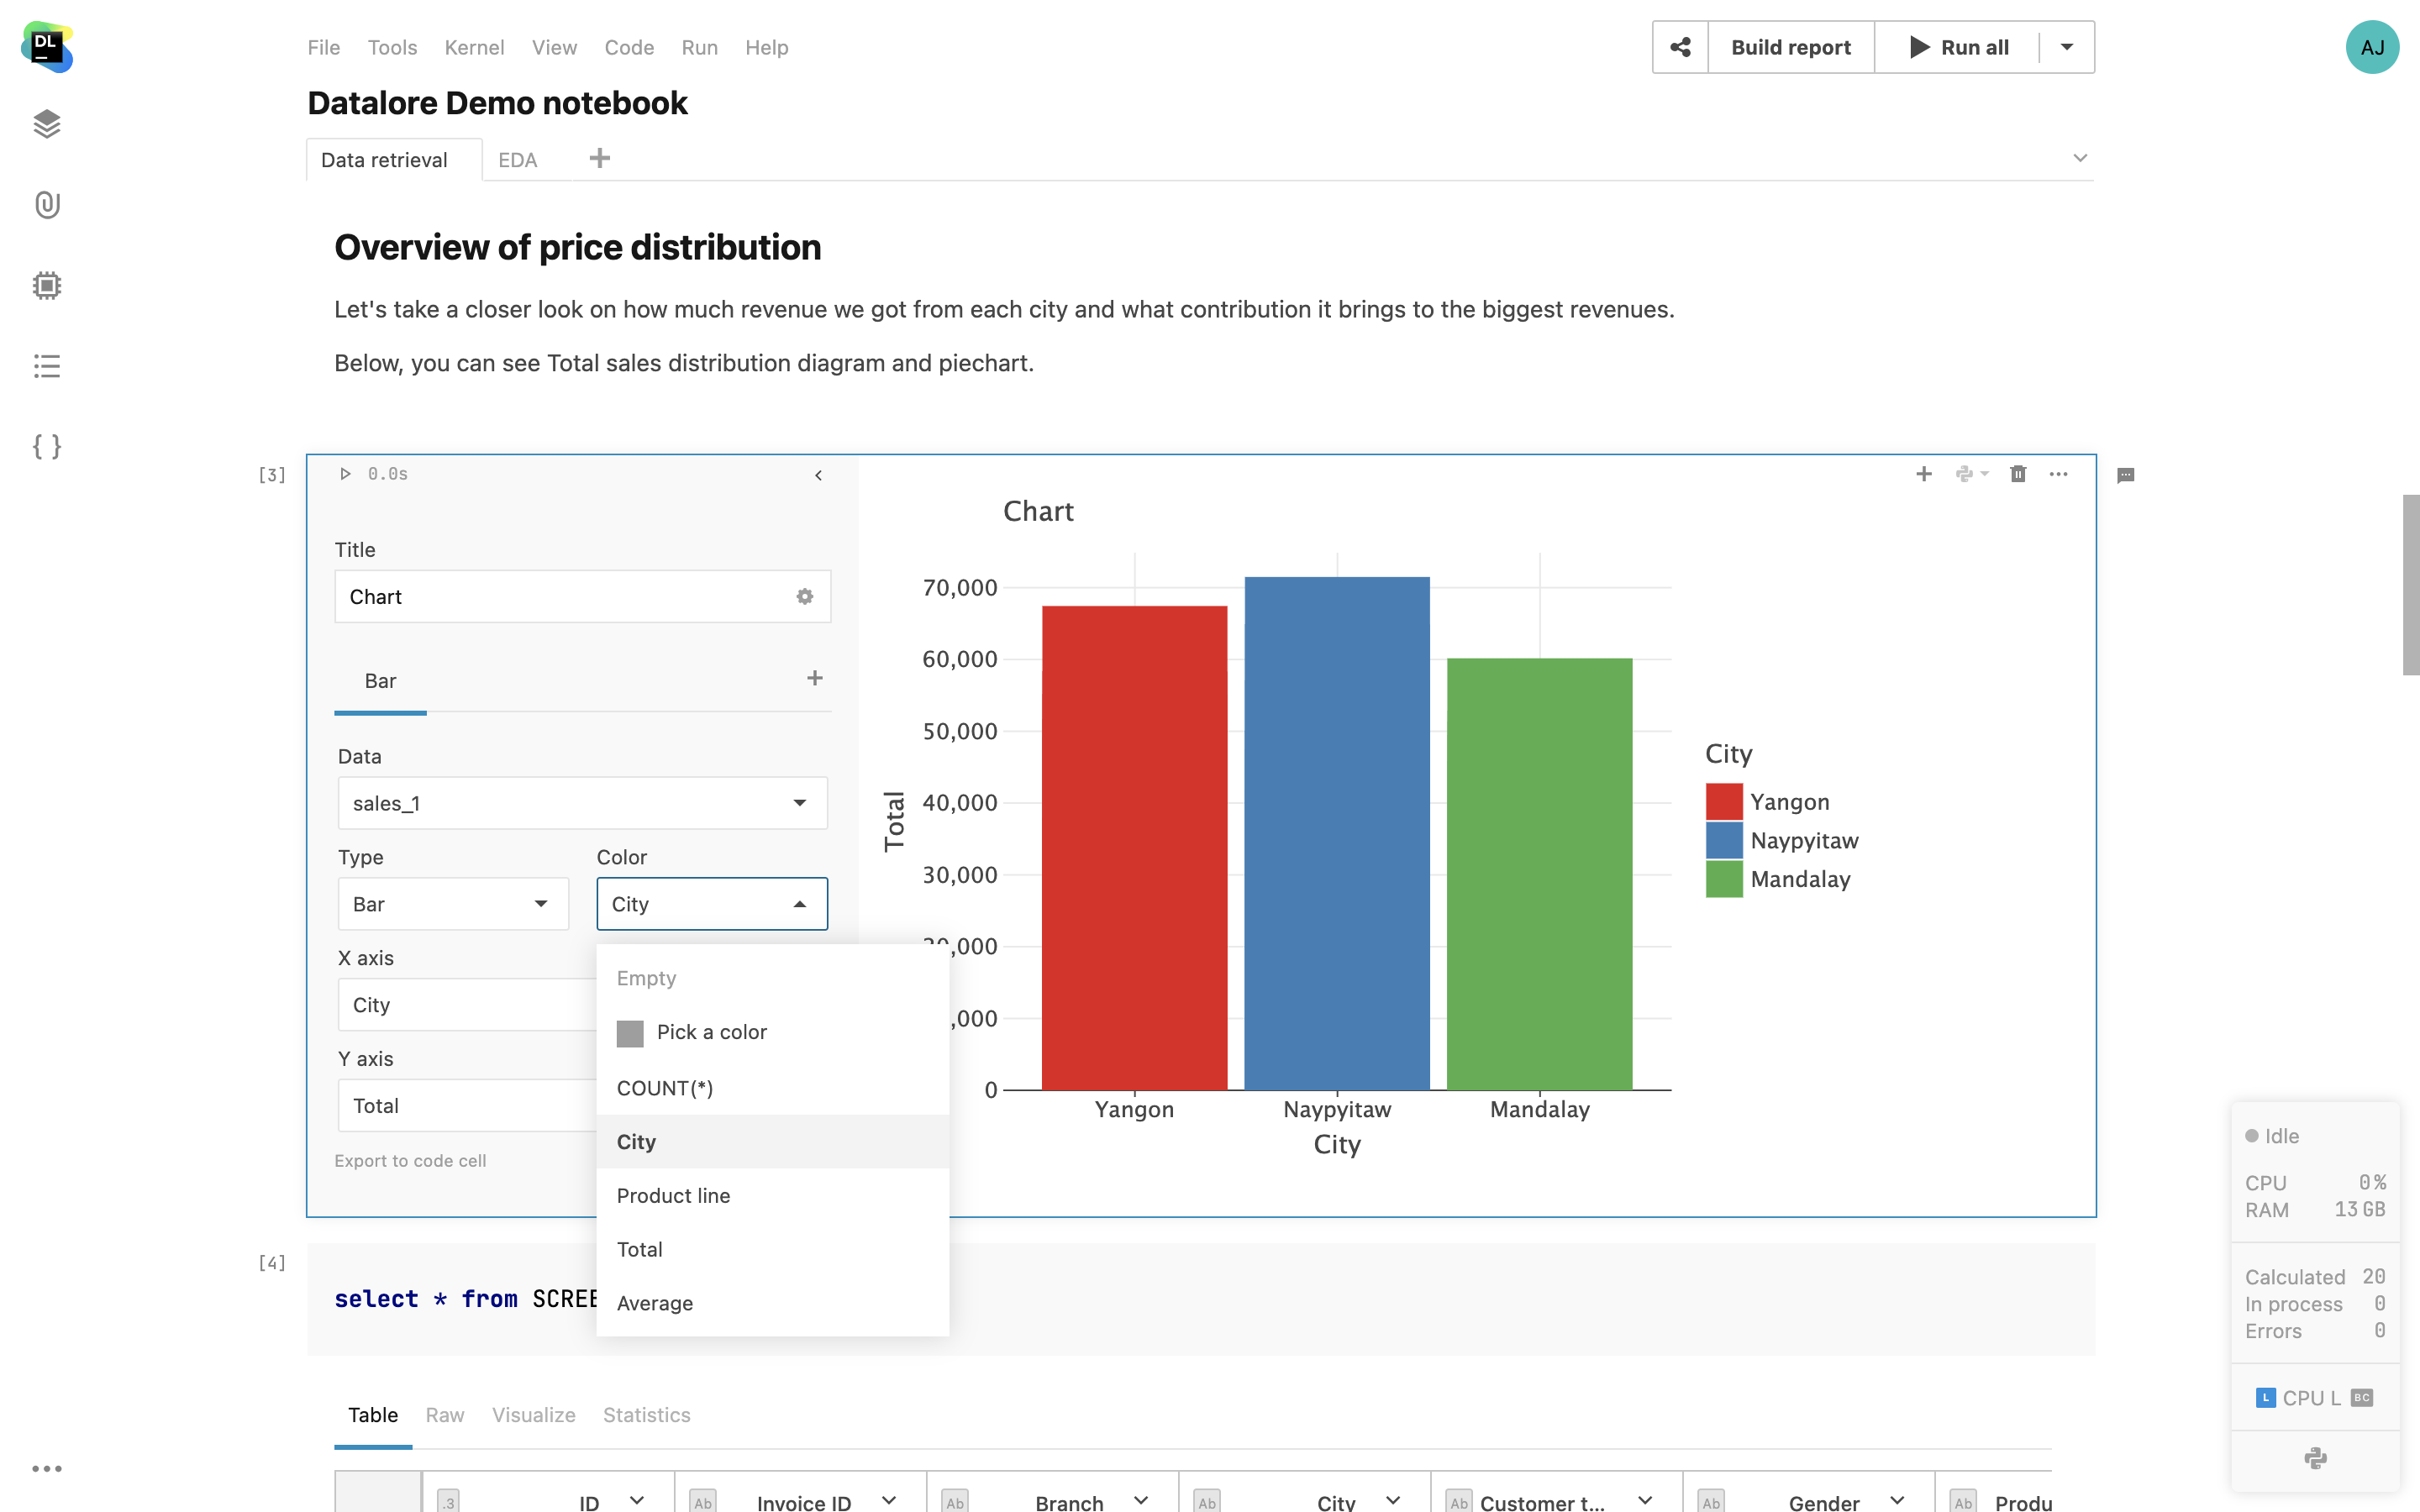
Interactive chart cells
Create production-ready visualizations in just a few clicks and let report viewers collaborate on them.
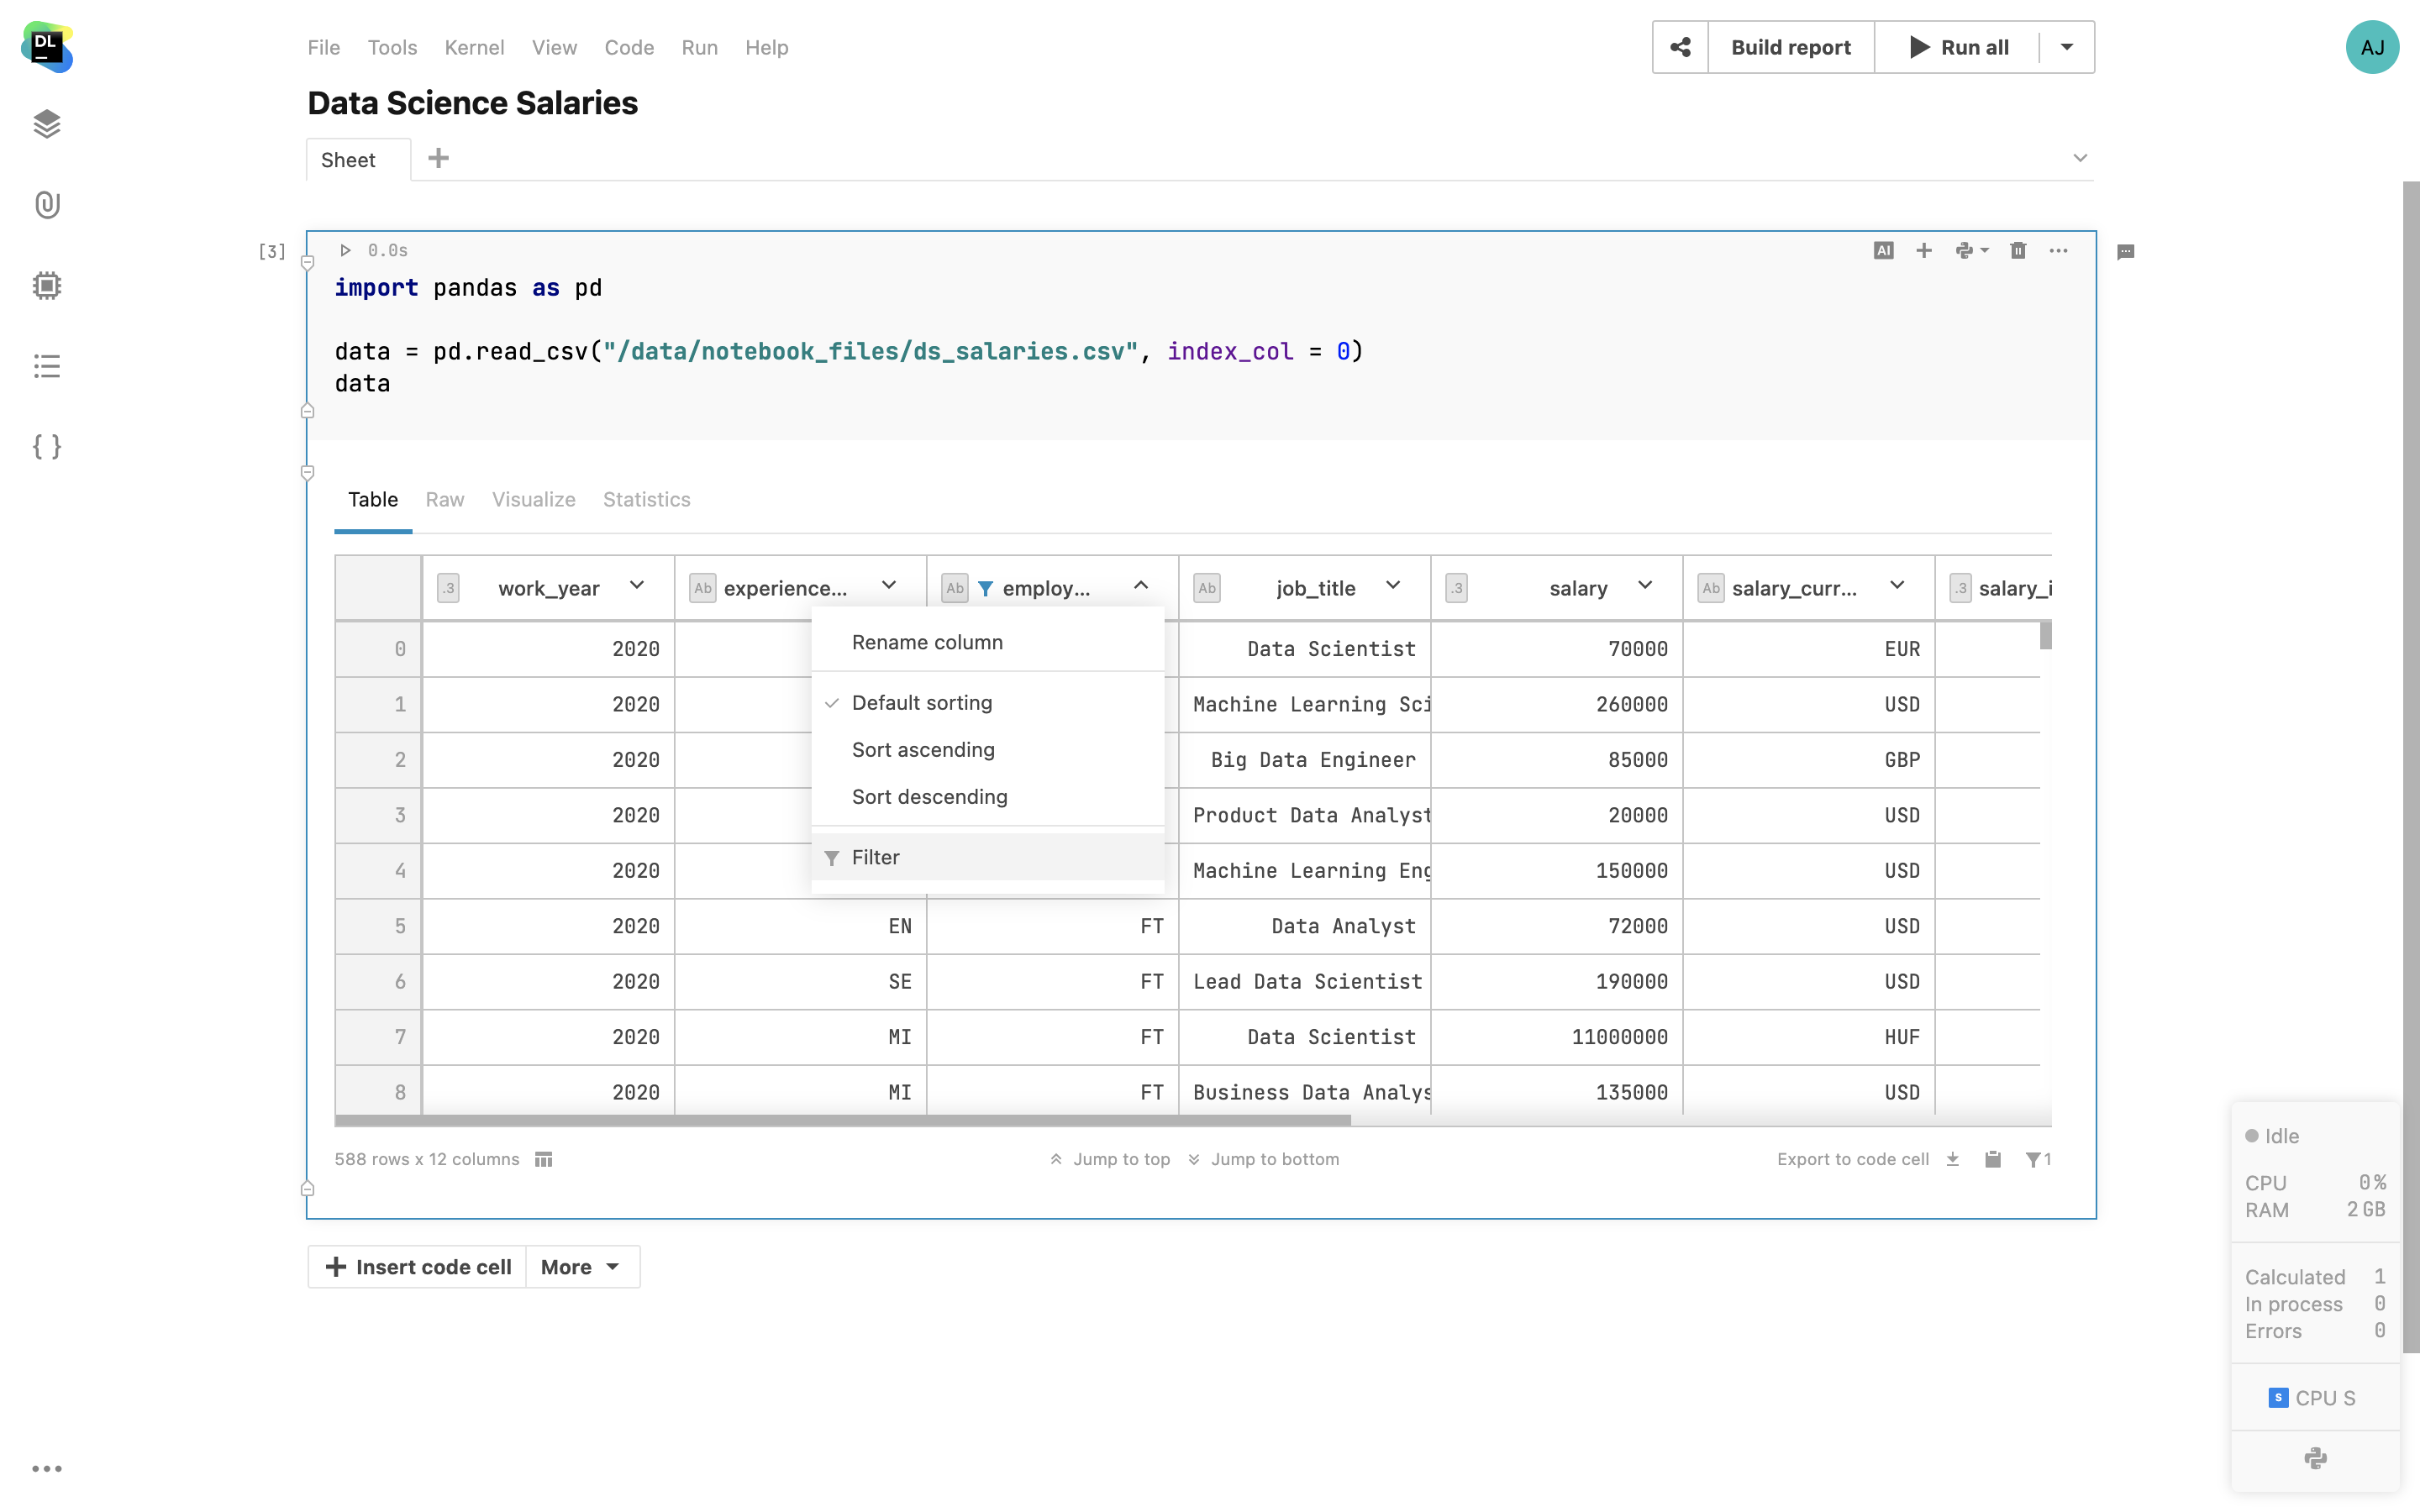
Interactive tables
Apply filtering and sorting to Pandas DataFrames and SQL query results directly in the cell output. You will be able to select the columns to display, sort the dataset by a specific column, filter based on “equals” and “contains” expressions, and easily jump to the top and bottom of the dataset.
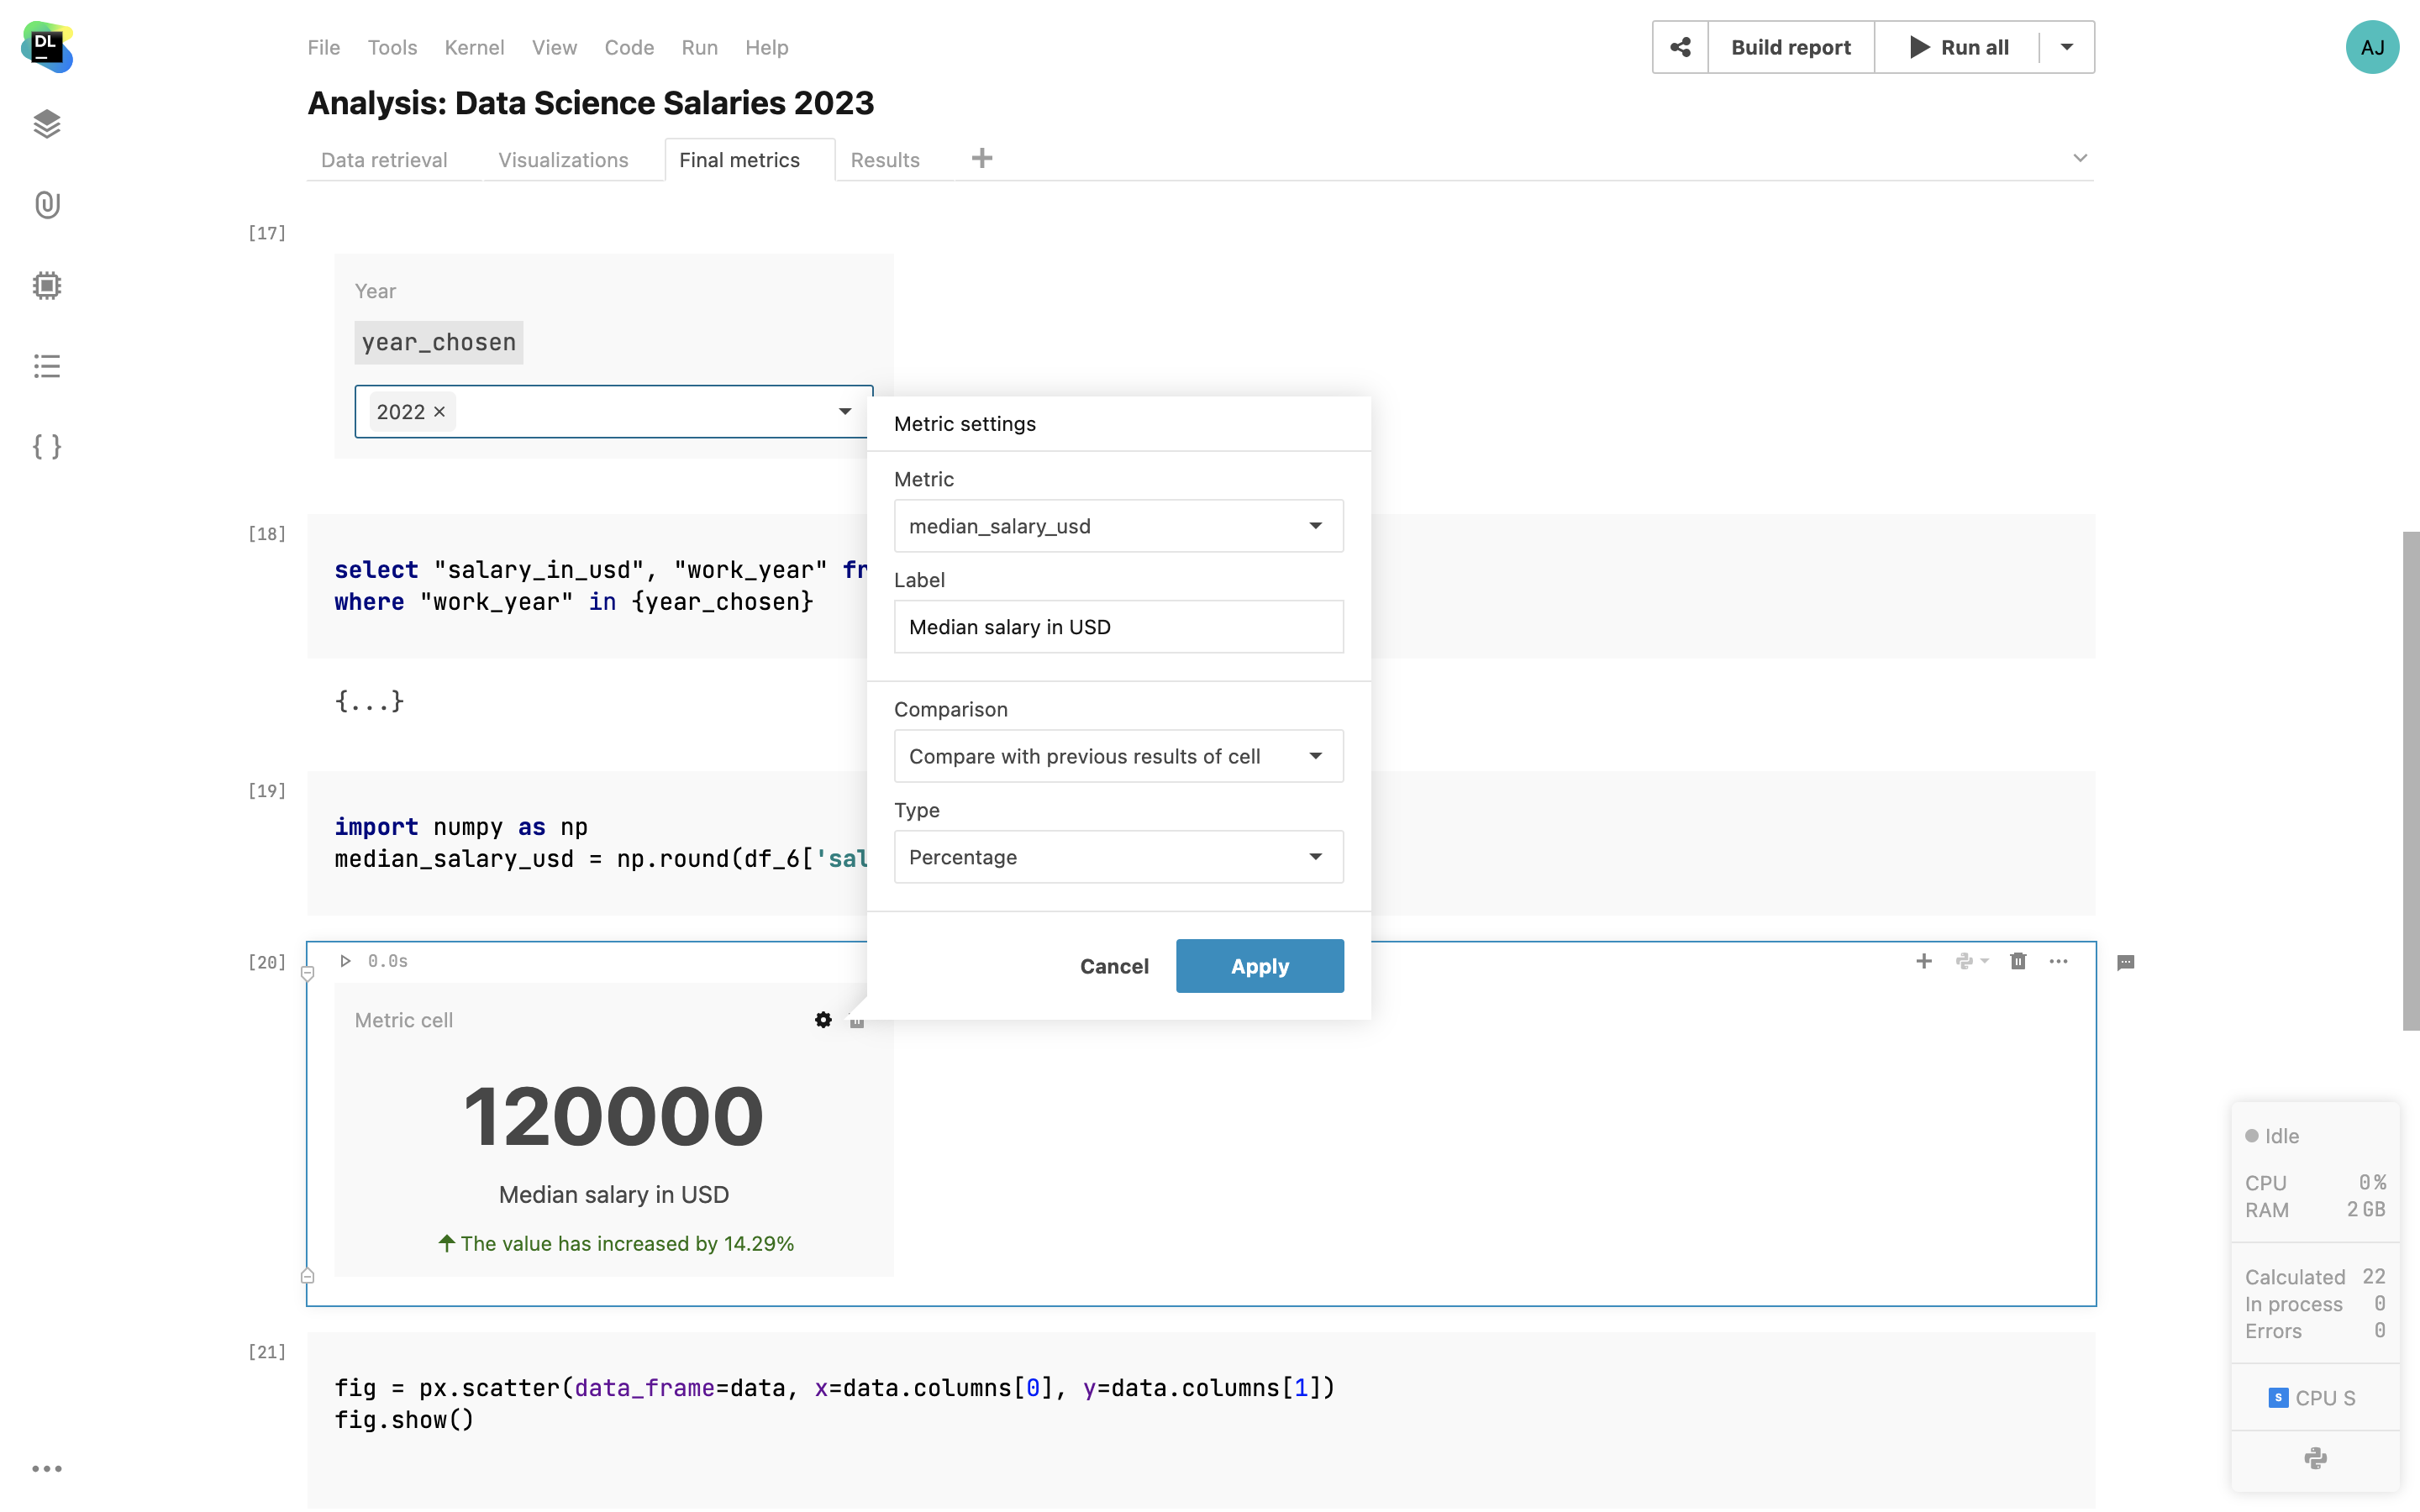
Metric cell
Make certain numbers stand out in your notebooks and reports with a Metric cell. Enable automatic comparison to a certain variable or to the previous cell run results.
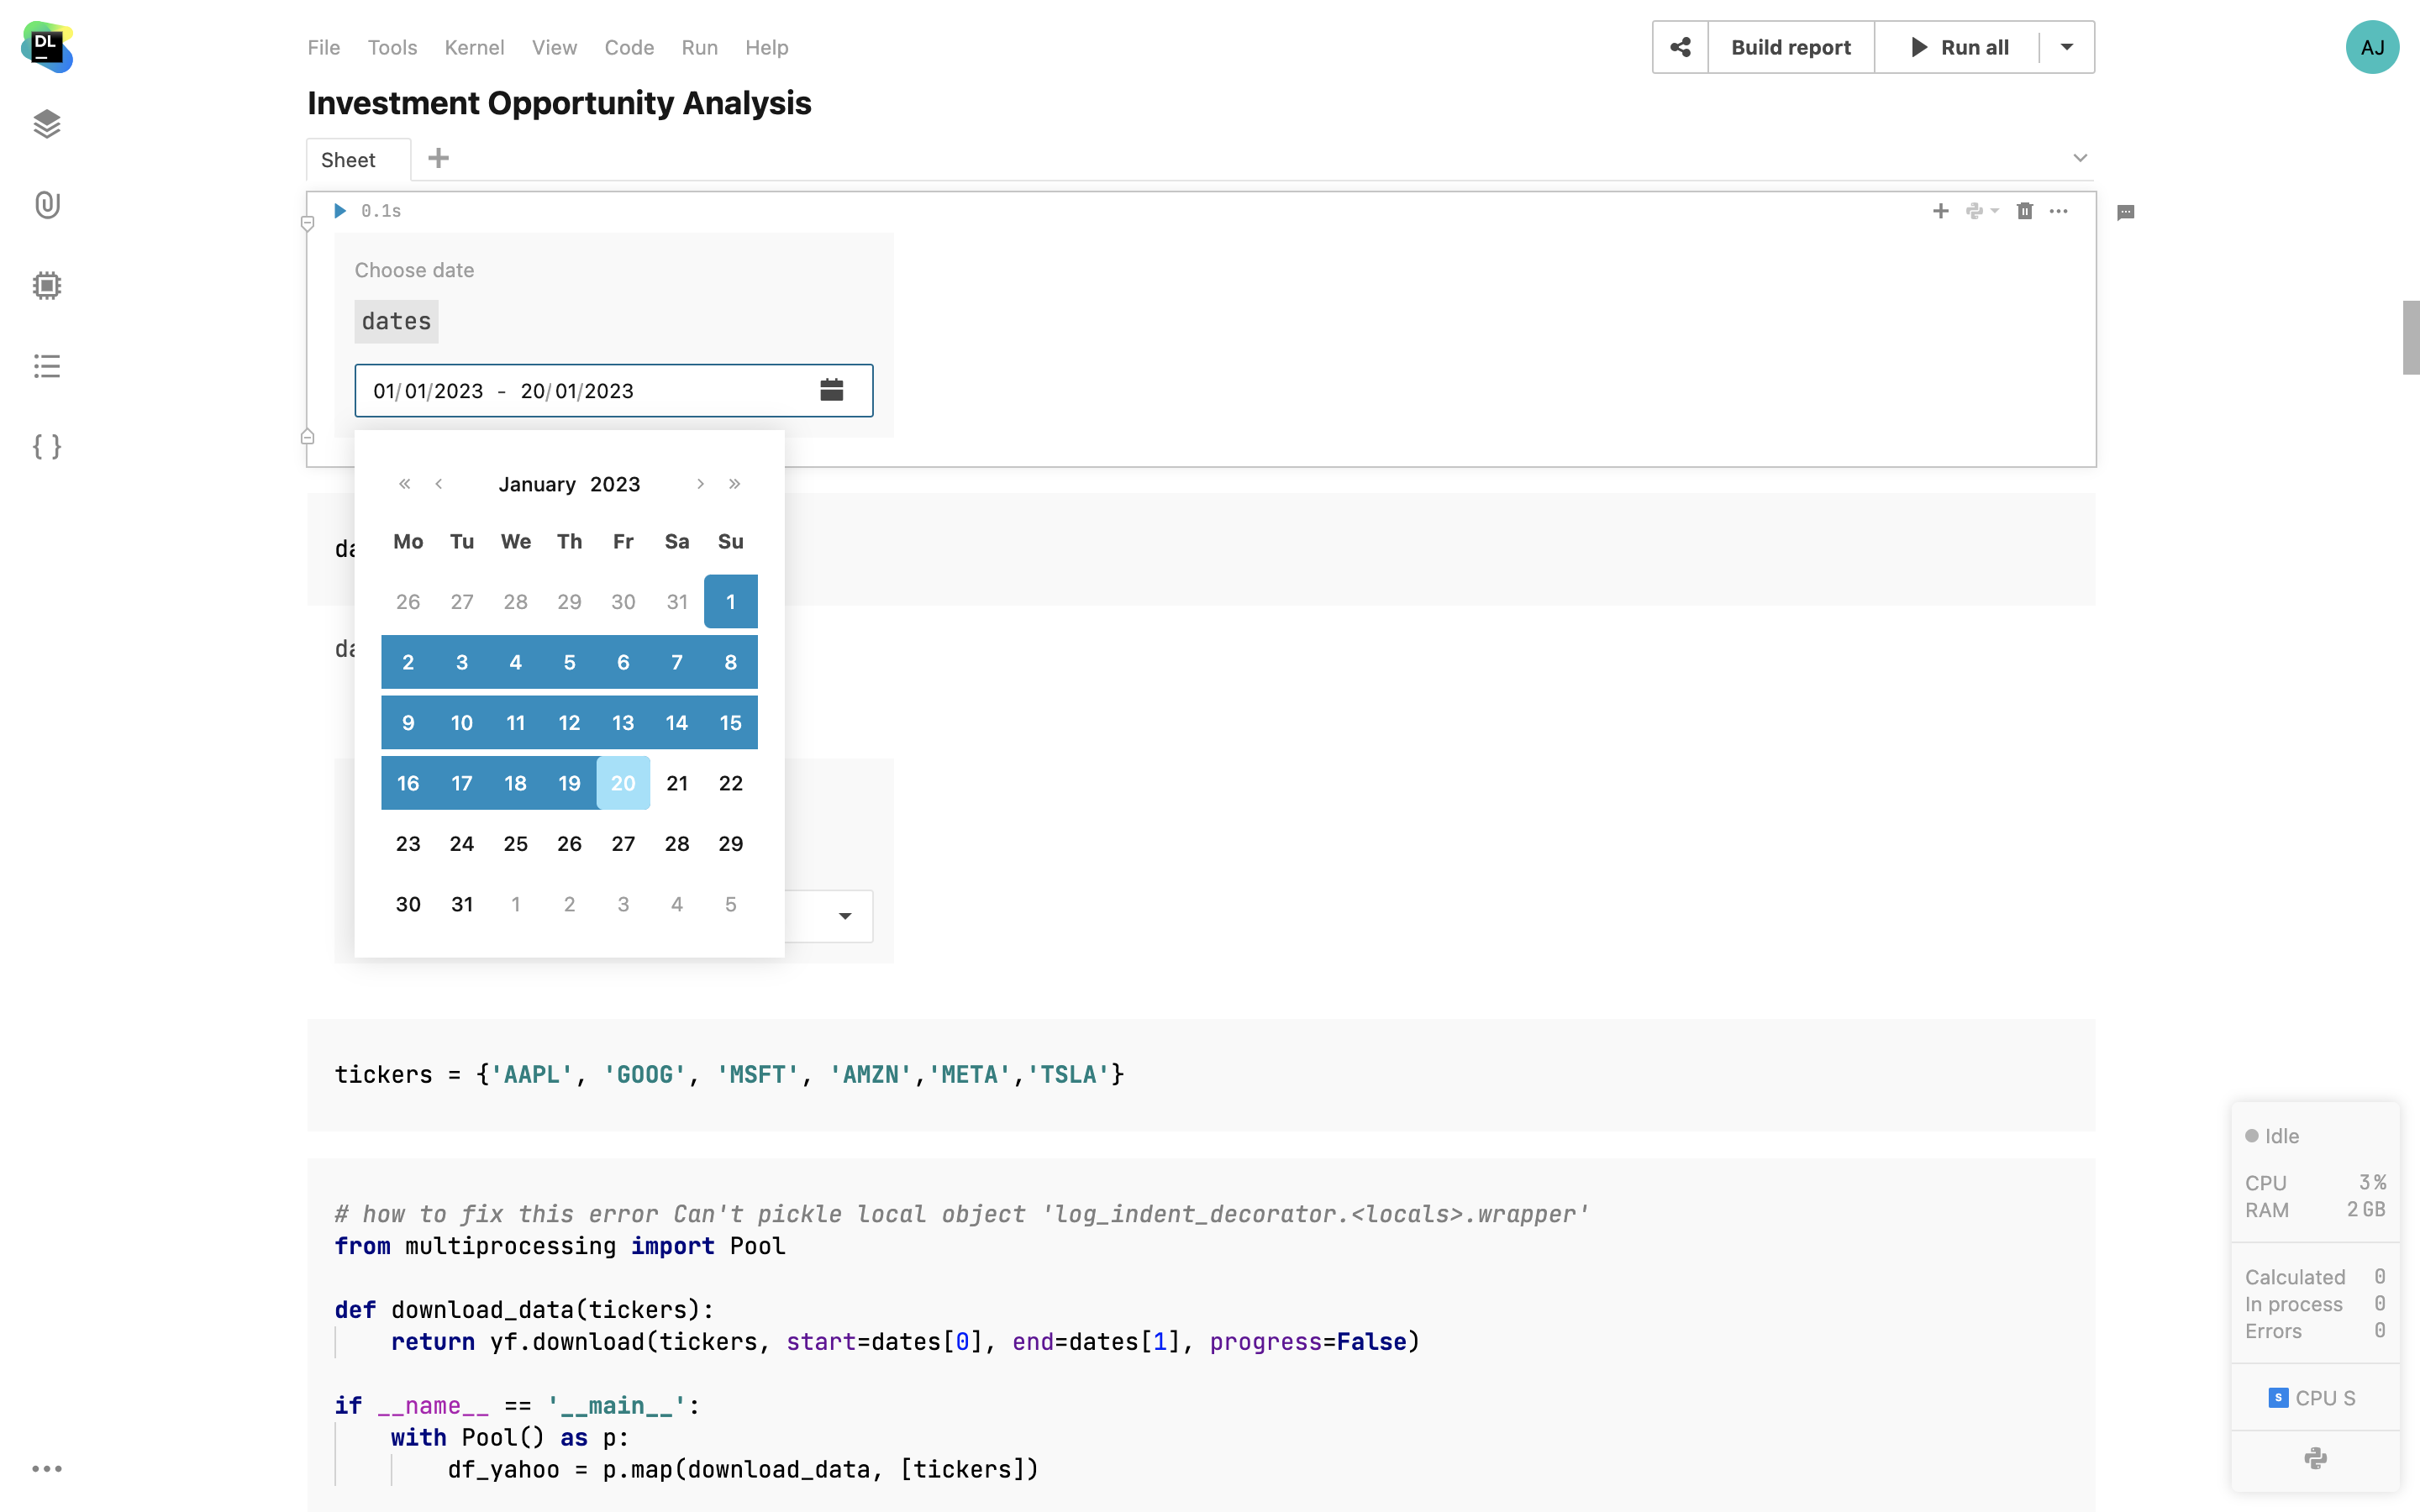
Date cell
With Date cell, your notebook collaborators and report users can choose a specific date or a date range from the user interface.
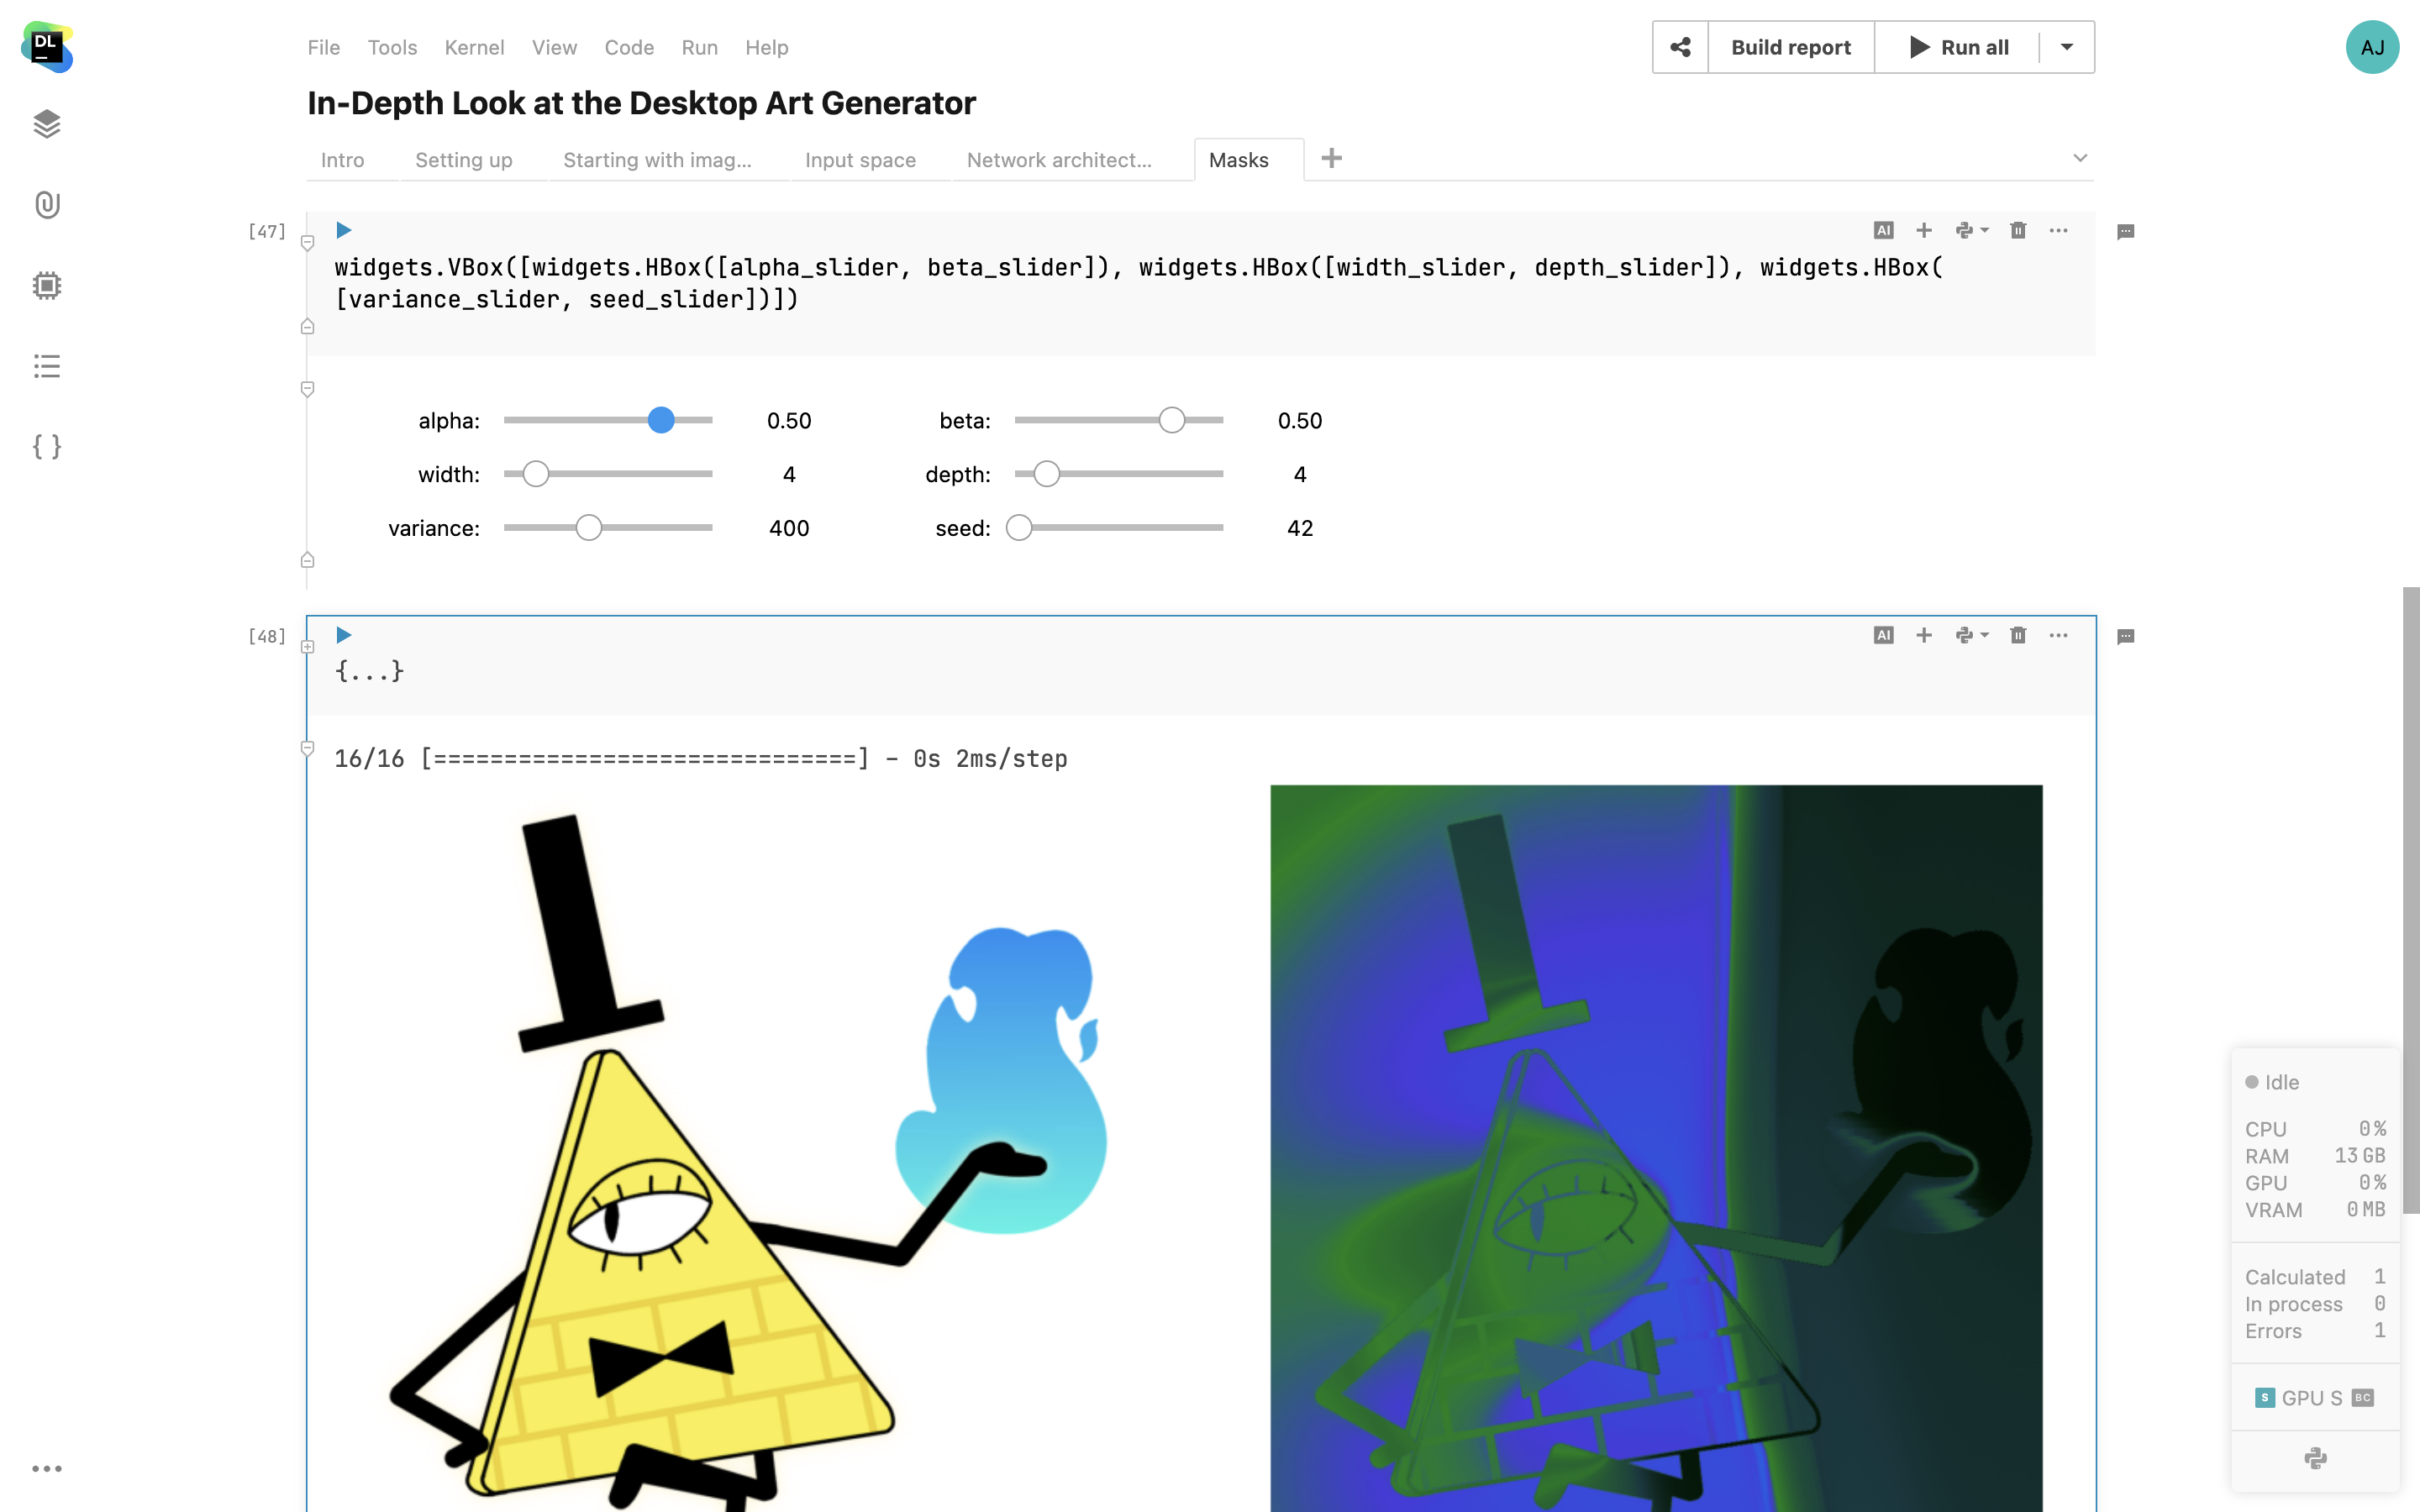
IPywidgets support
Datalore supports classic Jupyter widgets framework such as ipywidgets. Add interactive controls with Python code, combine multiple widgets in one cell output, and use the selection as a variable in the following parts of your notebook.

Flexible drag-and-drop in the Report builder
This flexible functionality allows you to design and structure your reports effortlessly by dragging and dropping cells onto the canvas. Сells dynamically adjust their height and width based on the available space. This feature optimizes the layout of your reports, maximizing the use of space and ensuring a clean and organized presentation of your data.
Static reports
If you need to present the notebook as a static page, you can publish it as a static report and also share it with viewers by public link. You can add further changes to the initial notebook and update the published report so that everyone sees the most recent copy.

Embedding cells from reports
Create embeds from published notebooks and integrate them into your Medium articles and other places, such as WordPress websites, Reddit, Notion, etc. Just copy a link to the cell from the published notebook and paste it to your platform.
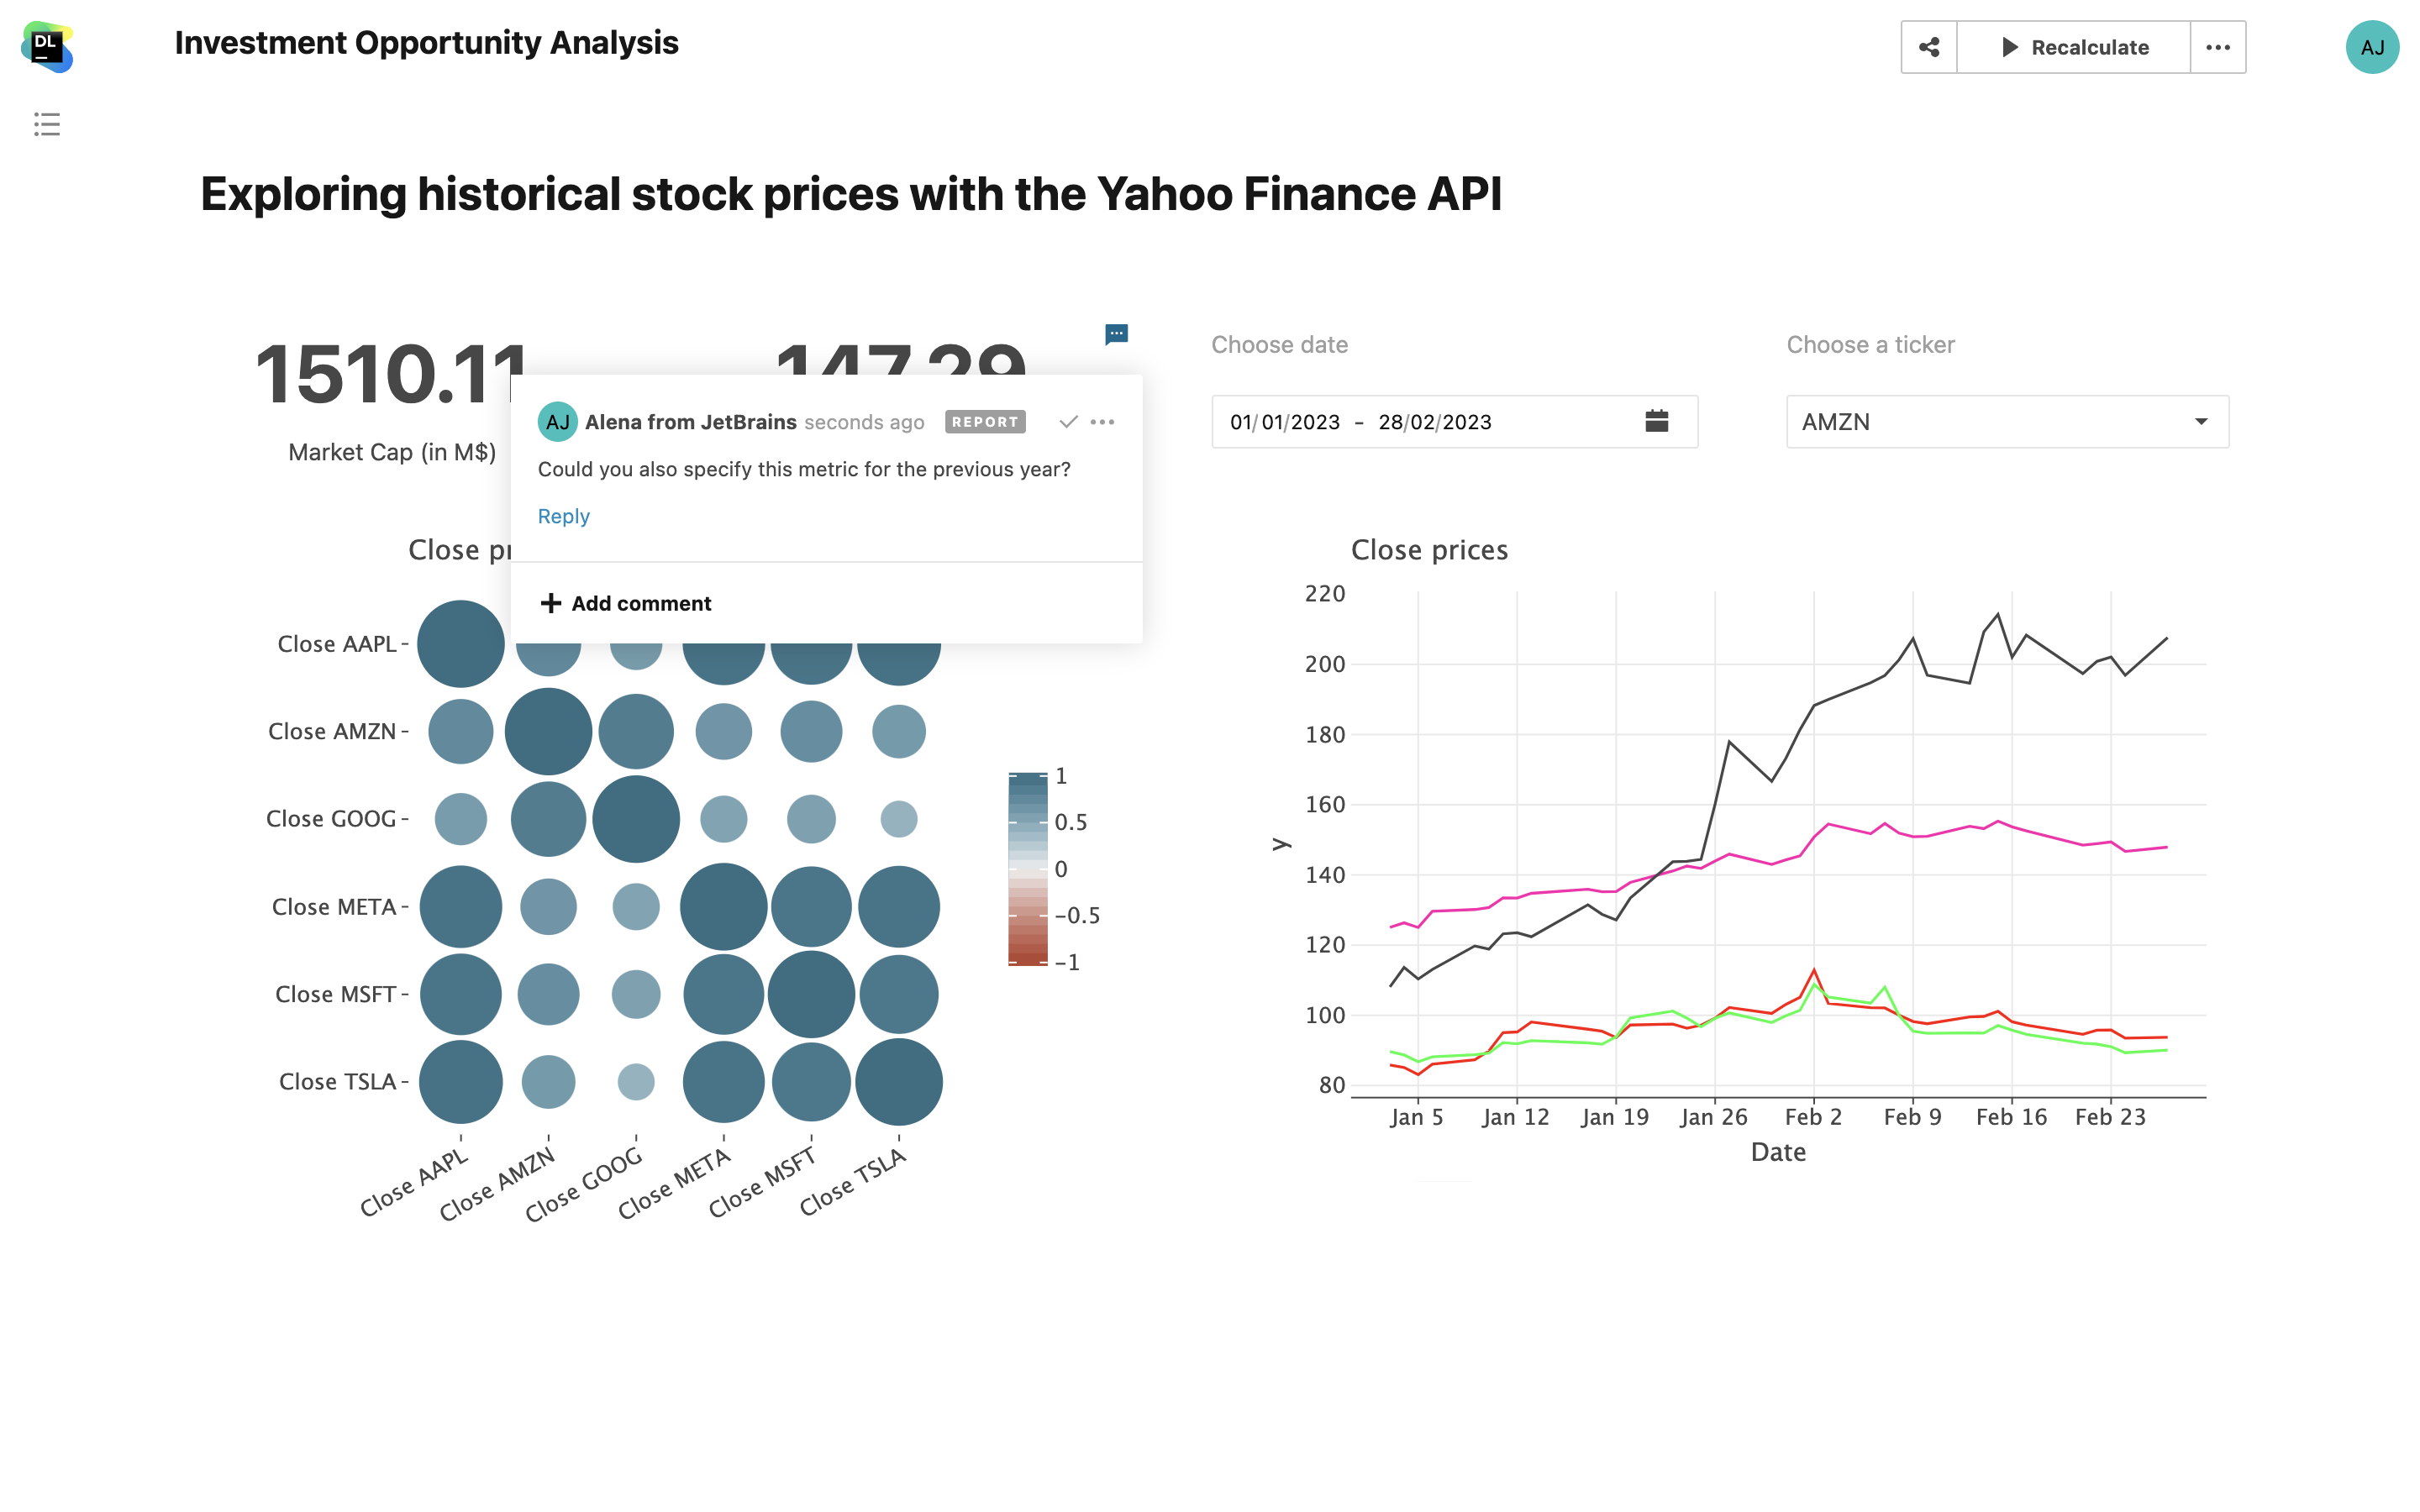
Cell commenting in reports
Add comments to cells in both notebooks and reports. Comments made in the report will sync with related cells in the notebooks, maintaining a seamless comment flow. When your discussions come to an end, simply mark the relevant comment as resolved to wrap up the conversation.
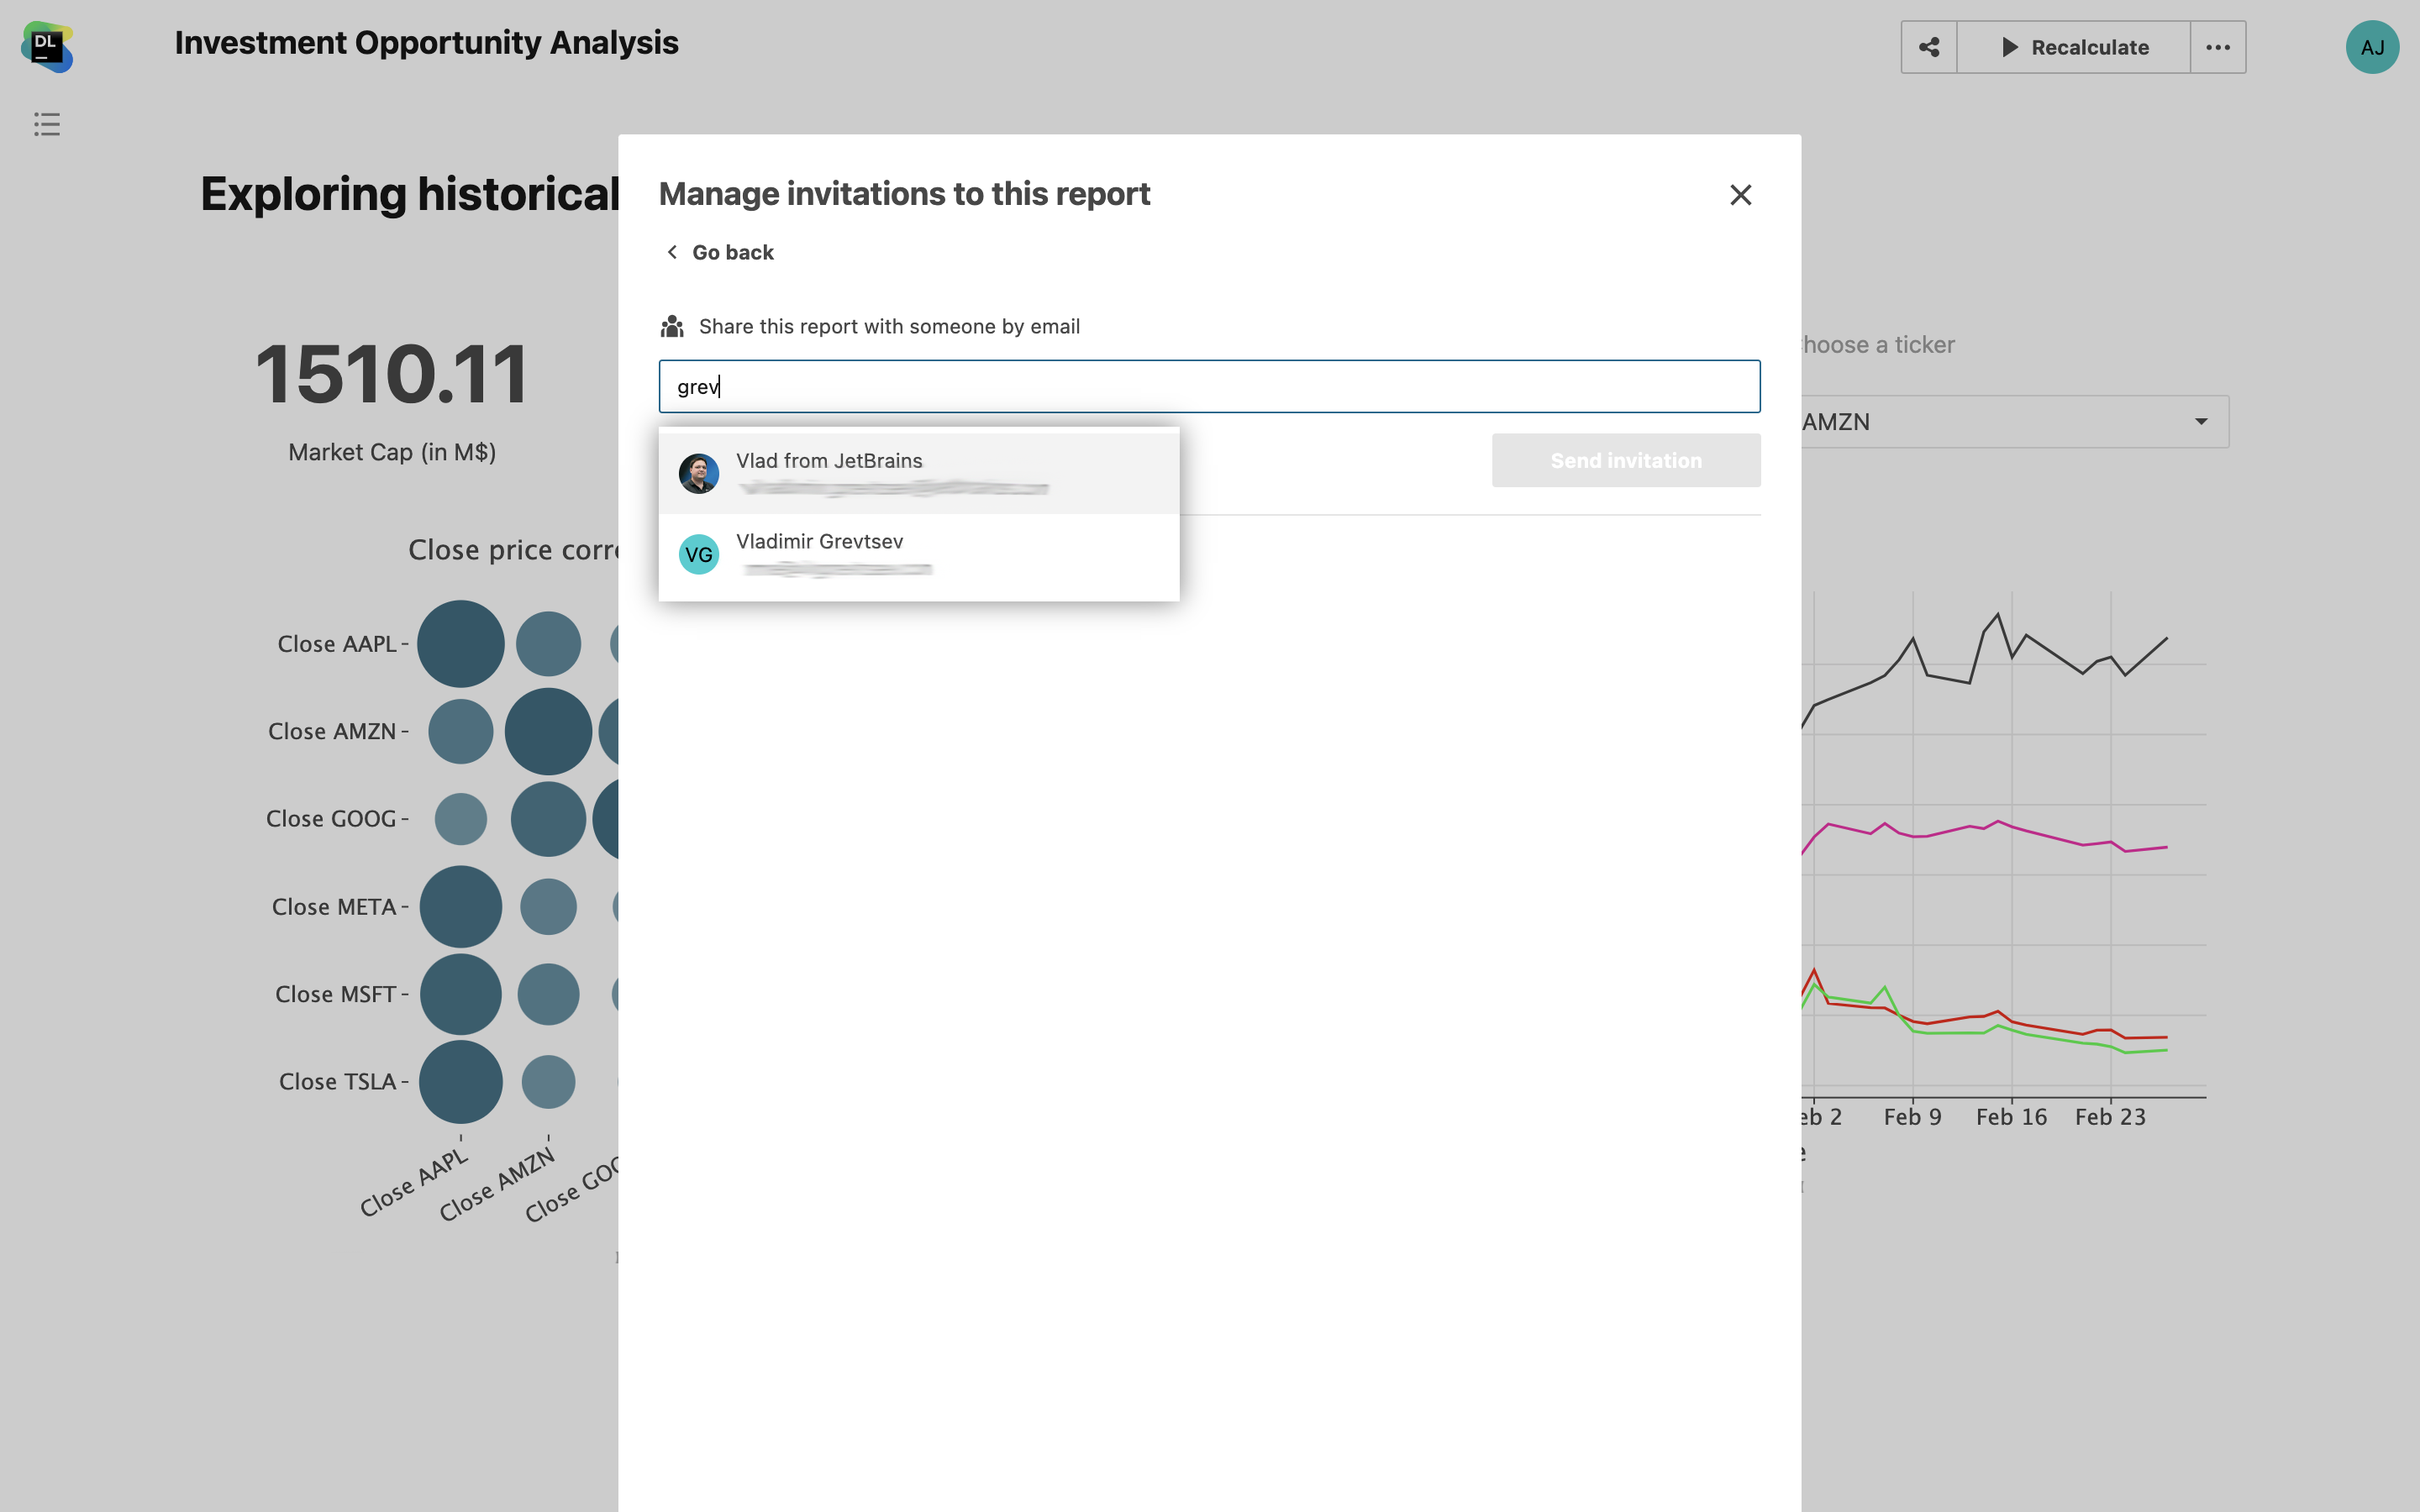
Easy sharing for unlimited report users
Share interactive and static reports with unlimited recipients in your team with just a link. When running interactive reports, viewers will consume your computational resources. When viewing static reports, no additional resources will be consumed.
Multiple exporting options
In Datalore you can export notebooks and reports as PDF, HTML, IPYNB, or PY files. You can also download the produced visualizations and table data simply by clicking the download button or right-clicking on the plot.

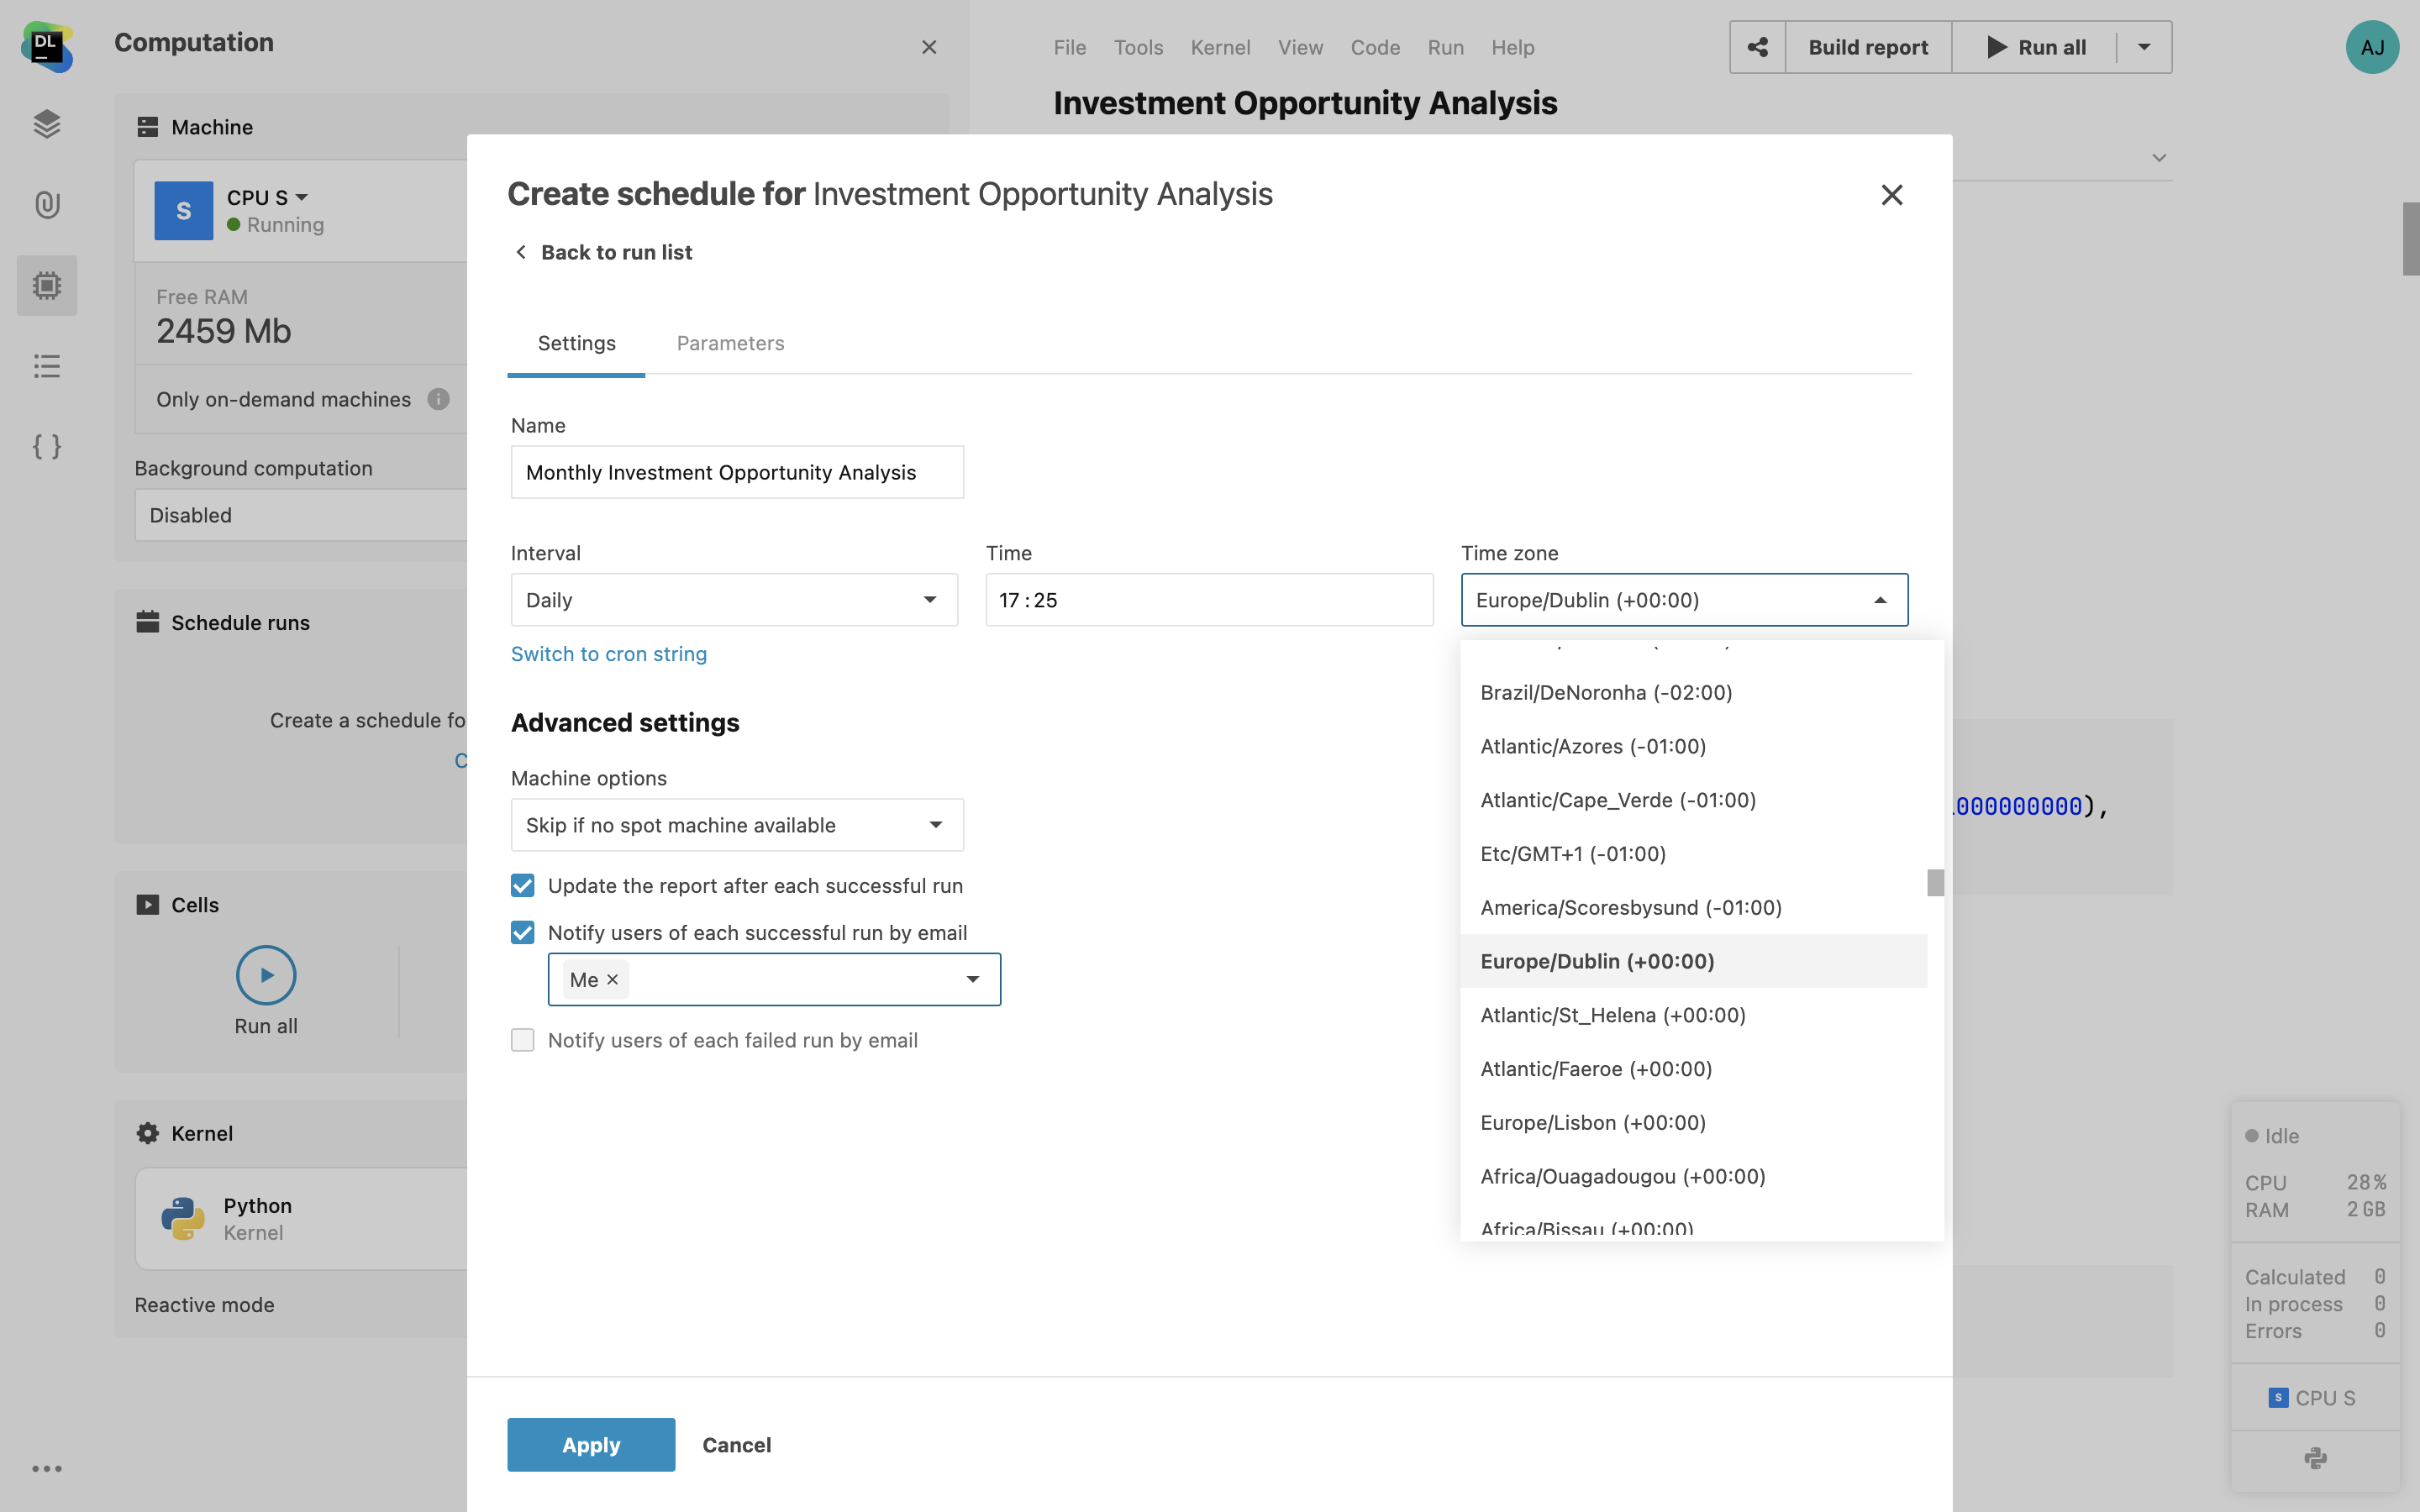
Scheduled report updates
When configuring notebook schedules, you can choose to automatically update published static and interactive reports, delivering regular updates to your stakeholders.