Debug servers
A debug server makes it easier to set up debugging for embedded development. Using a pre-configured debug server, you can run different run/debug configurations or build system targets such as CMake or Makefile. You can also run long-lived debug server sessions, known as GDB target extended-remote mode: the server does not shut down when you stop debugging.
This guide explains how to configure a debug server and run a debug session. To demonstrate the feature functionality, we use the nRF52840 Development Kit with a built-in SEGGER J-Link debugger and a simple application example that outputs “Hello world” in the console.
Configuring a debug server
Go to .
Under Debuggers for embedded development, click the tile for your debug probe. CLion adds a new debug-server profile of that type to the list.
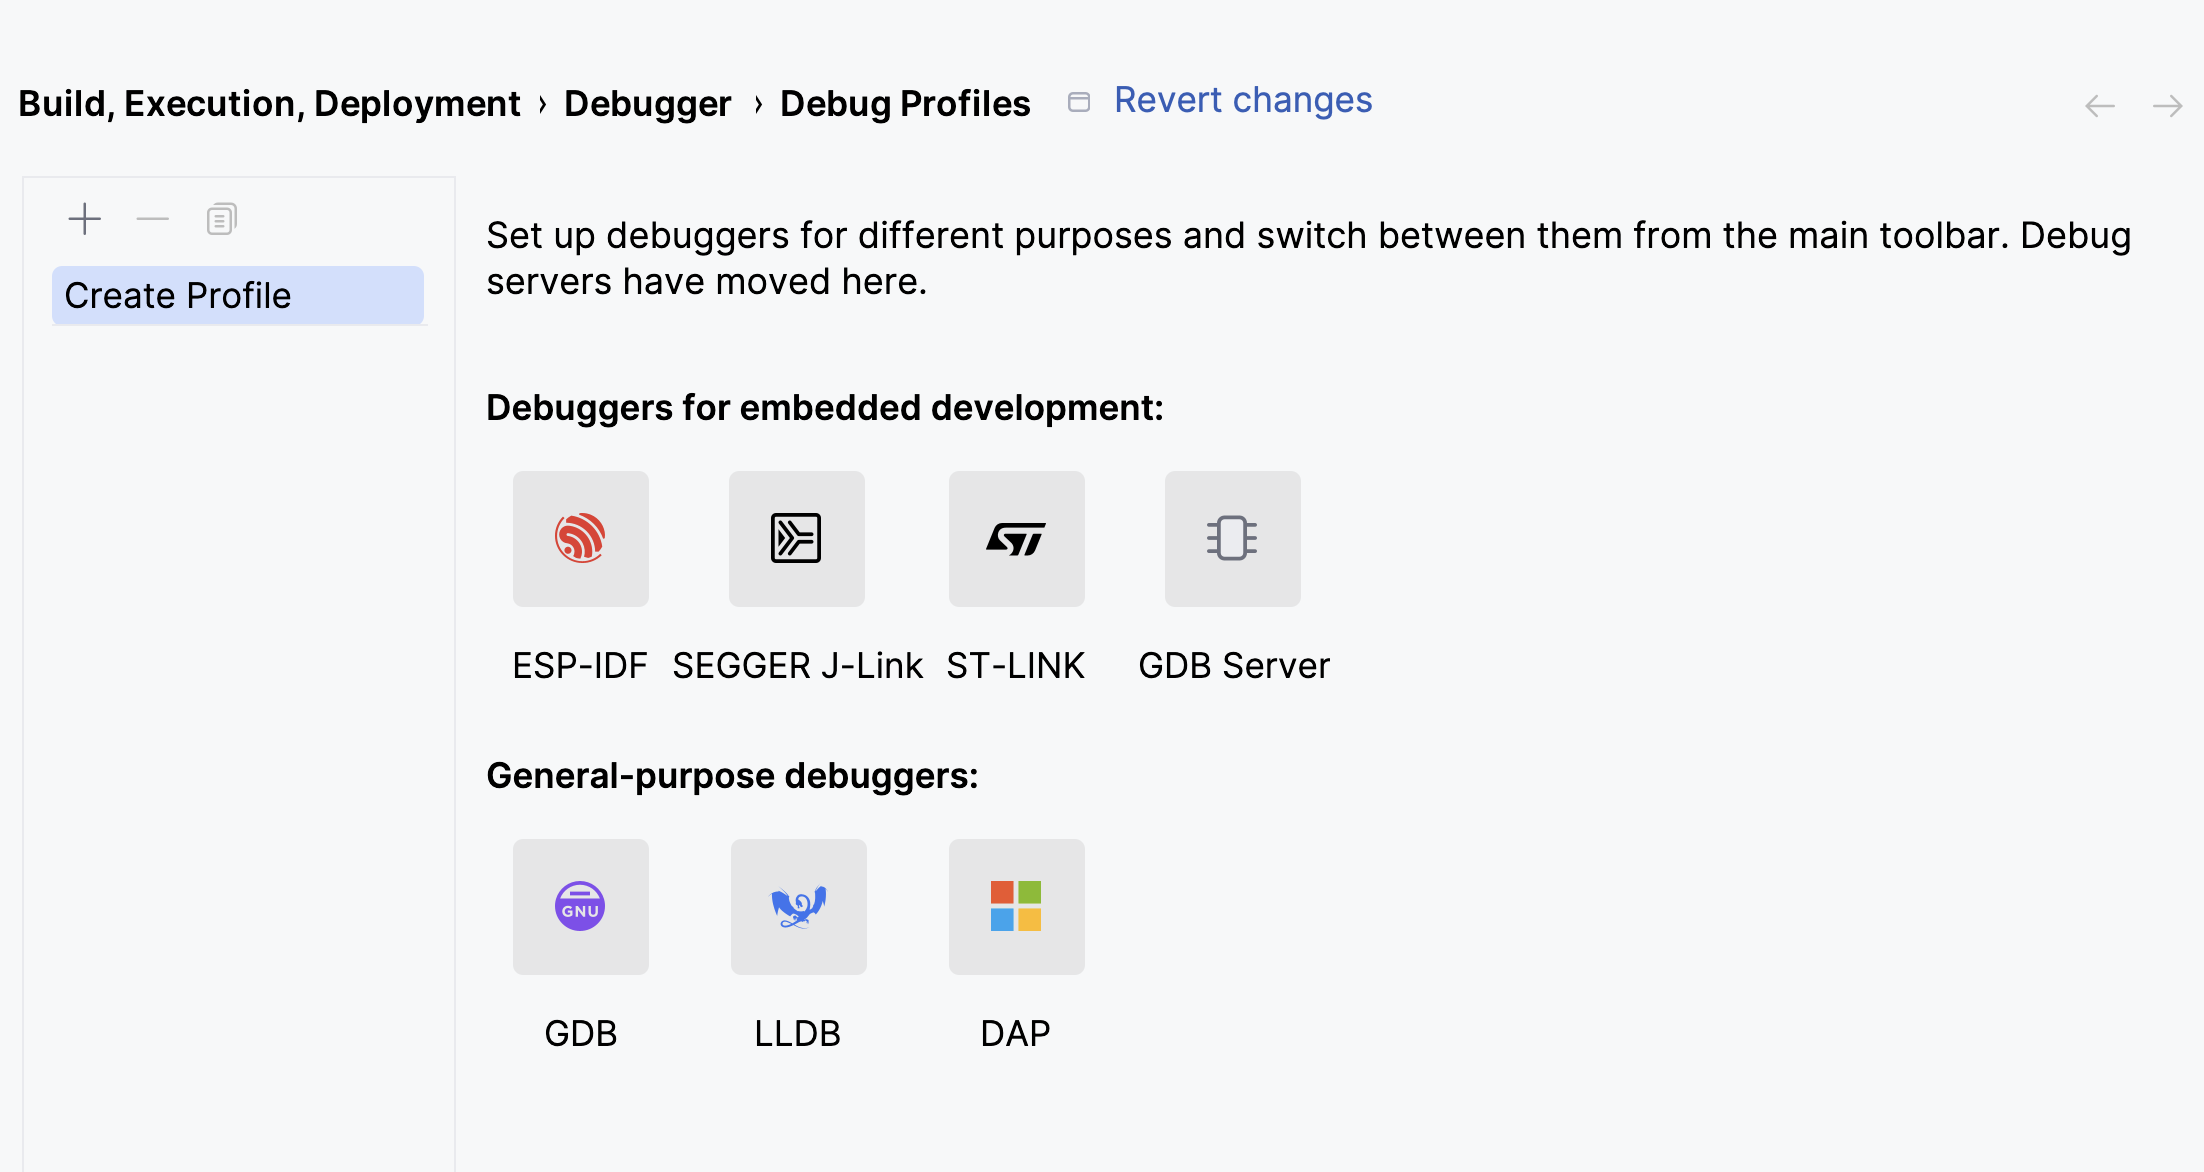
The GDB Server tile suits any debug probe and offers a broader range of options. The others are more focused and provide only the necessary options: the SEGGER J-Link profile targets J-Link debug probes, while ST-LINK and ESP-IDF target STM32CubeMX and ESP-IDF projects respectively.
Configure a GDB server, device, and debugger in appropriate tabs as needed for your project.
Be sure you have J-Link software installed.
Some important settings to note:
In the SEGGER JLink GDB Server tab, you need to specify the device you are working with:
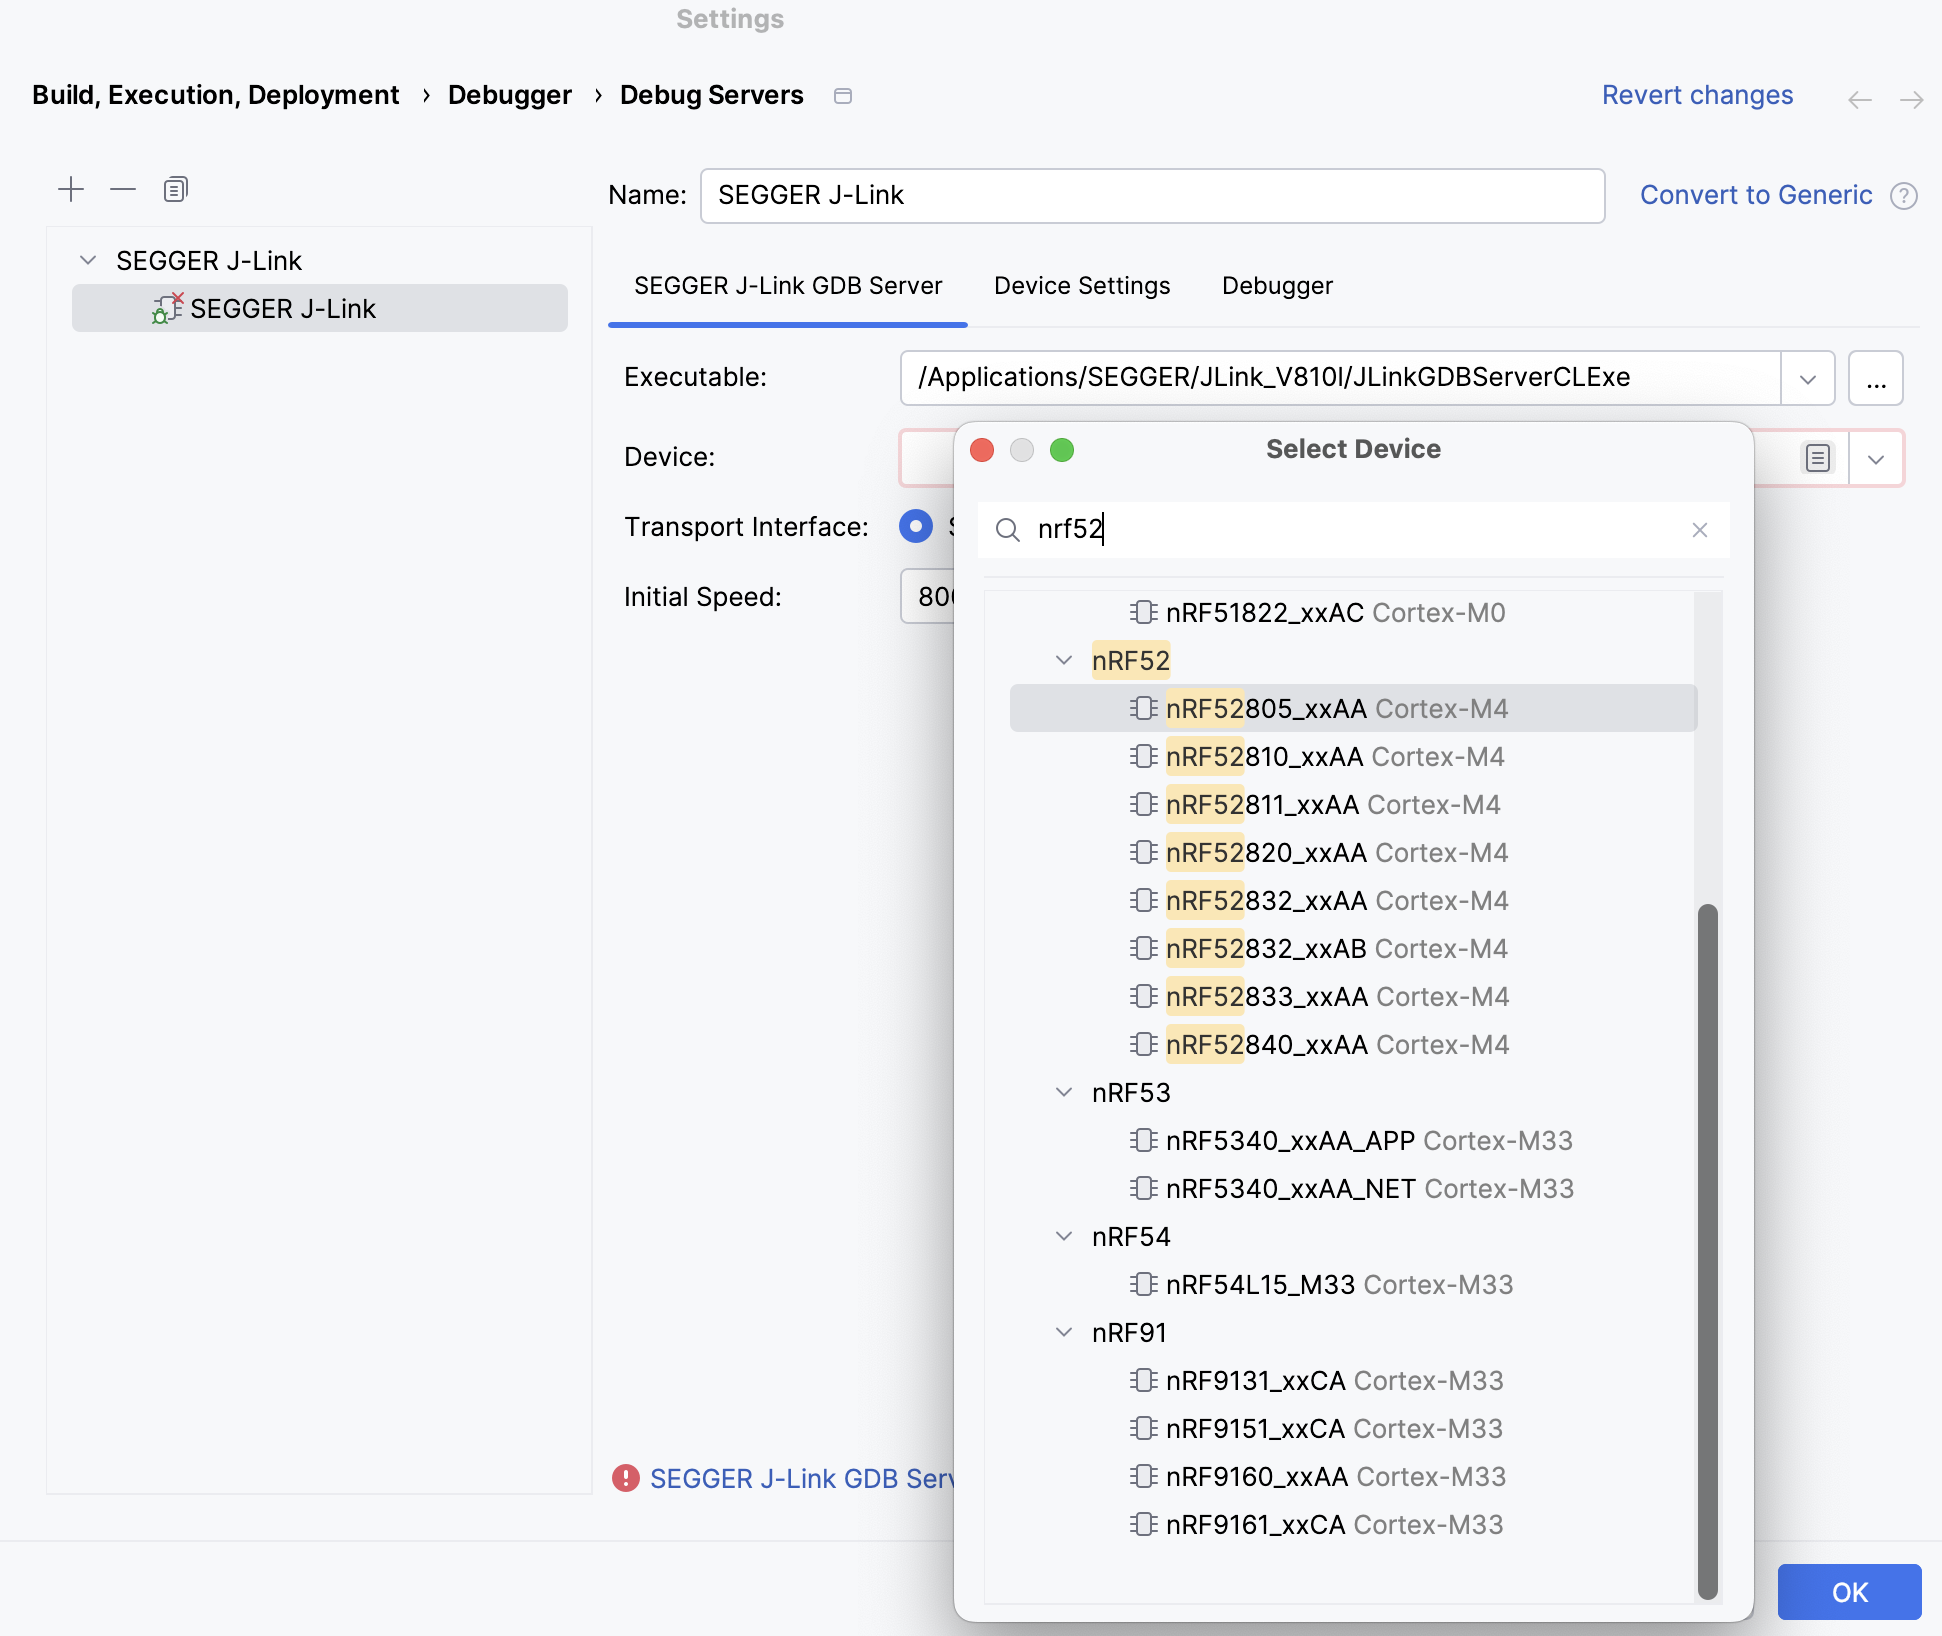
CLion tries to guess the installation path with an executable, but sometimes you need to give it the path manually.
In the Device Settings tab, you can select and configure a preferred console type, such as RTT, Semihosting, or SWO, to view the
printfoutput. In addition to the port, SWO has other parameters to configure. Be sure that your MCU and firmware are configured accordingly.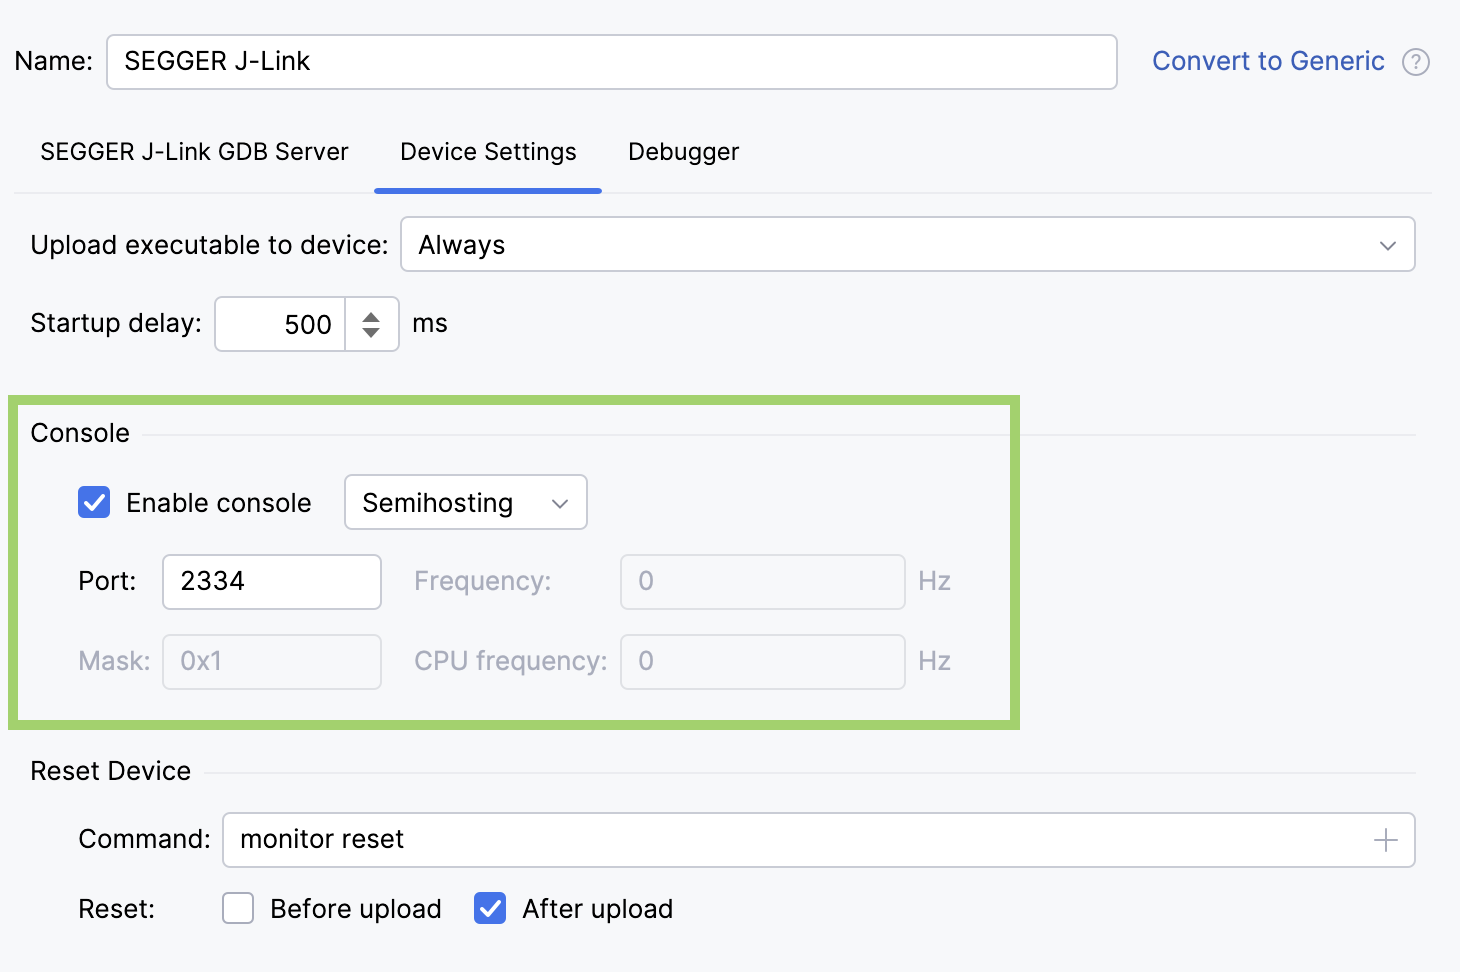
The Debugger tab has a Persistent session option. This option, enabled by default, maintains the connection to the debug server even after the session is closed. You need to specify the port of your GDB server.
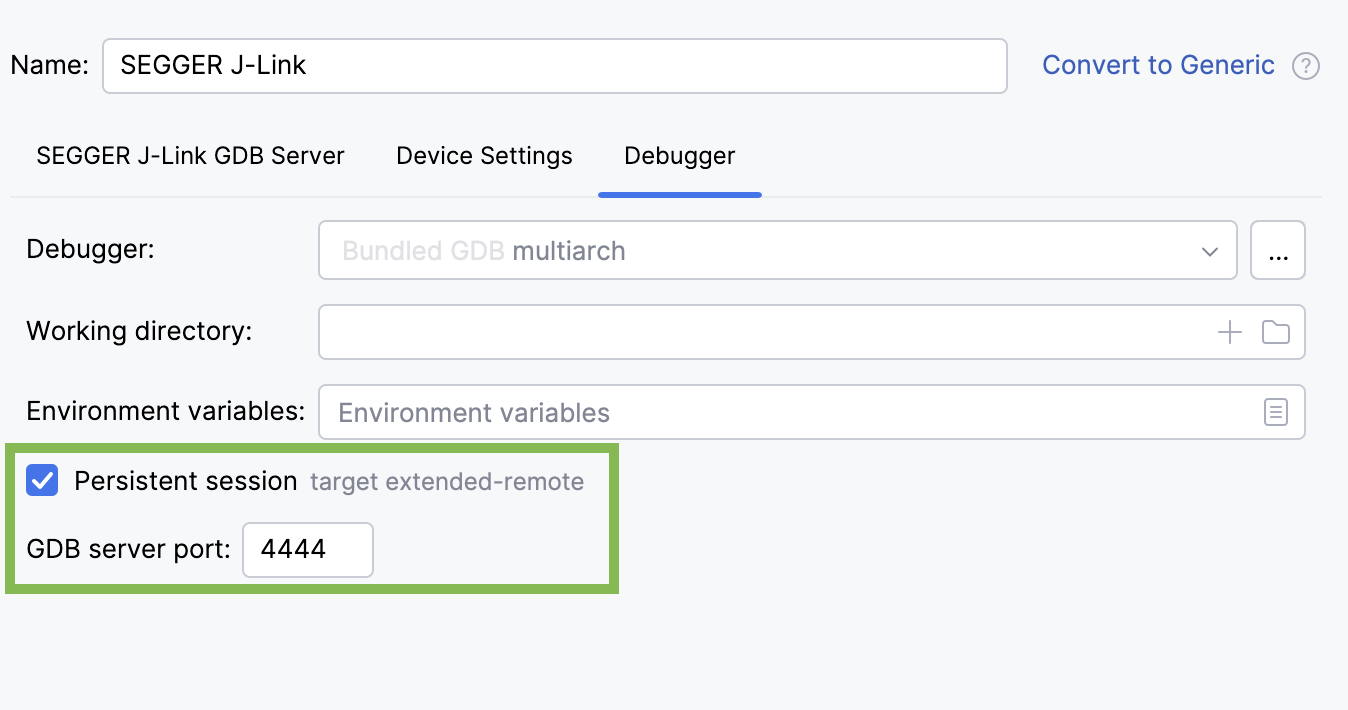
A persistent session is useful when you want a debug server to be ready for the next session without waiting for it to start back up. You can uncheck this option if you don’t need it.
Some important settings to note:
The GDB Server tab does not have default settings, so you need to manually specify all the fields.
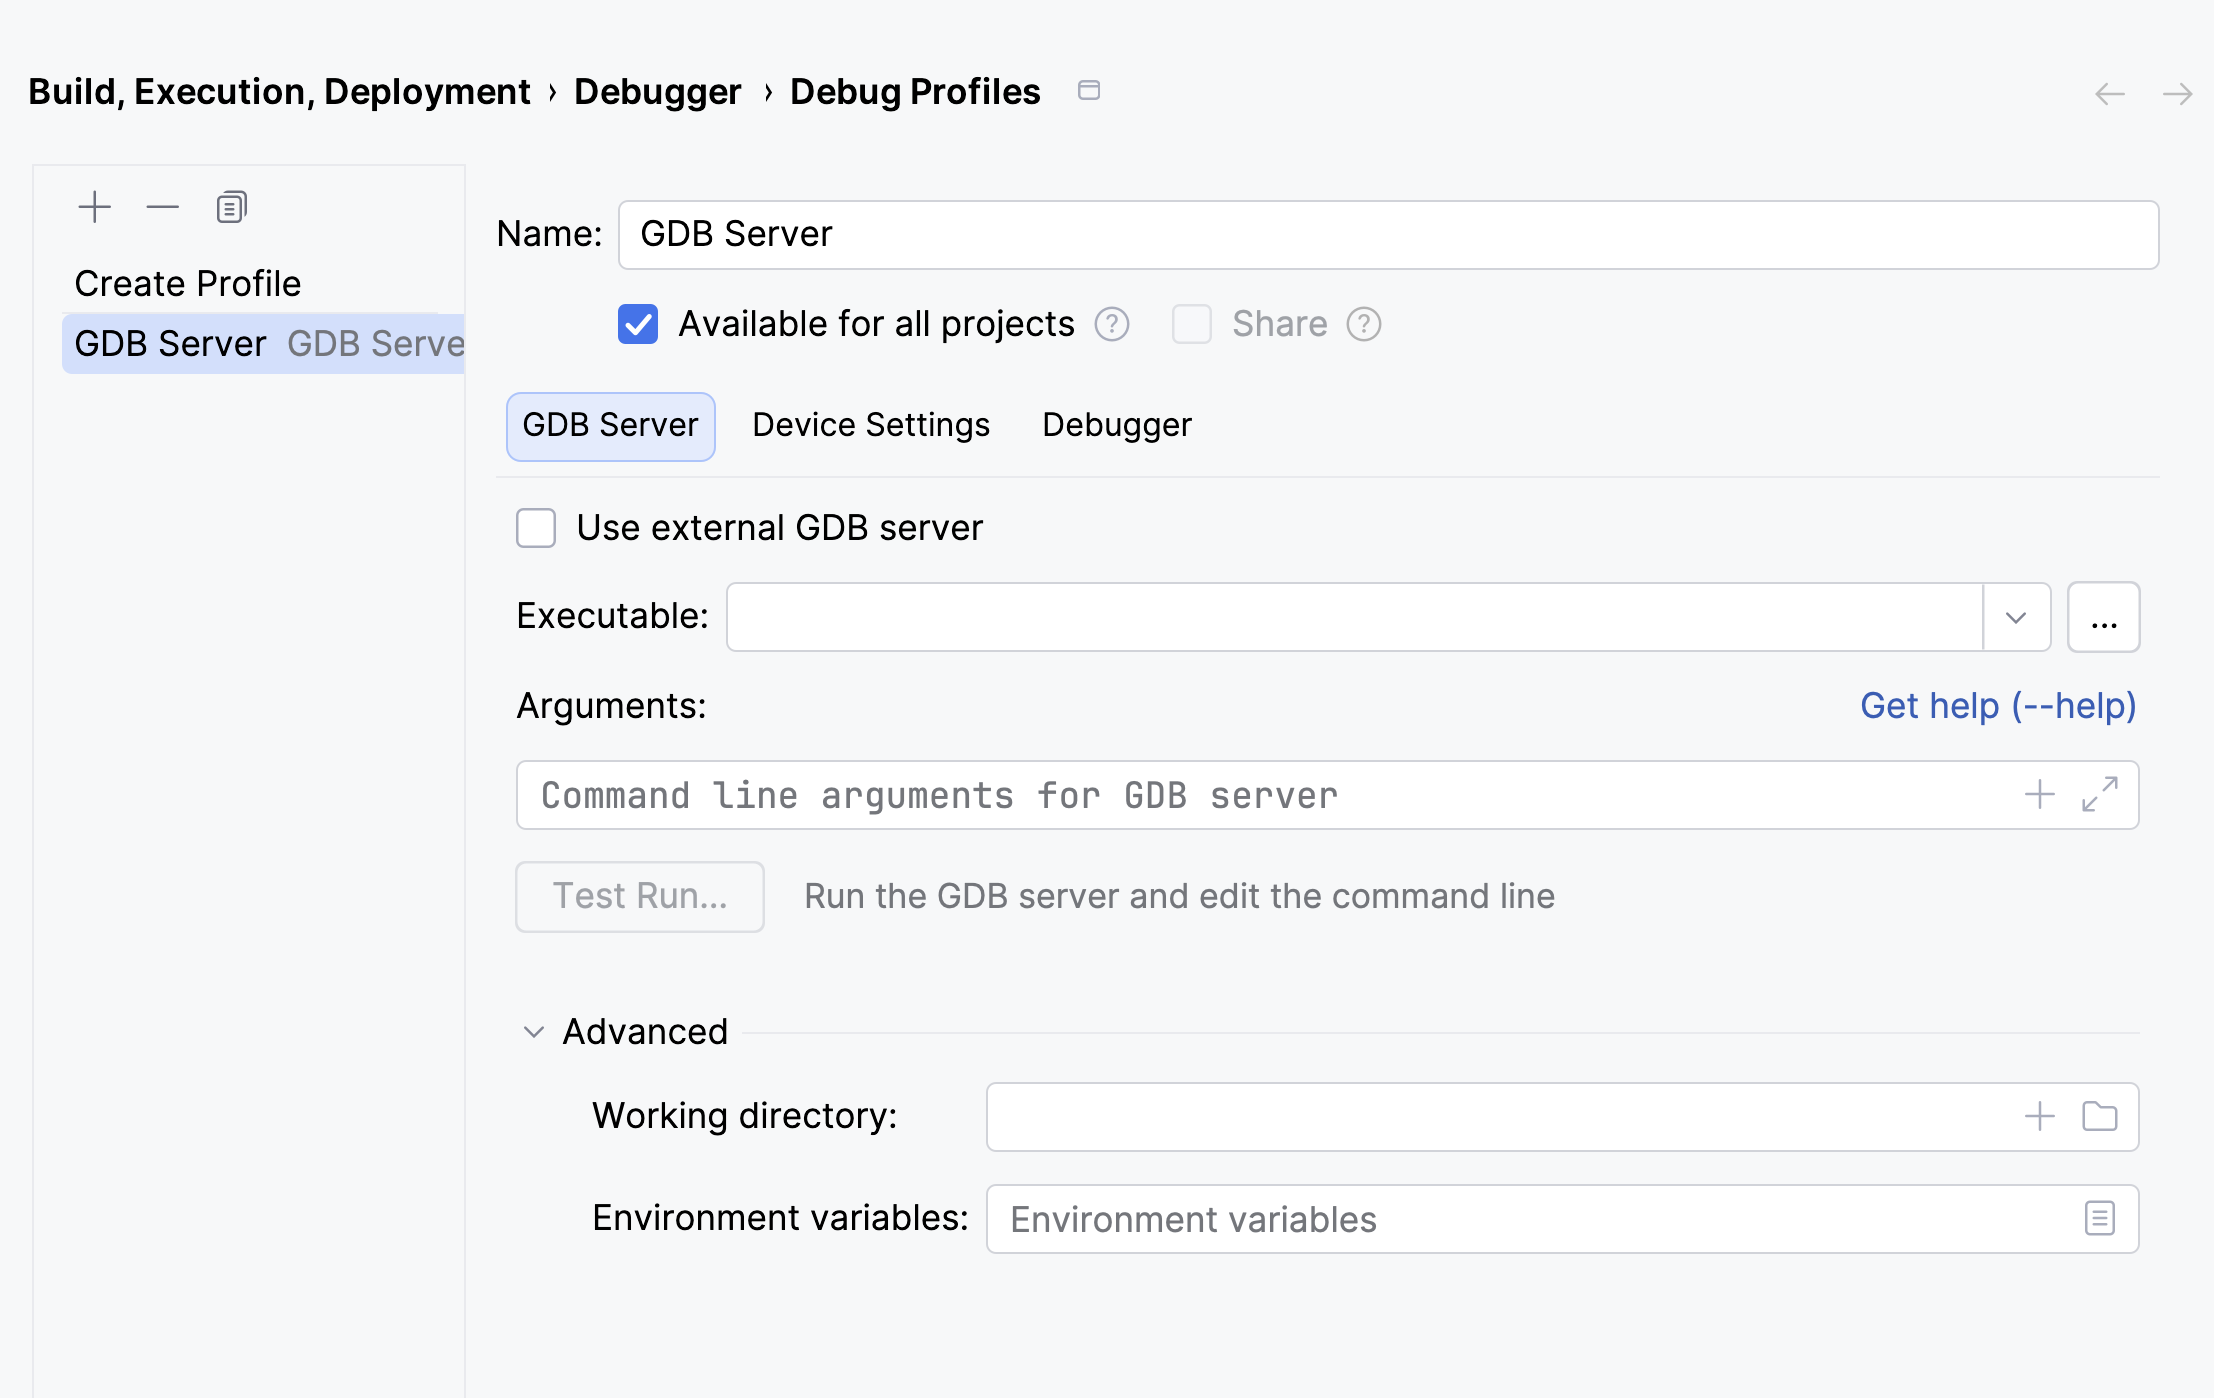
The Help field of the GDB Server tab allows you to run the GDB server with the
--helpcommand-line parameter, view the output directly in this field, and find the available arguments. You can click the arguments highlighted in blue, and they will be automatically added to the Arguments field. Note that this option only works for GDB servers that support the--helpparameter.You can also check your arguments’ validity by clicking Test Run… next to the Arguments field.
The Device Settings tab allows you to specify only a console port. This means you are not limited to a console type and can use any. To configure your console, use the Arguments field of the GDB Server tab.
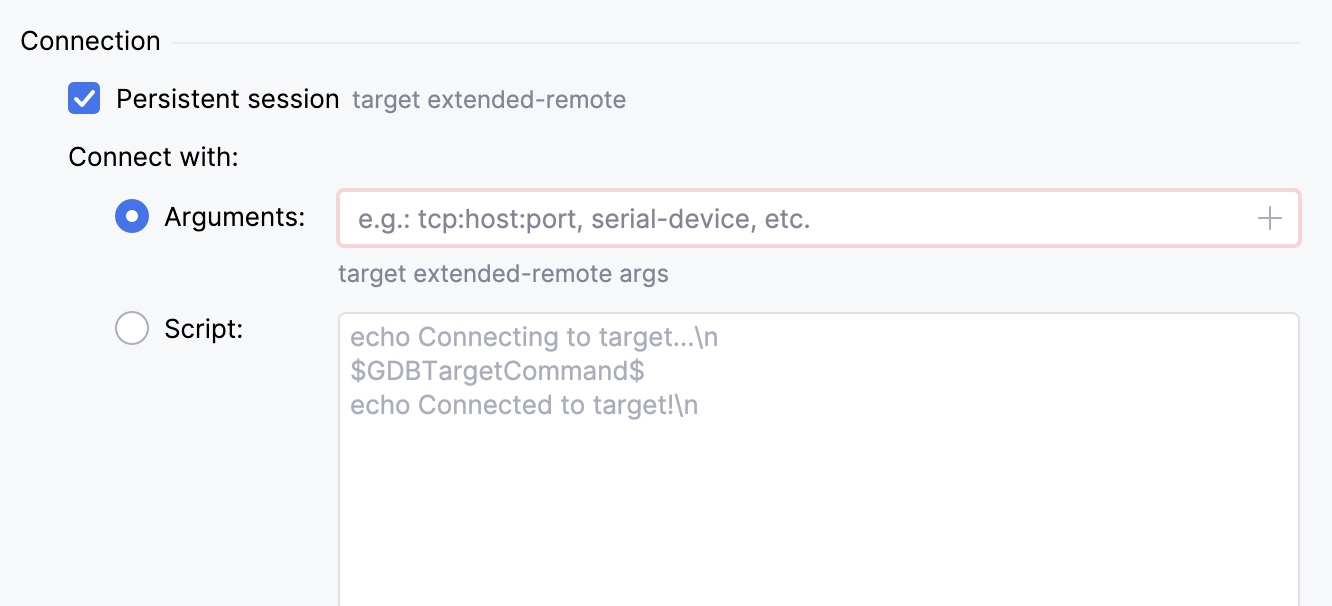
In the Debugger tab, the Persistent session feature has several configuration options. In the Arguments field, you can specify a TCP host, port, and other command-line arguments. You can also create a custom connection script to run when debugging starts.
When you finish configuring the debug server, click OK. The debug-server profile appears in the debug profile switcher on the main toolbar, and you can start debugging.
Sharing a debug server using a VCS
To share a debug-server profile through a version control system such as Git, select the Share option in the profile settings. CLion stores shared profiles in the .idea/debug-profiles.xml file. For more information, refer to Share a debug profile.
Debugging with a debug server
Set breakpoints in the source code.
Select your Run / Debug Configuration from the switcher on the main toolbar:
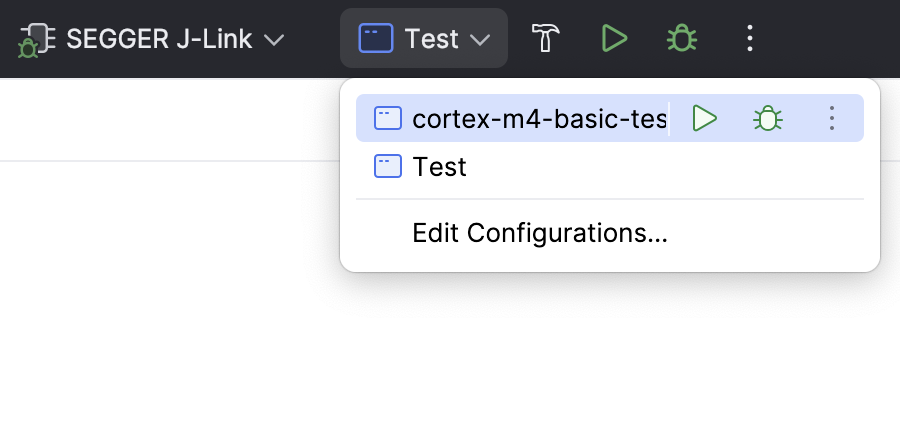
Click
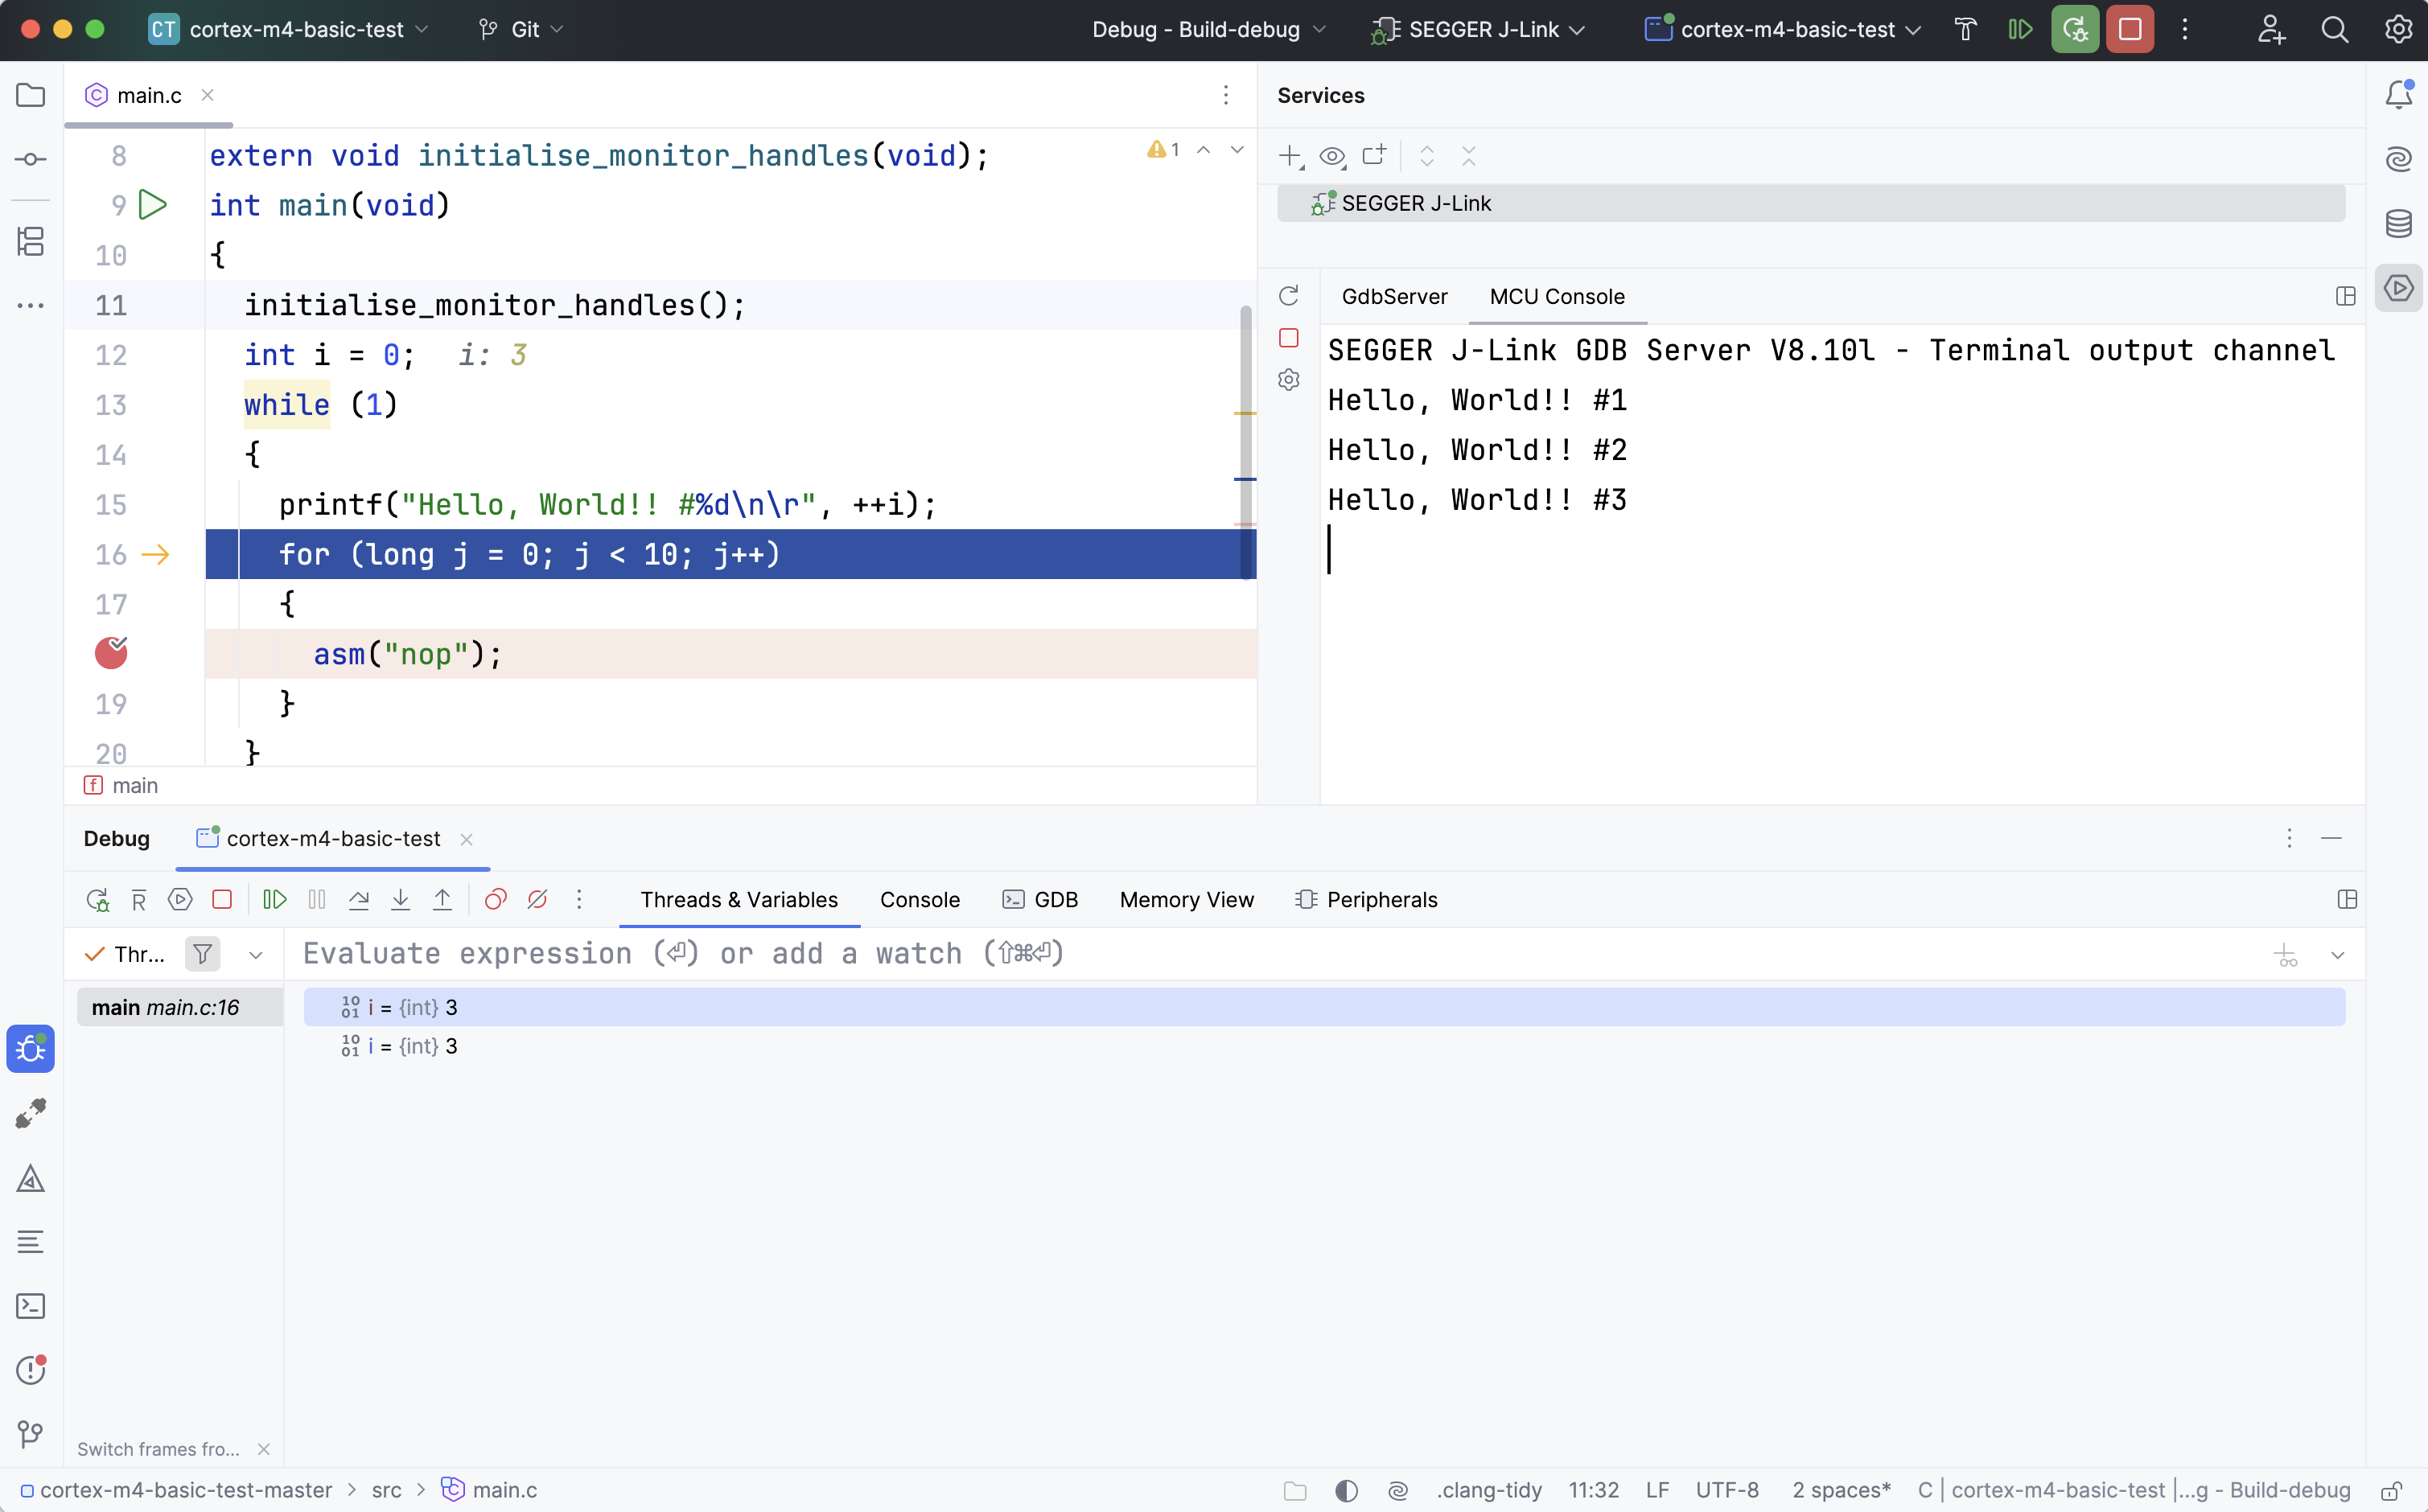
 on the toolbar to start a debug session. The debugger will connect to your debug probe: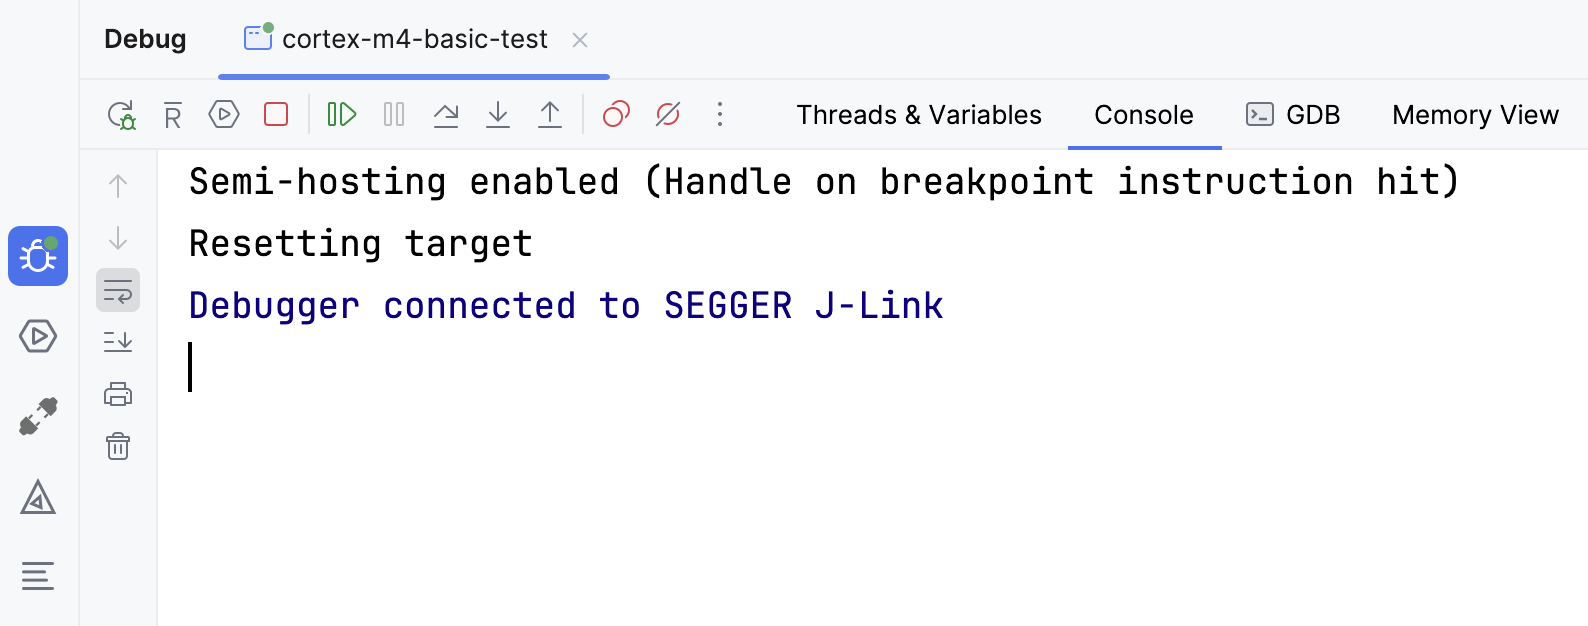
You can then perform available debugger actions and analyze the necessary data. To learn more about the features of the debugger tool window, see its overview.
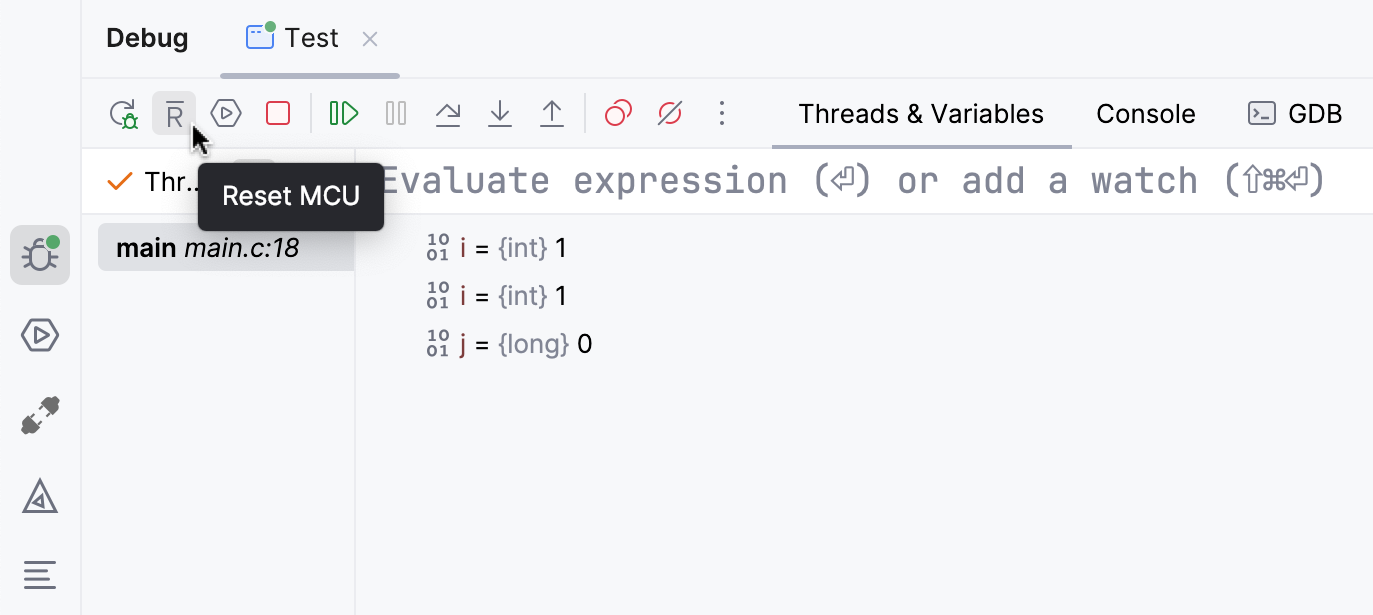
In the Debug tool window, there are some options specifically designed for debugging embedded systems. For example, you can reset your MCU:
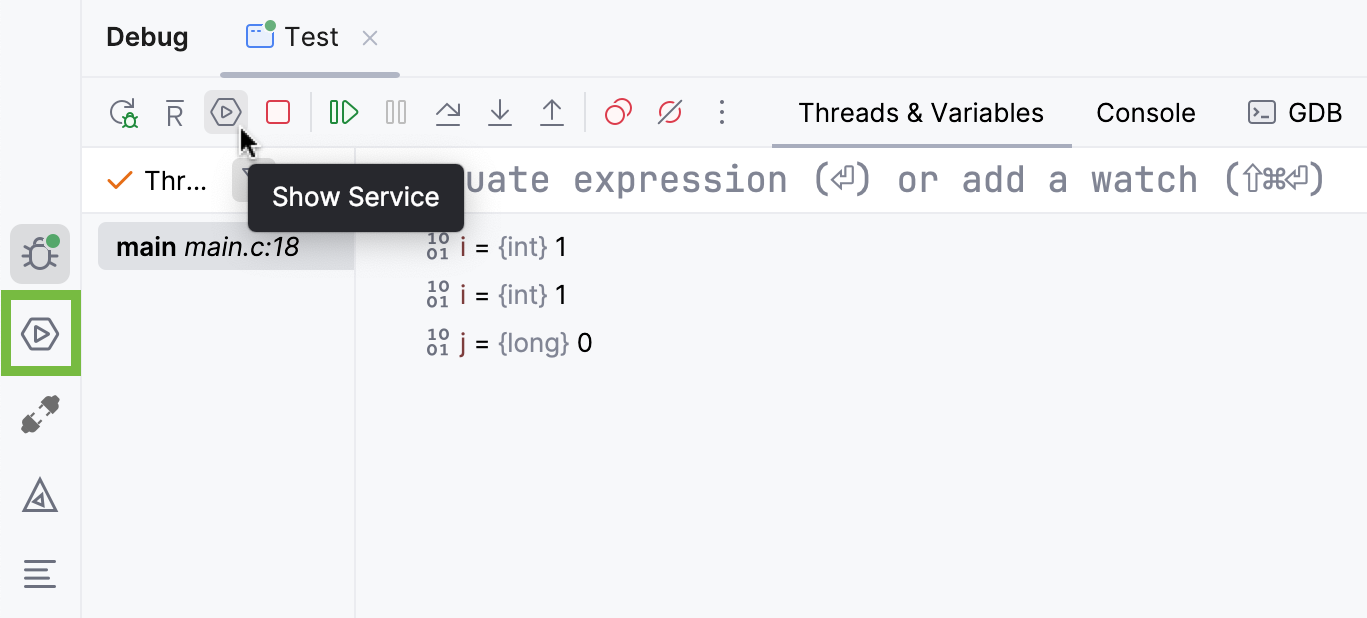
To view debug server logs or console output, click the Show Service icon in the Debug tool window or the Services tool window icon from the left:
Select the GdbServer tab:
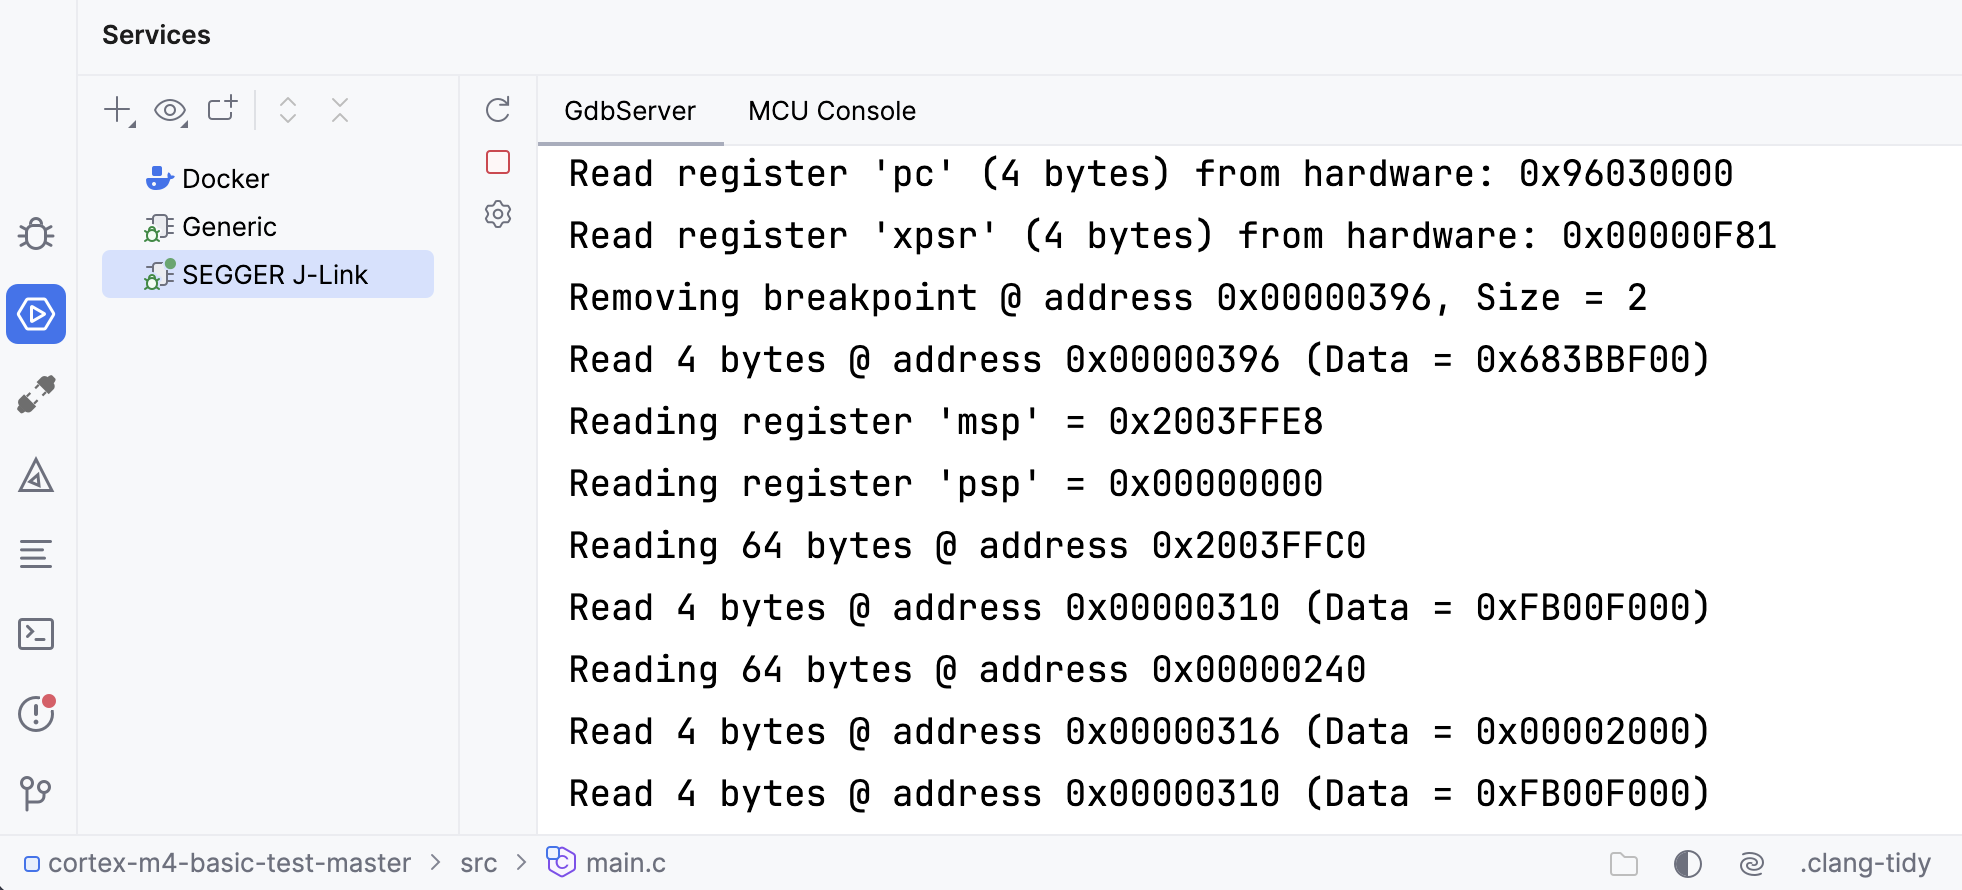
To view the console output, select the MCU Console tab:
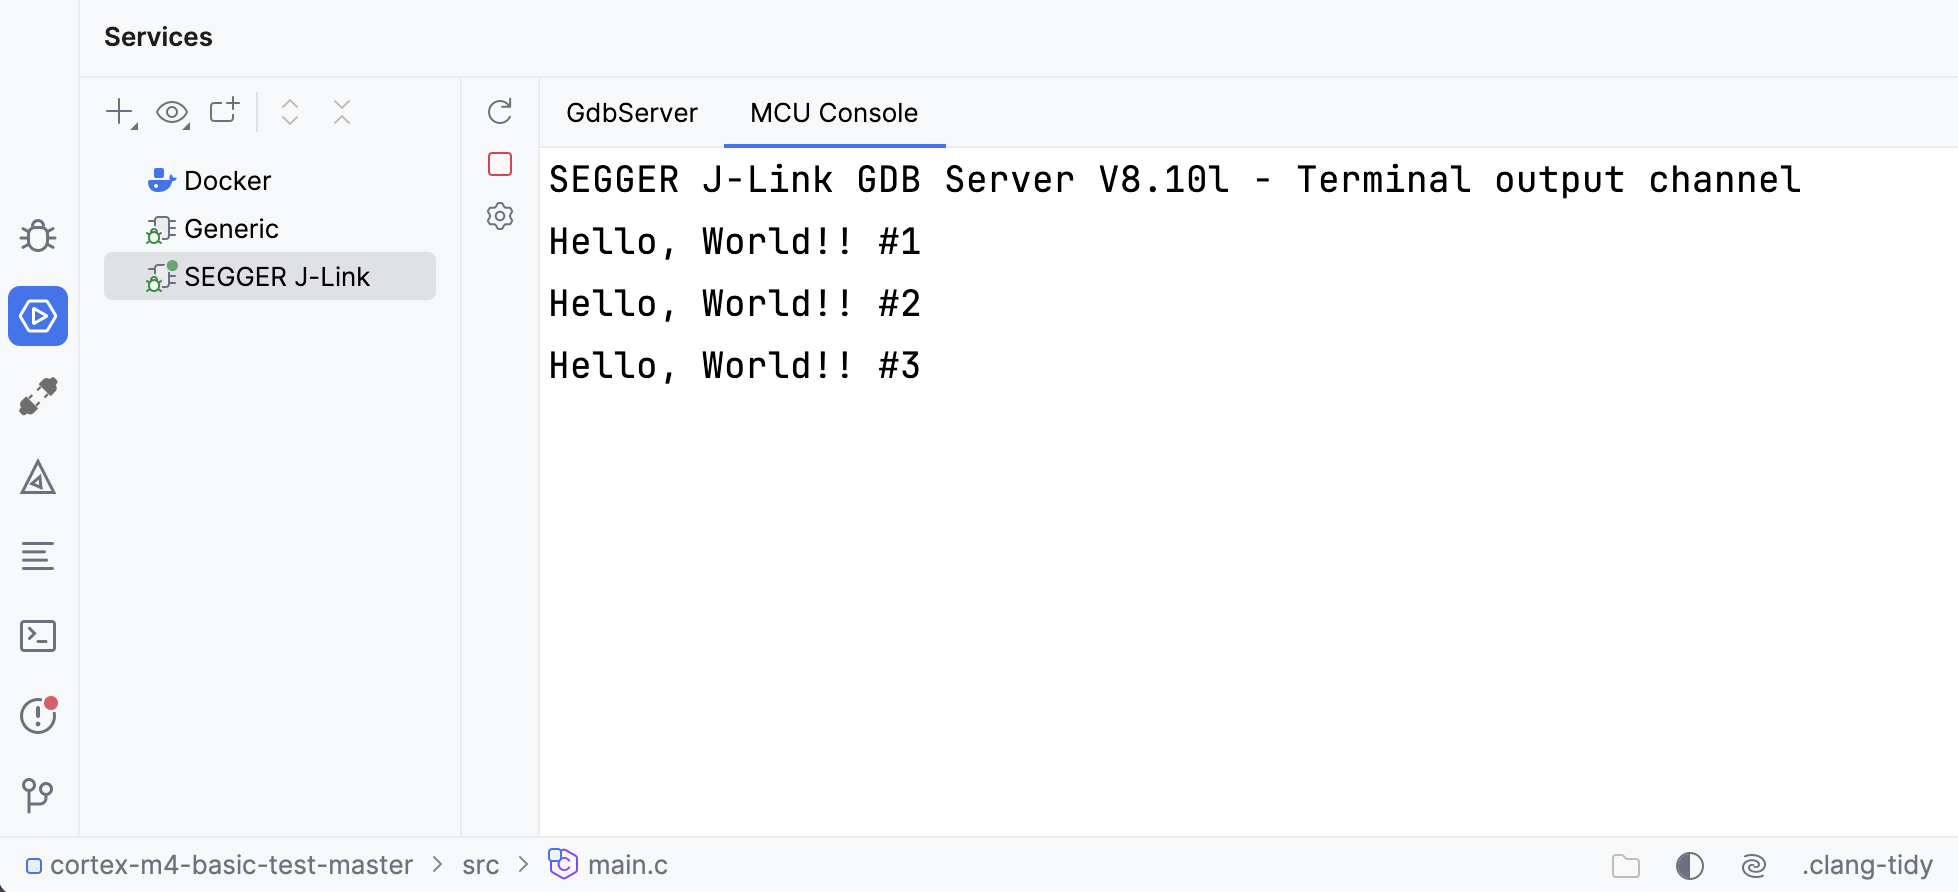
For more convenience, you can move the Services tool window to the right to work with the debugger and see, for example, console output at the same time: