dotPeek features
Decompile .NET assemblies to C# or IL
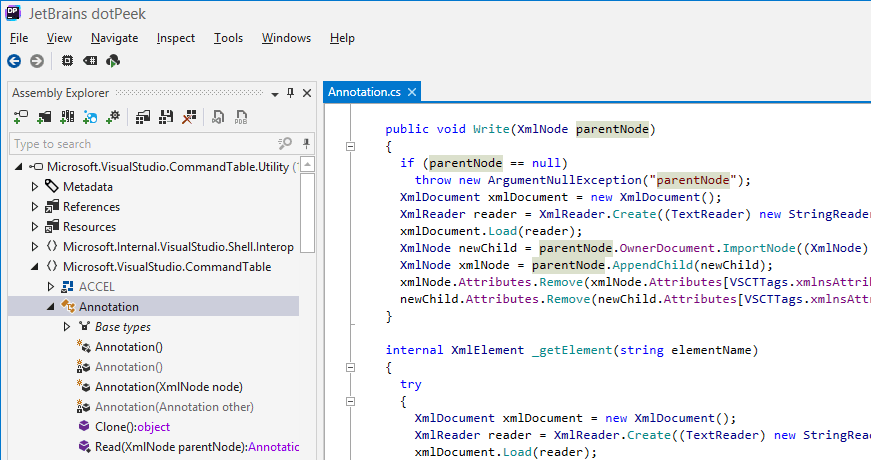
dotPeek can decompile any .NET assemblies into equivalent C# code and optionally show the underlying IL code.
Libraries, executables and more
dotPeek can work with a variety of formats, such as libraries (.dll), executables (.exe), and metadata files (.winmd).
dotPeek can also decompile .baml files, enabling you to reconstruct XAML UI definitions.
In addition to traditional assemblies and executables, you can have dotPeek open archives (.zip, .vsix, or .nupkg) and folders. You can also find and load NuGet packages (and their dependencies) from any online package source, or load packages listed in a packages.config file in your Visual Studio project.
View source code if available
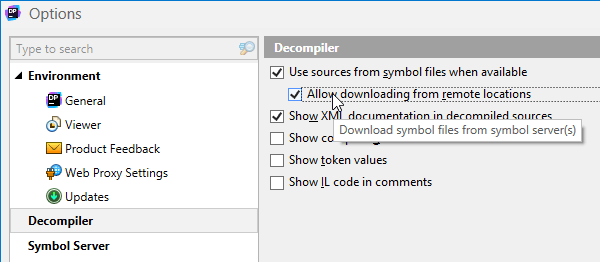
Decompiled code is better than nothing but sometimes you can match an assembly to its source code, so why not take advantage of this? dotPeek can identify local source code based on PDB files, or fetch source code from source servers such as Microsoft Reference Source Center or SymbolSource.org. Moreover, dotPeek can generate PDB files.
Use the navigation mode drop-down in the menu bar to choose whether you only want dotPeek to decompile assemblies, or try find source code if possible.
Show or hide compiler-generated code
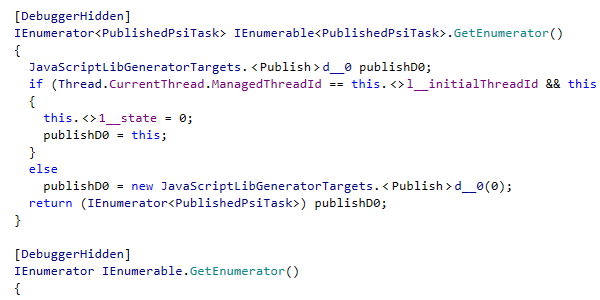
You can choose to show certain compiler transformations, thus making code structure that dotPeek displays very similar to what the compiler turns it to. This helps see how compiler deals with lambdas, closures, and auto-properties, among other things.

Explore running processes
The Process Explorer window shows the list of all currently running processes and allows exploring their modules and decompiling those of them that are .NET assemblies. You can choose to show or hide native processes and modules, or turn on process hierarchy view.
Filter the list to find a module or process that you're looking for, and then add its assemblies to Assembly Explorer for further investigation.

View IL code in a separate view
Whenever you want to dive deeper than source code, you can navigate to IL code from any point in decompiled C#.
The easiest way to do this is to show IL code in a separate tool window that is synchronized with the main code viewer.
dotPeek can display IL code both for decompiled code and for source code reproduced from symbol files.

View IL code as comments to decompiled C#
Alternatively, you can opt to show IL code as comments to decompiled C# code, which effectively merges its default text viewer and the normally separate IL Viewer window, all in one view.

Use your preferred color theme
dotPeek supports the same set of color themes as Visual Studio does.
For example, you can select Blue or Dark theme, or choose to synchronize your color scheme preference with Visual Studio settings.
Navigate decompiled code in different ways
As dotPeek is based on ReSharper's powerful code insight architecture, it lets you navigate decompiled assemblies in a contextual or context-insensitive ways, get a quick summary what's inside each decompiled file, set bookmarks and explore inheritance chains.
Find usages of any symbol
With dotPeek, you have several options to search where code symbols are referenced.
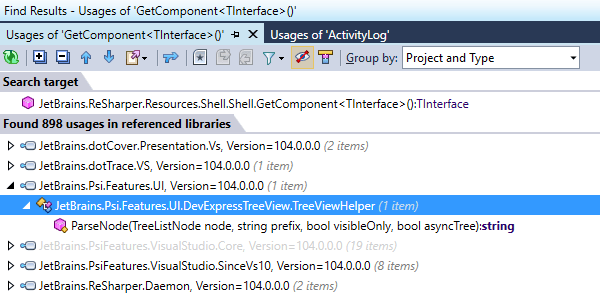
Invoke Find Usages to find all usages of a symbol (such as a method or property) across all loaded assemblies. The usages will be displayed in the Find Results tool window where you can group them, navigate between them, and open in the code view area.
There's also Find Usages Advanced, which is a more detailed version of Find Usages that helps you fine-tune search criteria by limiting the scope of search and other details.
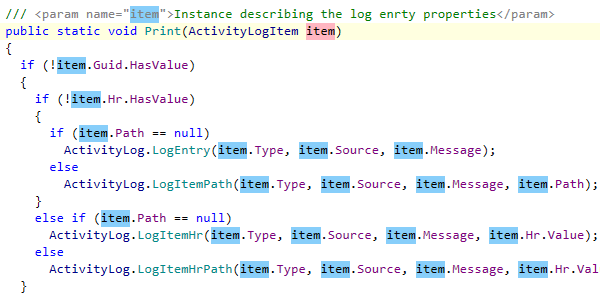
Highlight usages in code viewer
dotPeek automatically highlights all visible usages of the symbol under caret, very similar to how recent versions of Visual Studio do it. This helps improve readability of decompiled code, especially when you're dealing with obfuscated identifiers.
In addition, if you want to go through all usages in file, whether or not they're currently visible, use Highlight Usages in File. This will highlight all usages of a given symbol in the current file, with two distinct colors indicating write and read usages.
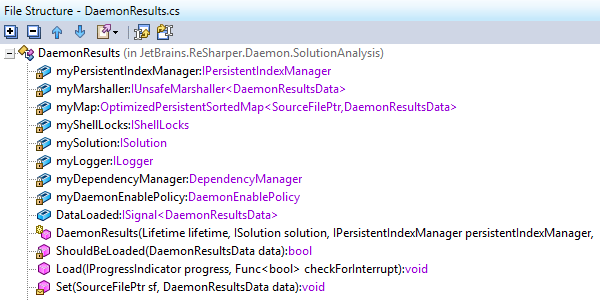
Explore current document
Use Go to File Member for a quick overview of and navigation to members in a document representing a decompiled type. Enter parts of member names, and navigate directly to them.
Alternatively, if you'd like a static display of members in the current document, open and dock the File Structure tool window. You can filter this view as well: select the tool window, and just start typing characters to only focus on type members that you're interested in.
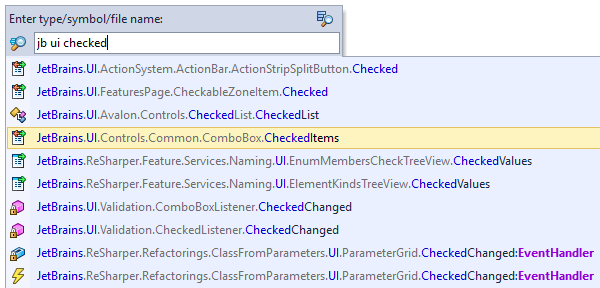
Jump to any code
By indexing all assemblies in your assembly list, as well as all their references, dotPeek provides two features to quickly jump to specific code:
- Go to Symbol helps navigate to a specific symbol declaration, which could be a type, method, field, or property. Use lowerCamelHumps syntax to locate types — for example, enter xmard to locate and open XamlMarkupDeclaredElement.
- Go to Everything allows searching for an assembly, namespace, type, member, or a recently opened file.
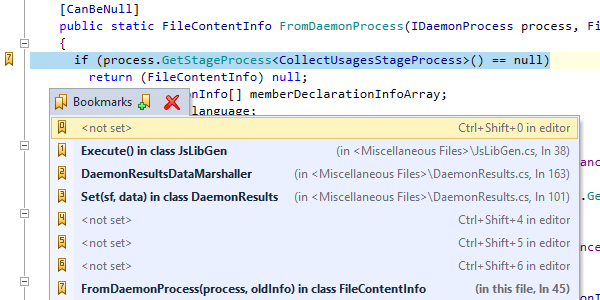
Set bookmarks
If there are lines of decompiled code that you feel are important and you want to go back to them later, feel free to set bookmarks.
Just drop a numbered marker with a shortcut, and jump back at any time with another shortcut. You can create up to 10 numbered bookmarks, and unlimited unnumbered bookmarks. The full list of bookmarked locations is displayed in a single pop-up window.
Navigate contextually
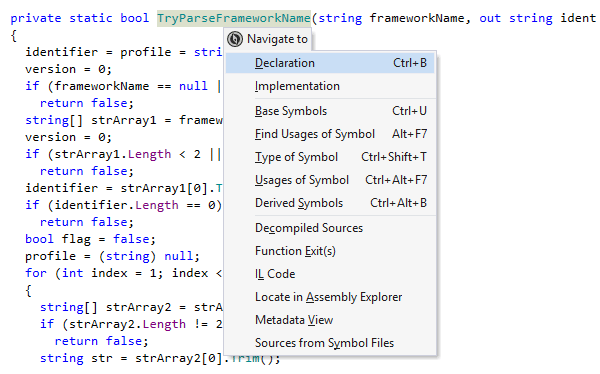
Whenever you put a caret on a symbol in the code view area, dotPeek offers a plethora of contextual navigation options that are all available via Navigate To drop-down menu.
For example, Go to Declaration takes you from a usage of any symbol to its declaration. If the symbol is declared on another assembly, the assembly is loaded automatically.
Go to Implementation helps navigate to end implementations of types and type members, bypassing intermediate inheritance steps in the inheritance chain, such as abstract classes.
Other useful contextual navigation options include Go to Base Symbols and Go to Extension Methods.
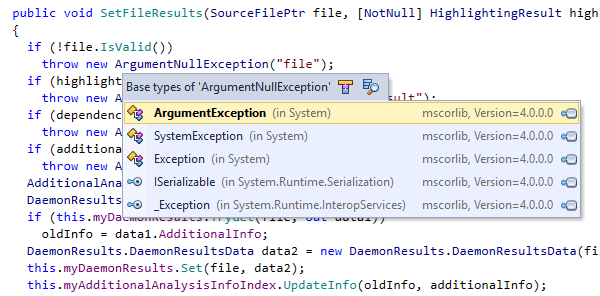
Navigate class hierarchies
If you're interested to navigate up and down an inheritance hierarchy from a specific type or type member, consider using Go to Base Symbols and Go to Derived Symbols.
These are extremely useful when you want to go to an inheritor or a base symbol right away.
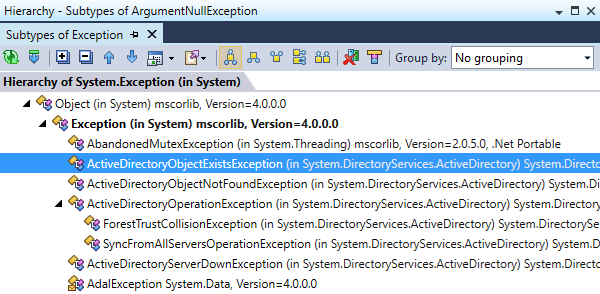
Explore inheritance chains
If you're looking to get a visual summary of a certain inheritance chain, use Type Hierarchy.
dotPeek will show you all types that are inherited from the selected type, as well as types that it inherits itself — as a tree view, in a separate tool window.
Make sense of assemblies
dotPeek provides tools to quickly grasp the structure of any given assembly, understand relationships between assemblies, as well as organize assemblies into discrete lists, which helps only focus on assemblies that you're interested for your current assignment.
Manage assembly lists
You can work with different assembly lists depending on your context. You can save and reopen assembly lists, and clear the current list if you no longer need it. Assembly lists are not limited to .dll and .exe files: they can also contain NuGet packages, archives, and folders.
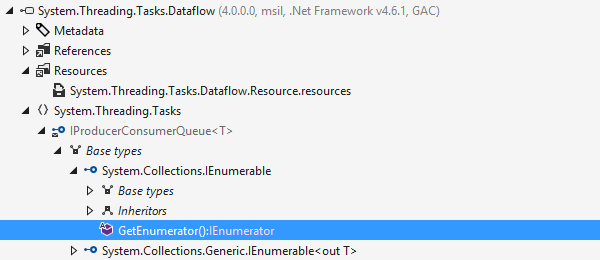
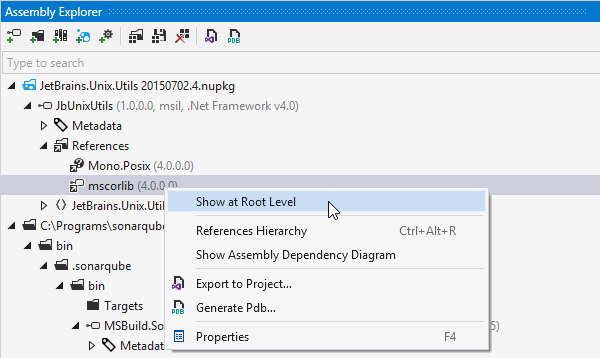
Explore assembly contents
When you're working with an assembly list, the Assembly Explorer shows what kind of references, resources, and code a particular assembly has, all the way from namespaces to type members.
For each type, it highlights nodes representing its base types and inheritors — in addition to the actual list of members. Quick search and node filtering using lowerCamelHumps are supported as well.
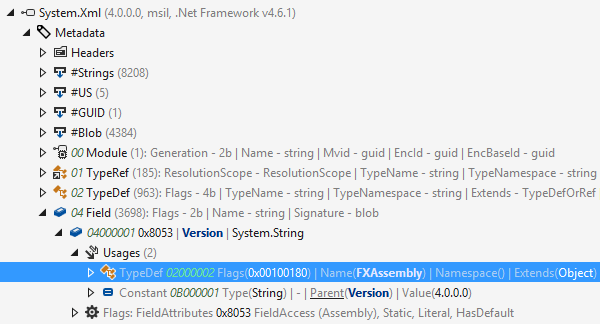
Explore assembly metadata
dotPeek also helps you explore assembly metadata and dig through all items (tables, blobs, strings, etc.) inside it. Under the Metadata node, you can explore values of blob items, PE file headers, usages of metadata table items.
Same as elsewhere in the assembly tree, you can double-click metadata items to decompile and display the corresponding code.
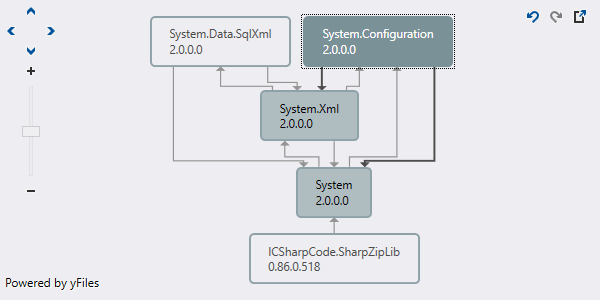
View dependencies between assemblies
If you want to know how assemblies are dependent on each other, you can select several assemblies in the Assembly Explorer and tell dotPeek to display an assembly dependency diagram.
This will visualize any relationships that exist between the selected assemblies by virtue of their references.