What′s New in dotCover
This page guides you through updates in recent dotCover versions. Highlights include more options for code coverage highlighting, continuous testing for a lot faster unit test feedback, support for Visual Studio / JetBrains Rider and .NET Core.
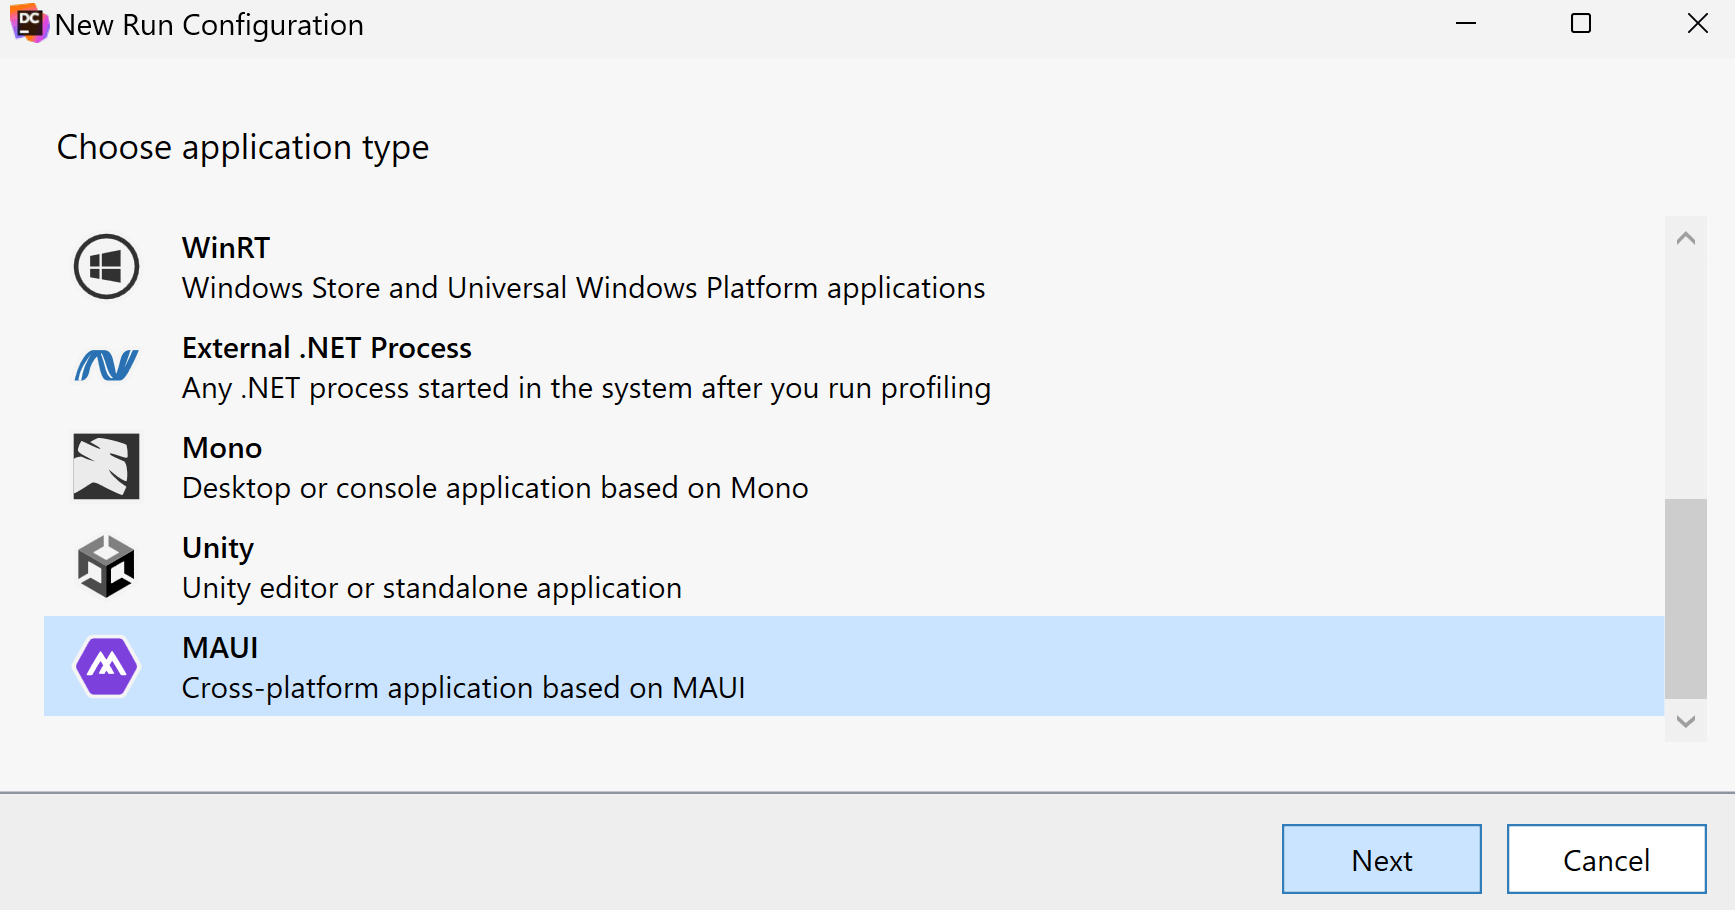
Support for MAUI applications 2024.1
Now, you can perform coverage analysis of unit tests and applications based on the MAUI framework. Currently, dotCover supports only WinUI desktop applications targeting .NET 7.0+ on Windows. This applies to dotCover standalone and dotCover in ReSharper and Rider.
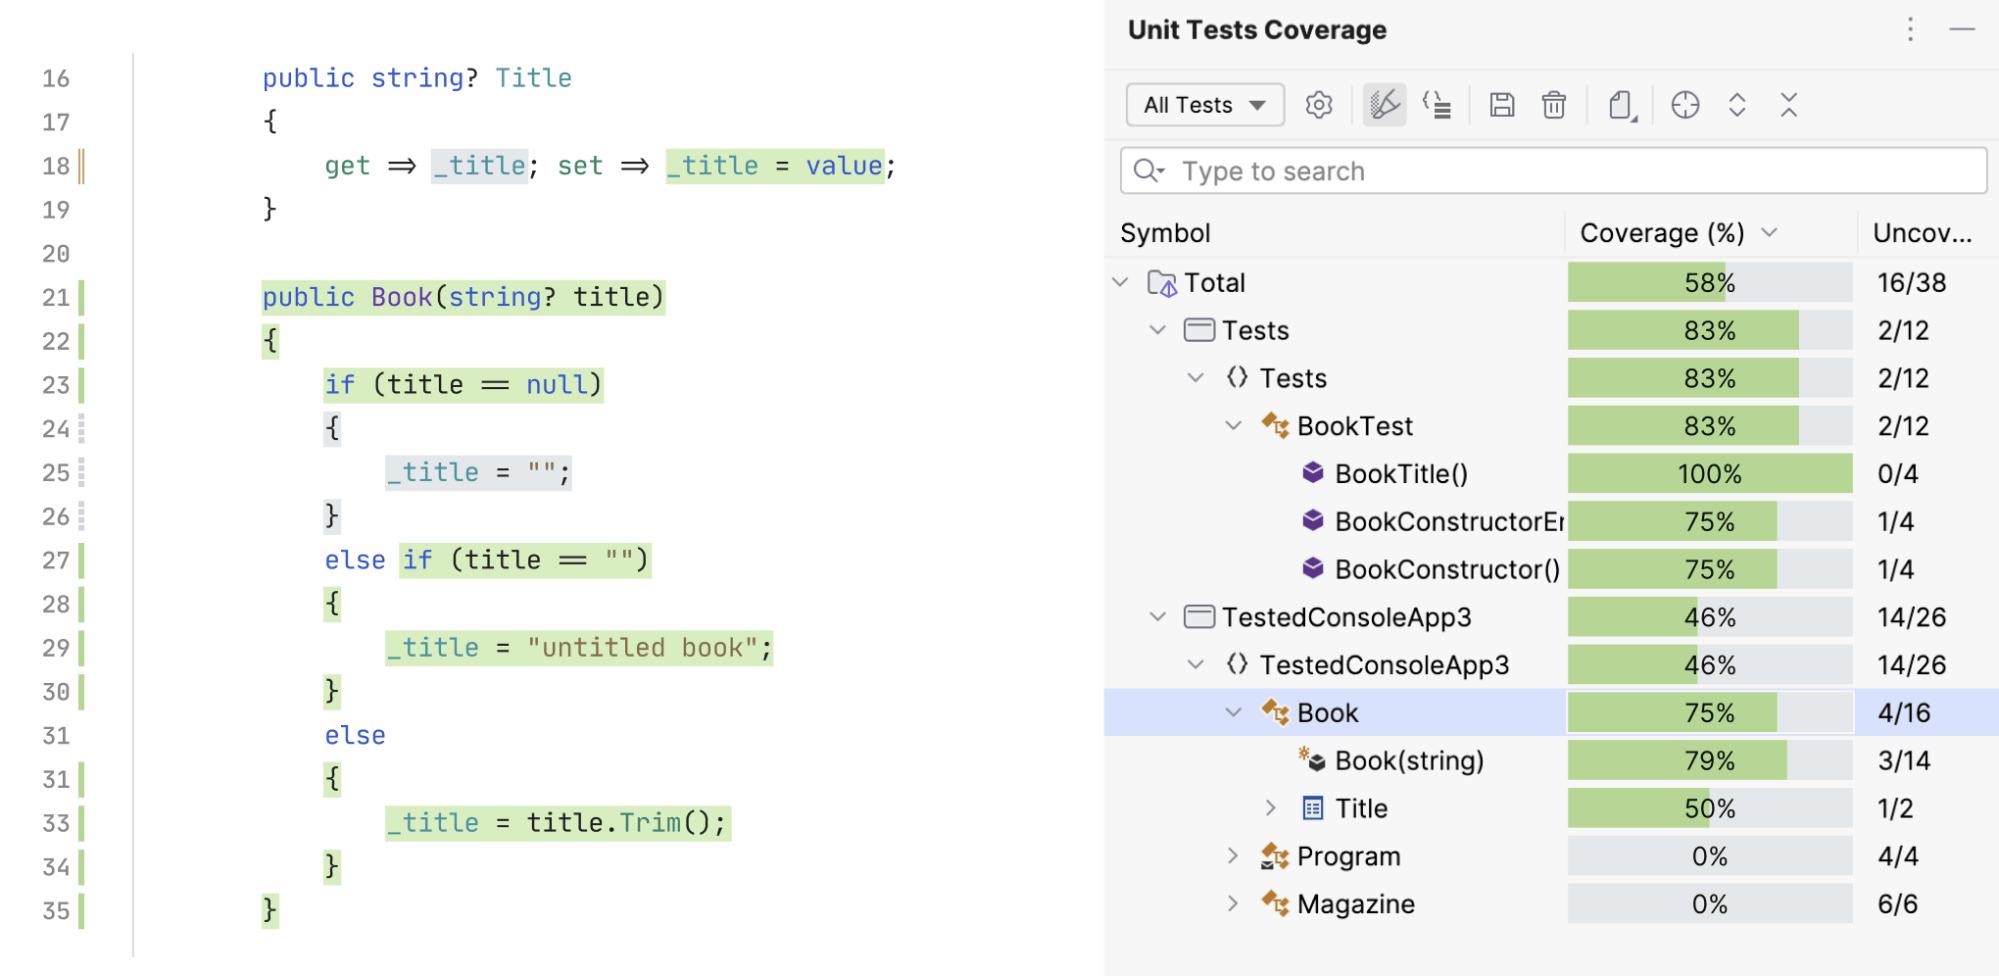
Improved coverage highlighting 2024.1
dotCover in Rider and ReSharper gets improved code highlighting: new background colors, a new gutter icon for partially covered code lines, and other minor changes.

Improved command-line tools 2023.3
dotCover command-line tools are now provided as a cross-platform framework-dependent .NET tool.
This tool acts as a default solution for CI/CD scenarios and replaces the previous one.
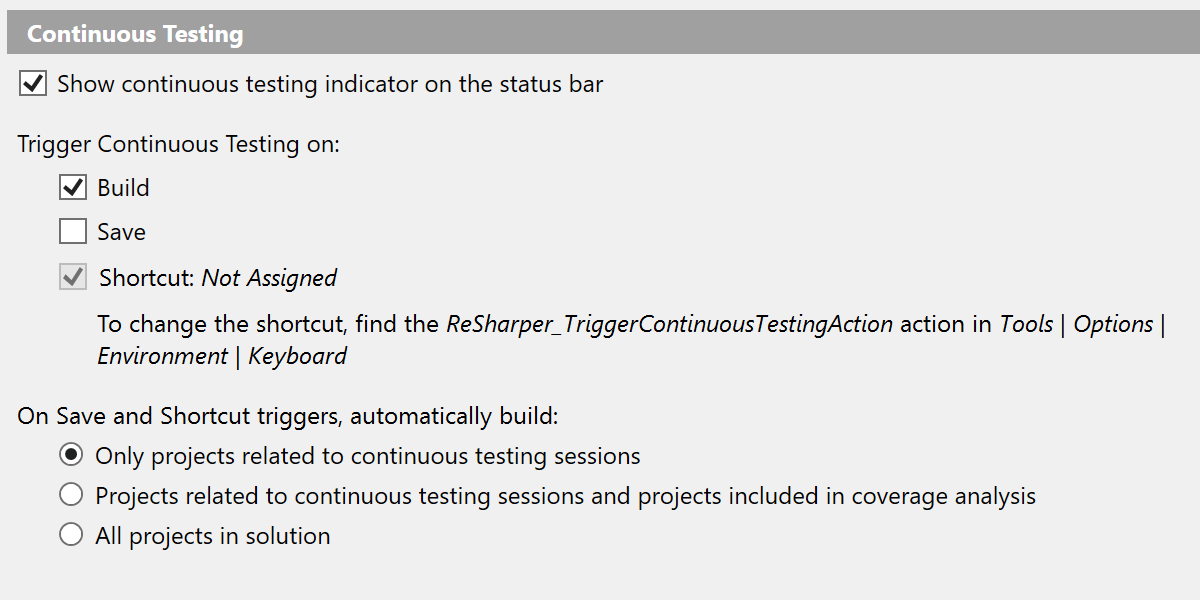
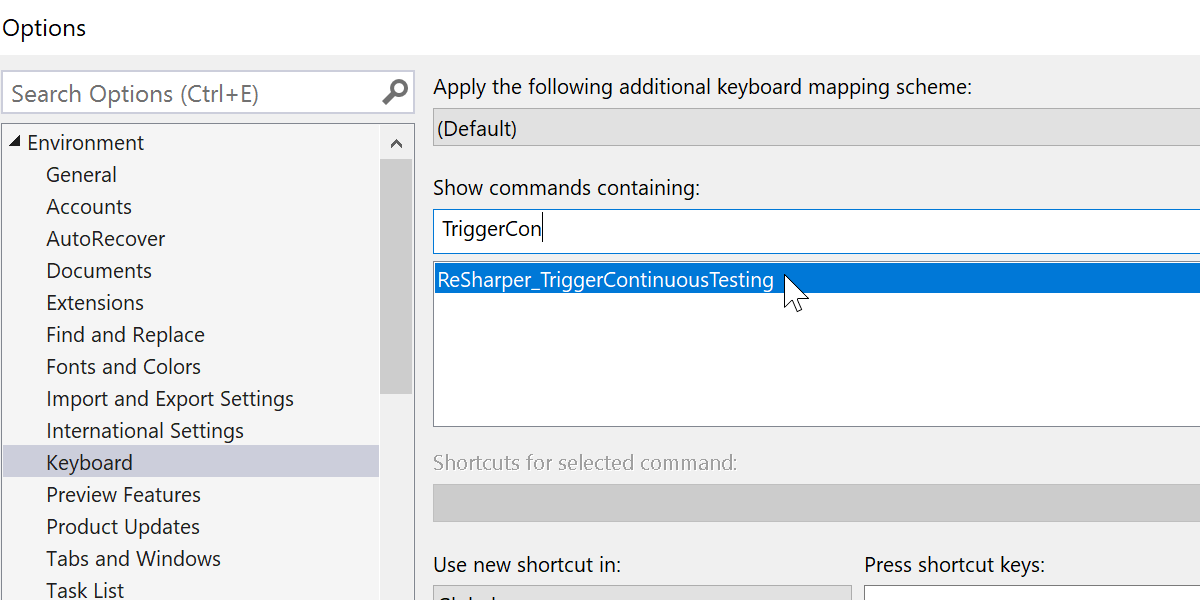
Shortcut for Continuous Testing 2023.1
Now, it's possible to trigger Continuous Testing directly by applying a shortcut. Previously, you could do this only indirectly by building or saving your project. This feature works in both Visual Studio with ReSharper and JetBrains Rider.
Support for Windows ARM64 2022.3
Now, you can use dotCover on ARM64 CPUs on Windows. This applies to all versions: dotCover standalone, dotCover in Rider, dotCover in Visual Studio, and the dotCover console runner.
Support for Linux ARM32 2022.3
You can now use the dotCover console runner on ARM32 CPUs on Linux. The supported frameworks are .NET Core 3.1 and .NET 5.0–7.0.
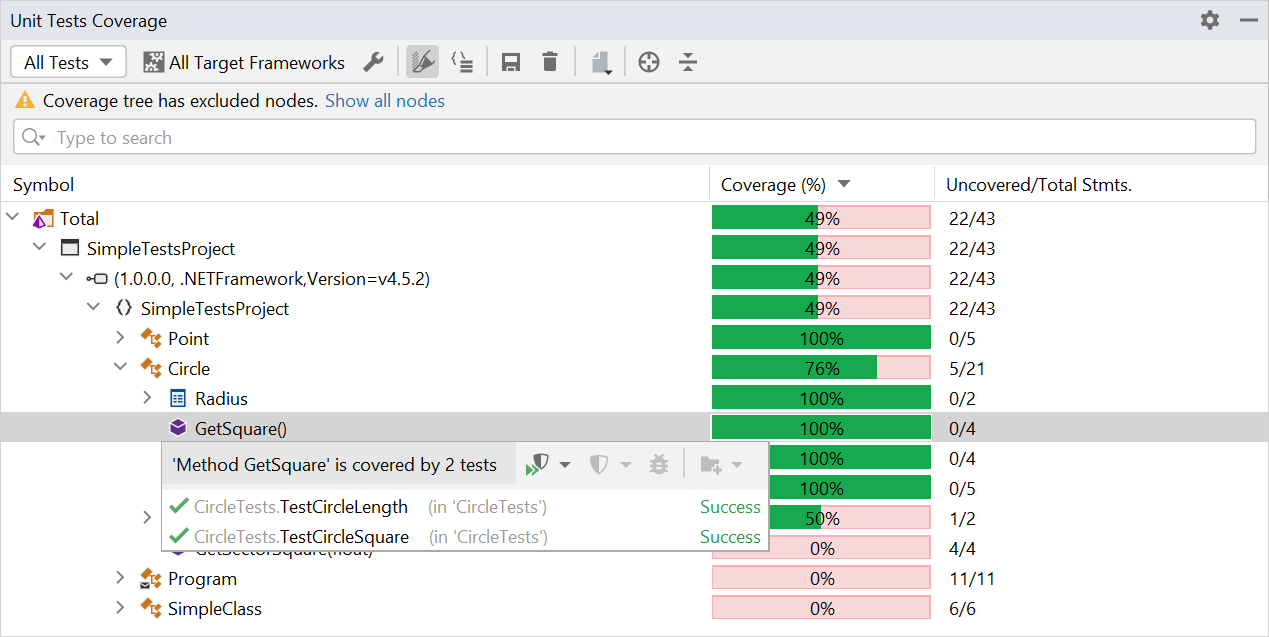
Easier navigation to tests in JetBrains Rider 2022.3
We’ve added the Show Covering Tests action to the dotCover context menus in both the code editor and Unit Test Coverage window. This action shows a popup with all covering tests together in the same place. The popup also lets you create a new coverage session.
Faster shadow copying 2022.3
Now dotCover copies only the assemblies and symbol files required for continuous testing in both Visual Studio and JetBrains Rider. This improves dotCover’s overall performance, especially on large projects, as it no longer needs to copy the entire working directory. If necessary, you can adjust the shadow-copy file filter in the dotCover settings.
Improved Unity support in JetBrains Rider 2022.3
Previously, to analyze the coverage of Unity tests you had to restart Unity with coverage support enabled. Beginning with this release, restarting Unity is no longer required and test coverage is supported out of the box.
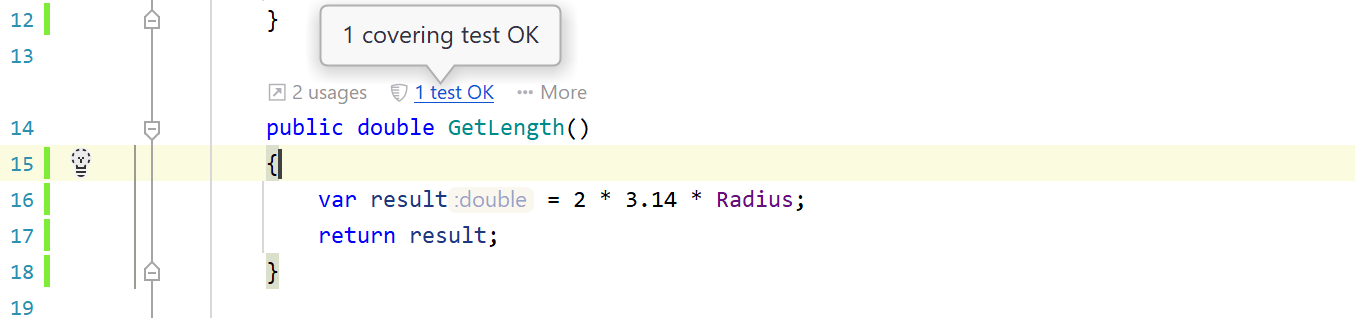
Quick view of coverage results in JetBrains Rider 2022.2
You can now quickly view coverage results for the file you have open using the shield icon. Clicking on the icon navigates you through the uncovered statements.
Support for musl-based Linux distributions 2022.1
The dotCover command-line runner now supports Alpine versions 3.13–3.15. The following CPUs and frameworks are supported:
- x64: .NET Core 3.1, .NET 5.0–6.0.
- arm64: .NET 5.0–6.0.
New coverage report types 2022.1
We’re adding new report types that include per-test coverage information:
FileCoverageXml,
DetailedFileCoverageXml,
FileCoverageJson, and
DetailedFileCoverageJson.
New reports include three sections:
-
Files, which includes information about covered source code files. Detailed reports also provide information about covered ranges per file. -
TestLists, which offers information about tests aggregated by test set. -
Tests, which contains detailed information about each test.
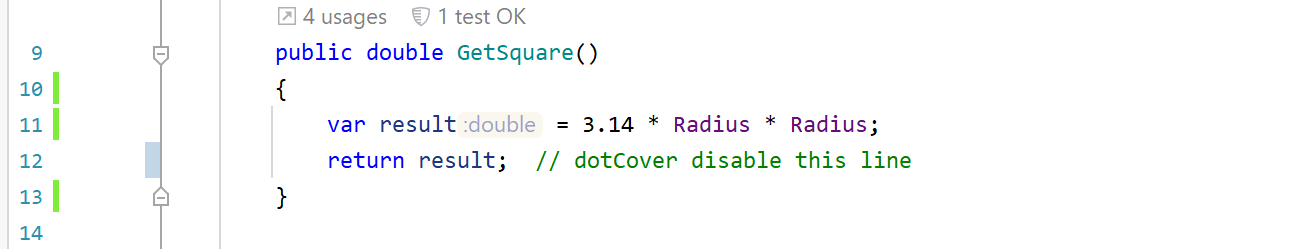
Excluding code from coverage analysis using comments 2022.1
You can now use comments to exclude certain lines or blocks of code from coverage analysis. Several options are available for this:
// dotcover disable
var i = 1;
var j = 10;
// dotcover enable
/* dotcover disable */ var i = 1; /* dotcover enable */
var i = 1; // dotCover disable this line
// dotcover disable next line
var j = 100;
For any of these options to work, you must reference the
JetBrains.dotCover.MSBuild NuGet package. This is a development-only
dependency that won't be included as a run-time dependency in your project.
Performance improvements 2022.1
We’ve improved the post-processing of coverage data. For example, the console
runner (with IncludePerTest=true) takes significantly less time
to generate reports.
Support for Apple silicon processors 2021.3
The dotCover command-line runner now works on computers with Apple silicon processors. It can provide coverage analysis for .NET 6 applications (native mode) and .NET 5 applications (Rosetta 2 mode).
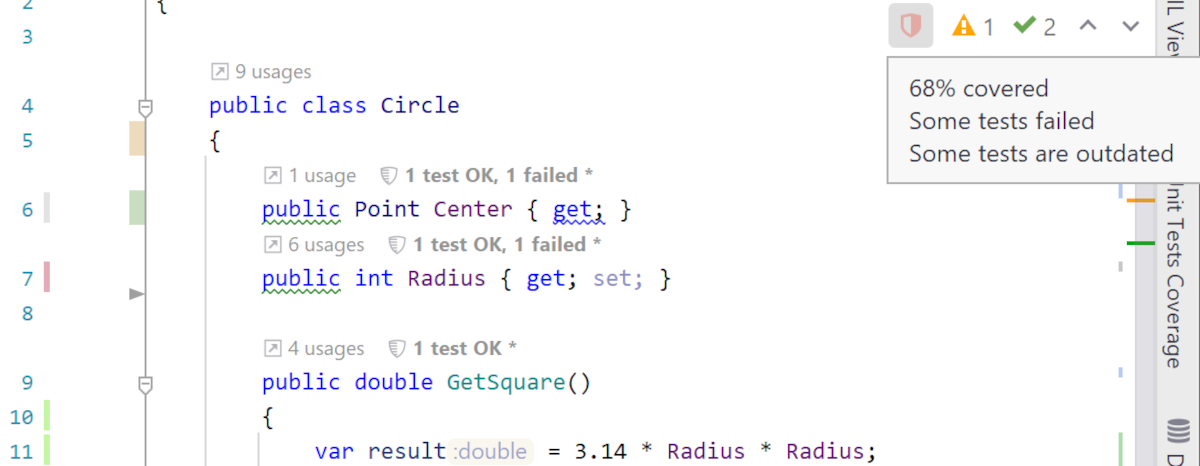
Code Vision metric for code coverage 2021.3
A new Code Vision metric has been added to dotCover in Rider. For each type member included in a set of tests, dotCover shows the number of successful and failed tests. You can also use a Code Vision notification to run, cover, and debug the tests.
Improved dotCover .NET global tool 2021.3
The dotCover .NET global tool now includes the merge and report commands.
Performance improvements 2021.3
We’ve improved the performance of the dotCover command-line runner, resulting in faster coverage analysis.
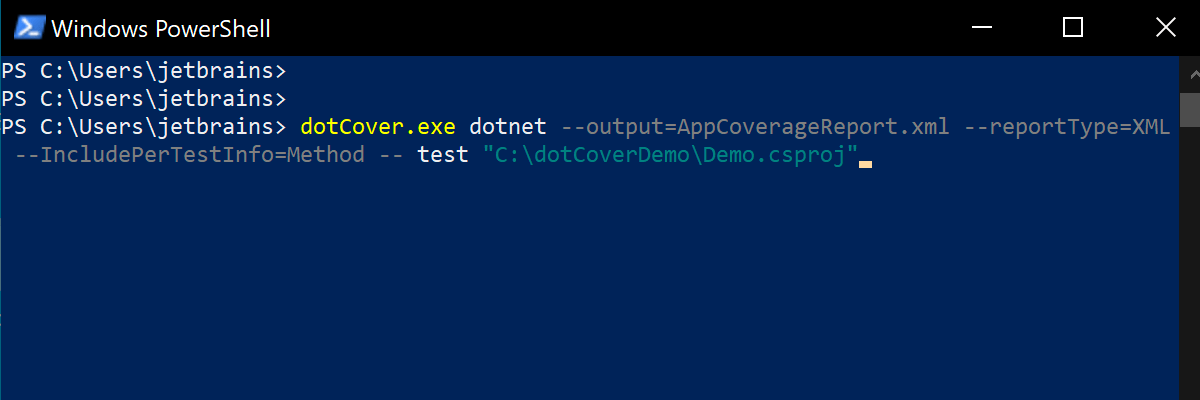
Coverage information for individual tests in the console runner 2021.2
The dotCover console runner is able to collect coverage information for individual
tests and show it in the generated reports. Currently, only the following test runners
are supported: dotnet test, dotnet vstest,
vstest.console.exe. For example:
dotCover.exe dotnet --output=AppCoverageReport.xml --reportType=XML
                                --IncludePerTestInfo=Method -- test "C:\MyProject\MainTests.csproj"
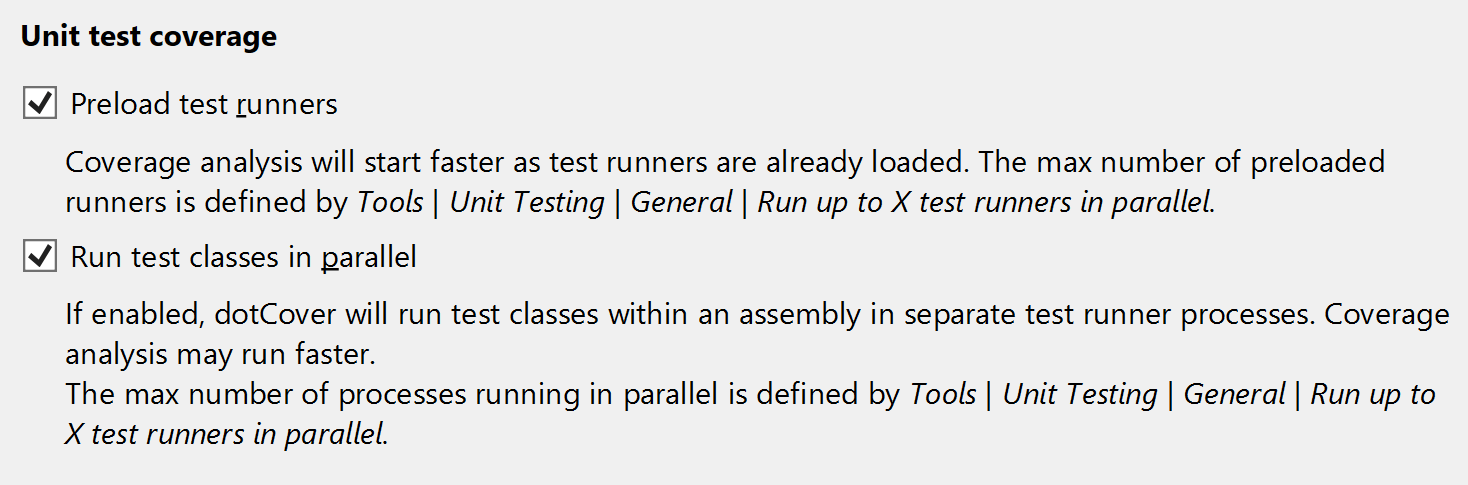
Improved coverage performance 2021.2
- Now, dotCover can run coverage analysis of test classes in parallel within one assembly. In certain scenarios this can result in faster coverage analysis.
- Unit test runners can now be preloaded for .NET Core and .NET projects (this allows coverage analysis to start quicker, as the unit test runners are already loaded in memory).
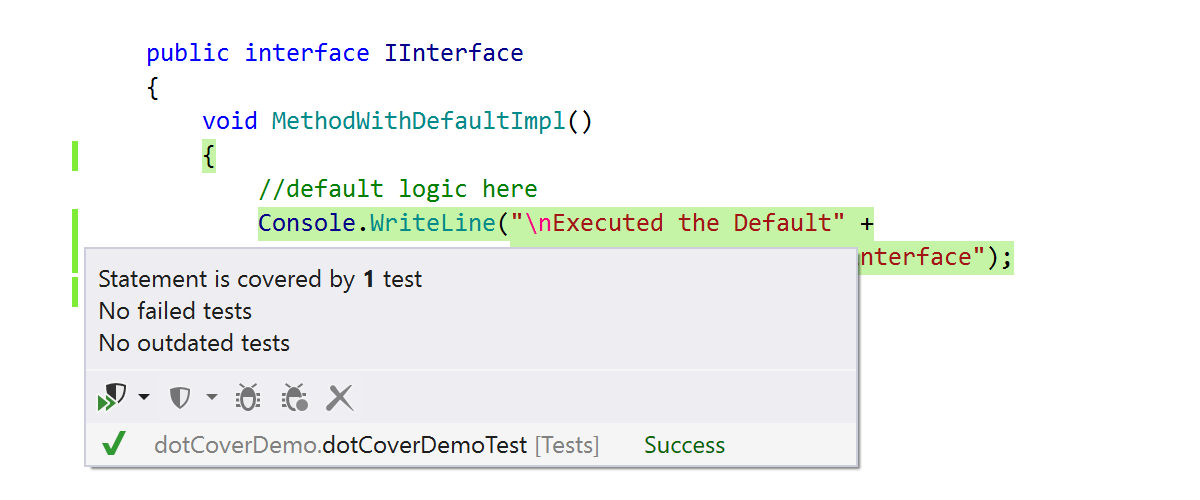
Updates to C# and Unity support 2021.2
- We’ve improved support for C# 8.0 and C# 9.0 in the coverage tree (showing default interface implementations, and more).
- Now, dotCover will offer to restart Unity Editor when coverage filters are changed.
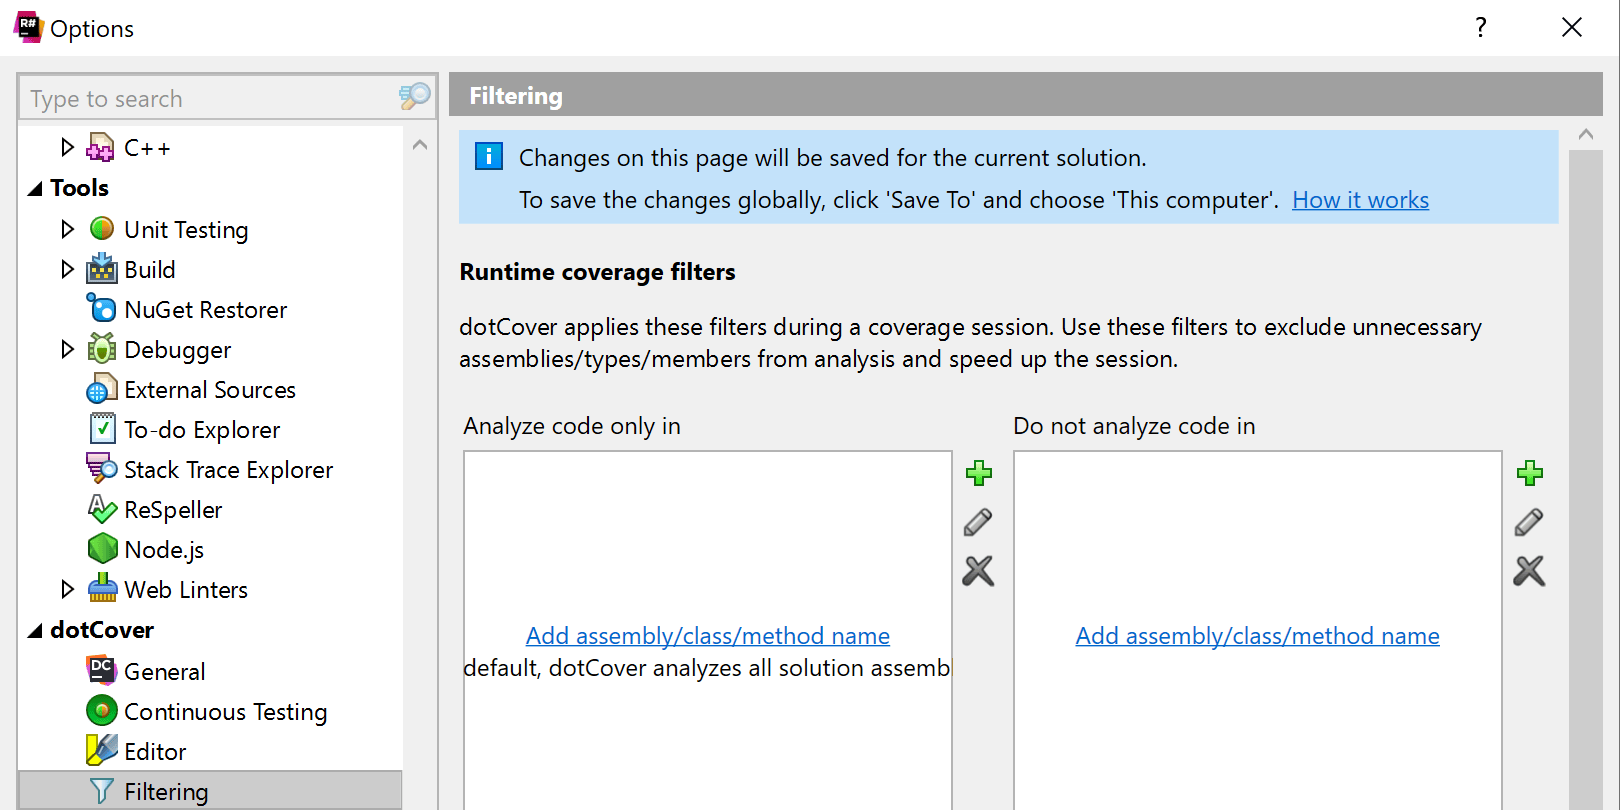
Updated filtering settings in ReSharper 2021.1
You can now configure coverage filters in Visual Studio with ReSharper in the same way as in JetBrains Rider.
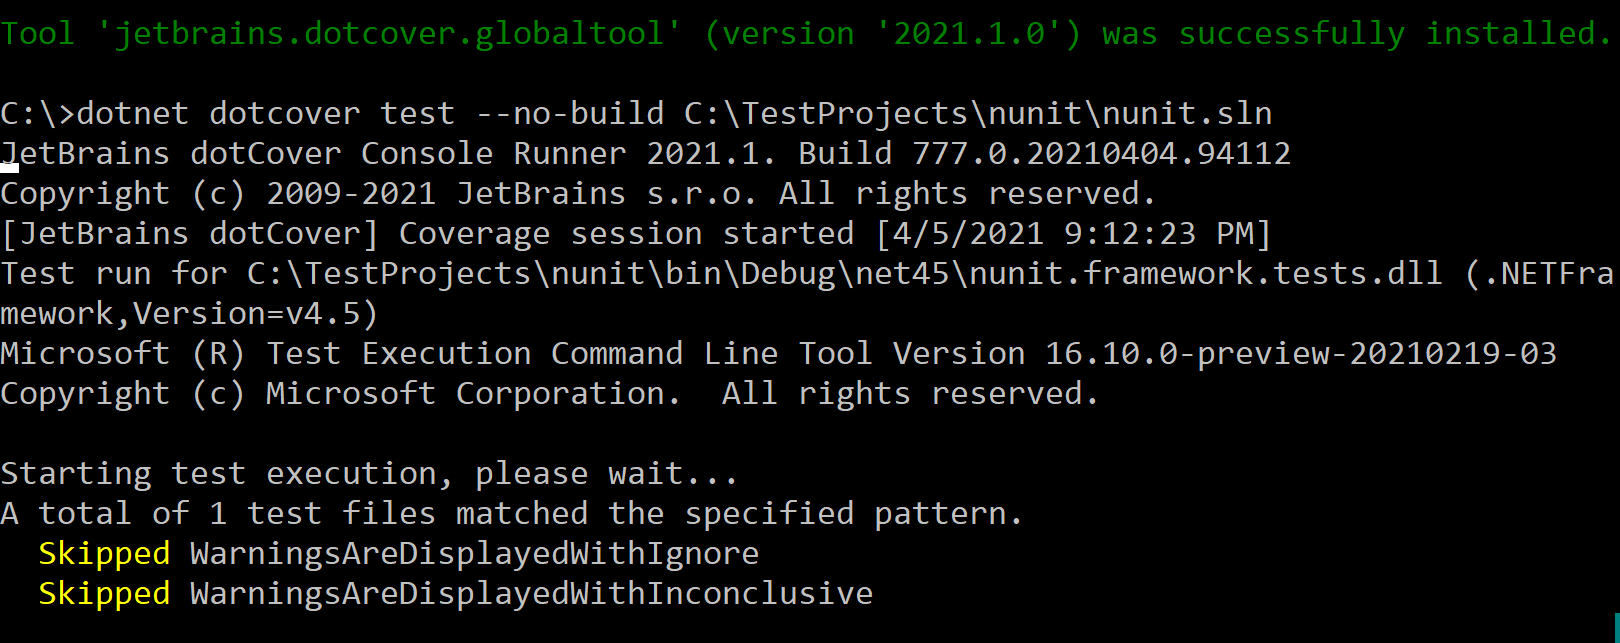
dotCover console runner as a .NET global tool 2021.1
You can install the dotCover console runner as a dotnet global tool:
dotnet tool install --global JetBrains.dotCover.GlobalTools --version 2021.1.0
Use it to analyze coverage in your .NET Core projects and unit tests.