What′s New in dotMemory
This page guides you through updates in recent dotMemory and dotMemory Unit releases. Highlights include a command-line profiling tool, support for .NET applications, and analyzing memory dumps.
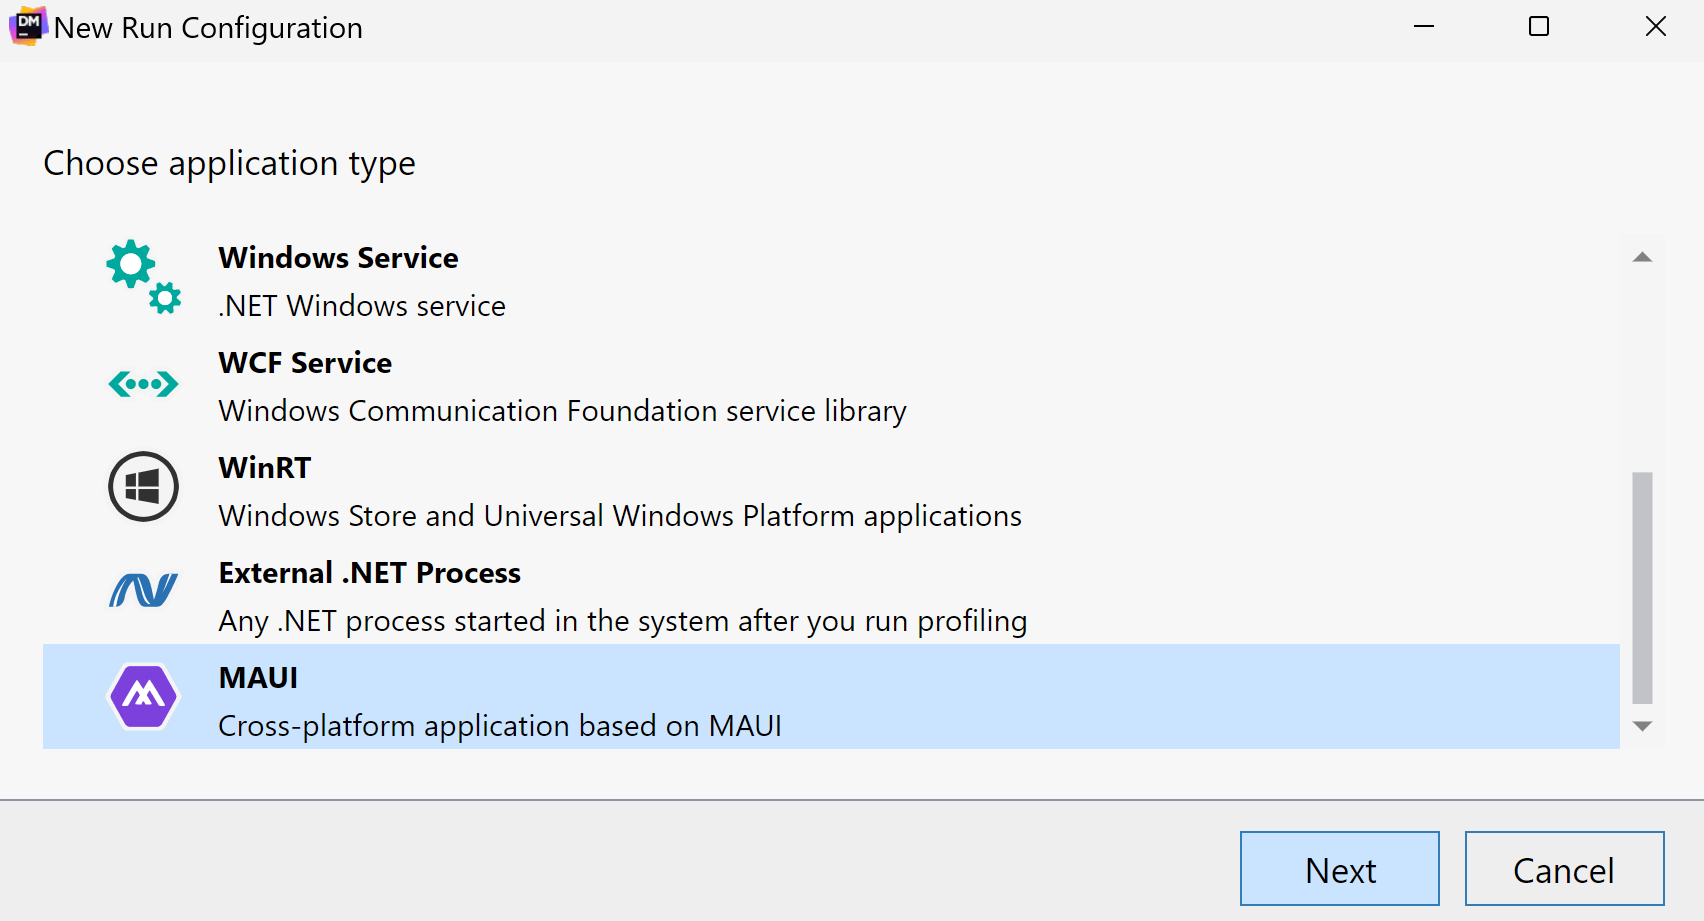
Support for MAUI applications 2024.1
Now, you can profile applications based on the MAUI framework.
Currently, dotMemory supports profiling of WinUI applications targeting .NET 7.0+ on Windows.
The support is available for dotMemory standalone and dotMemory integrated into Rider and ReSharper.
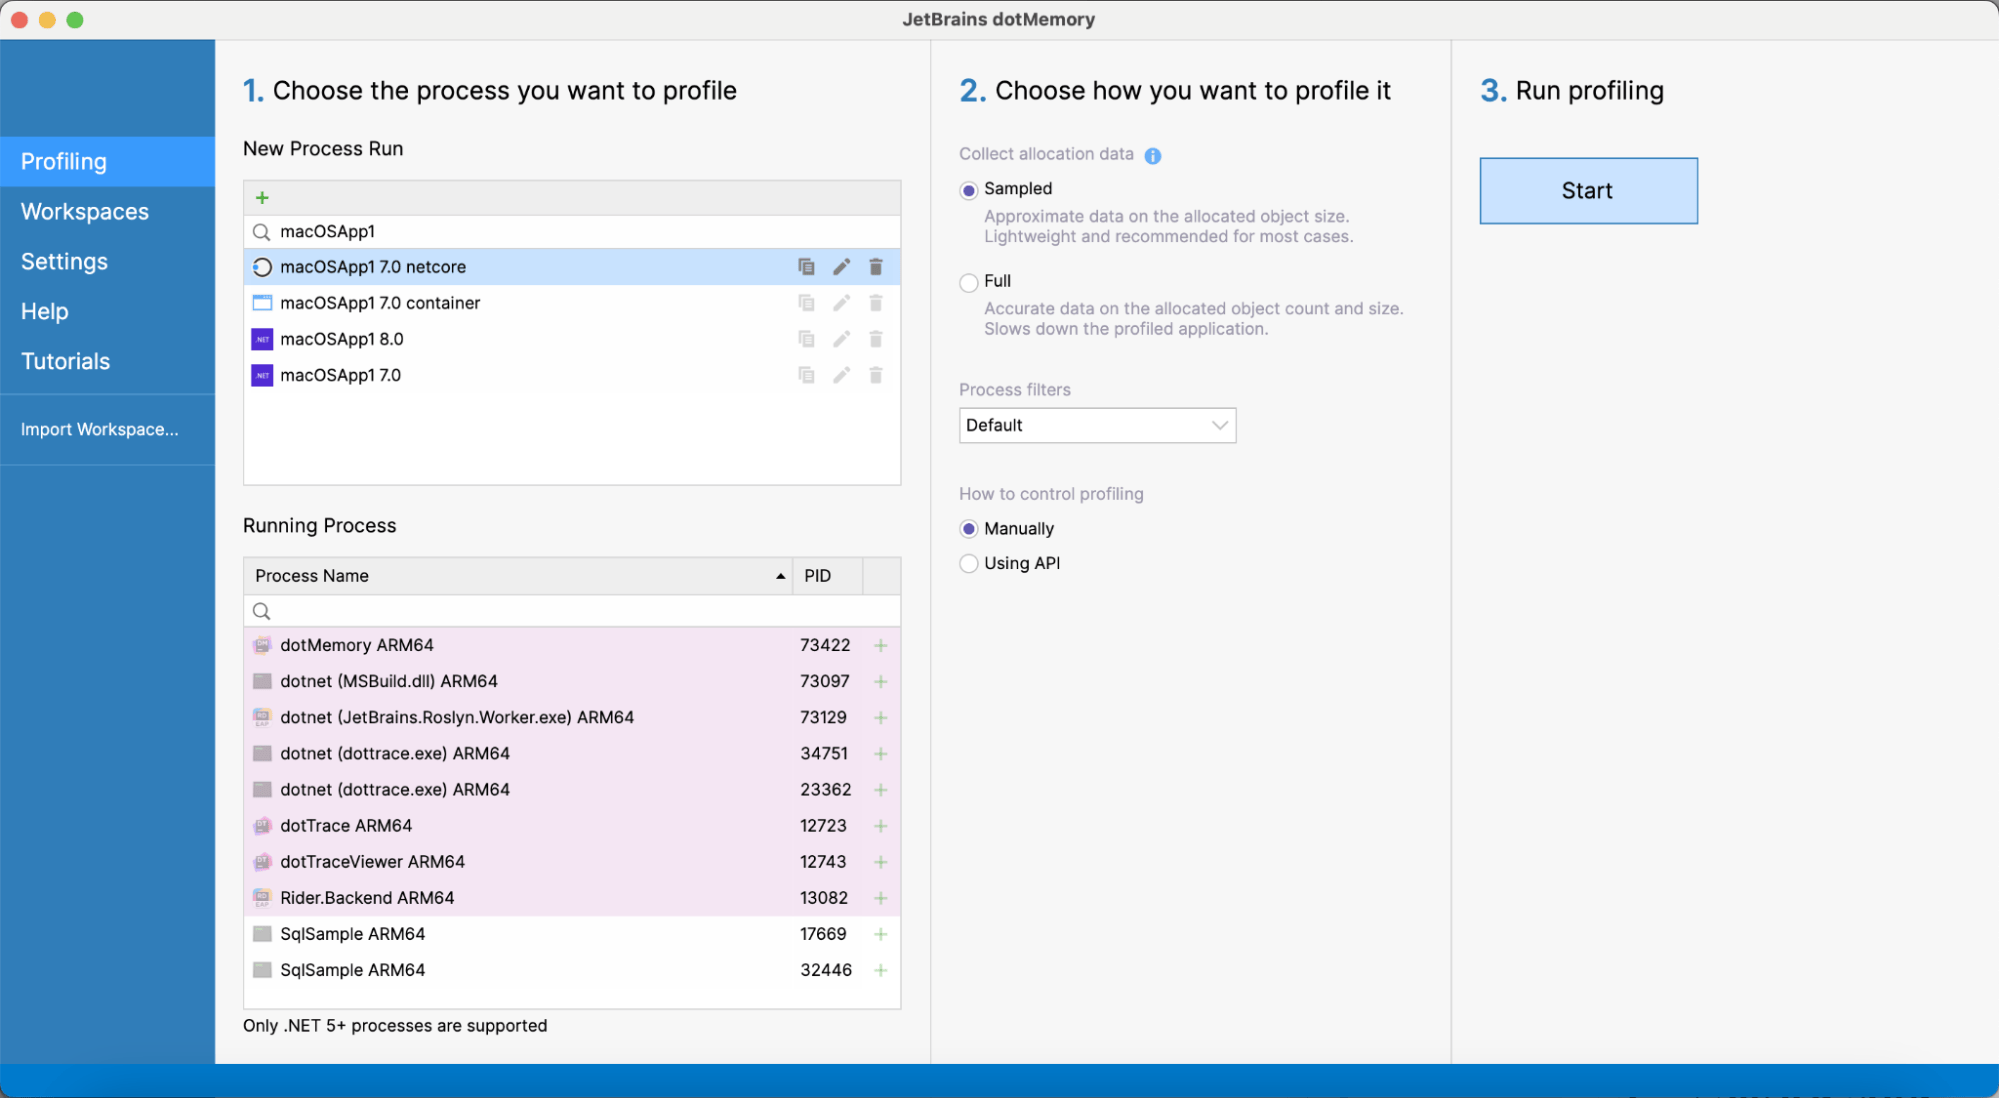
Improved support for macOS 2024.1
-
Now, the standalone version of dotMemory lets you specify application bundles
(
.app) instead of executable files. -
dotMemory in Rider can profile macOS run configurations. The following target
frameworks are supported:
net7.0-macos,net8.0-macos.
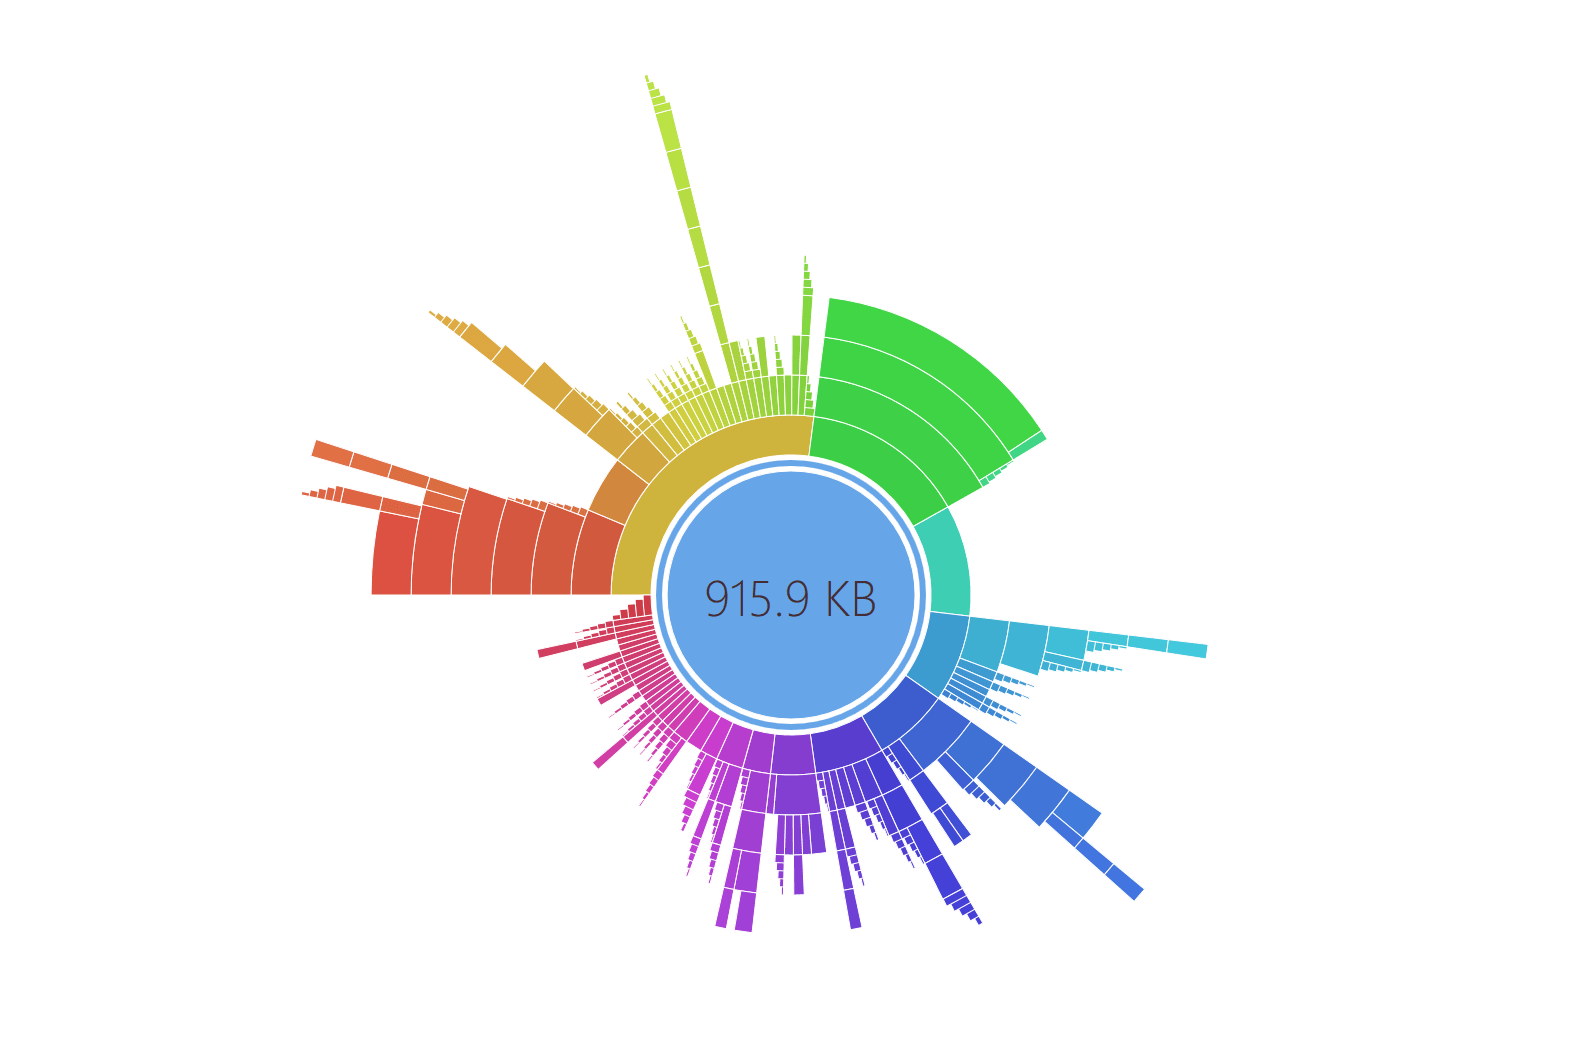
New views in dotMemory for Linux and macOS 2024.1
The standalone version of dotMemory on Linux and macOS gets closer to its Windows counterpart, offering:
- The Similar Retention view for analyzing object sets
- The Sunburst diagram for analyzing dominator objects
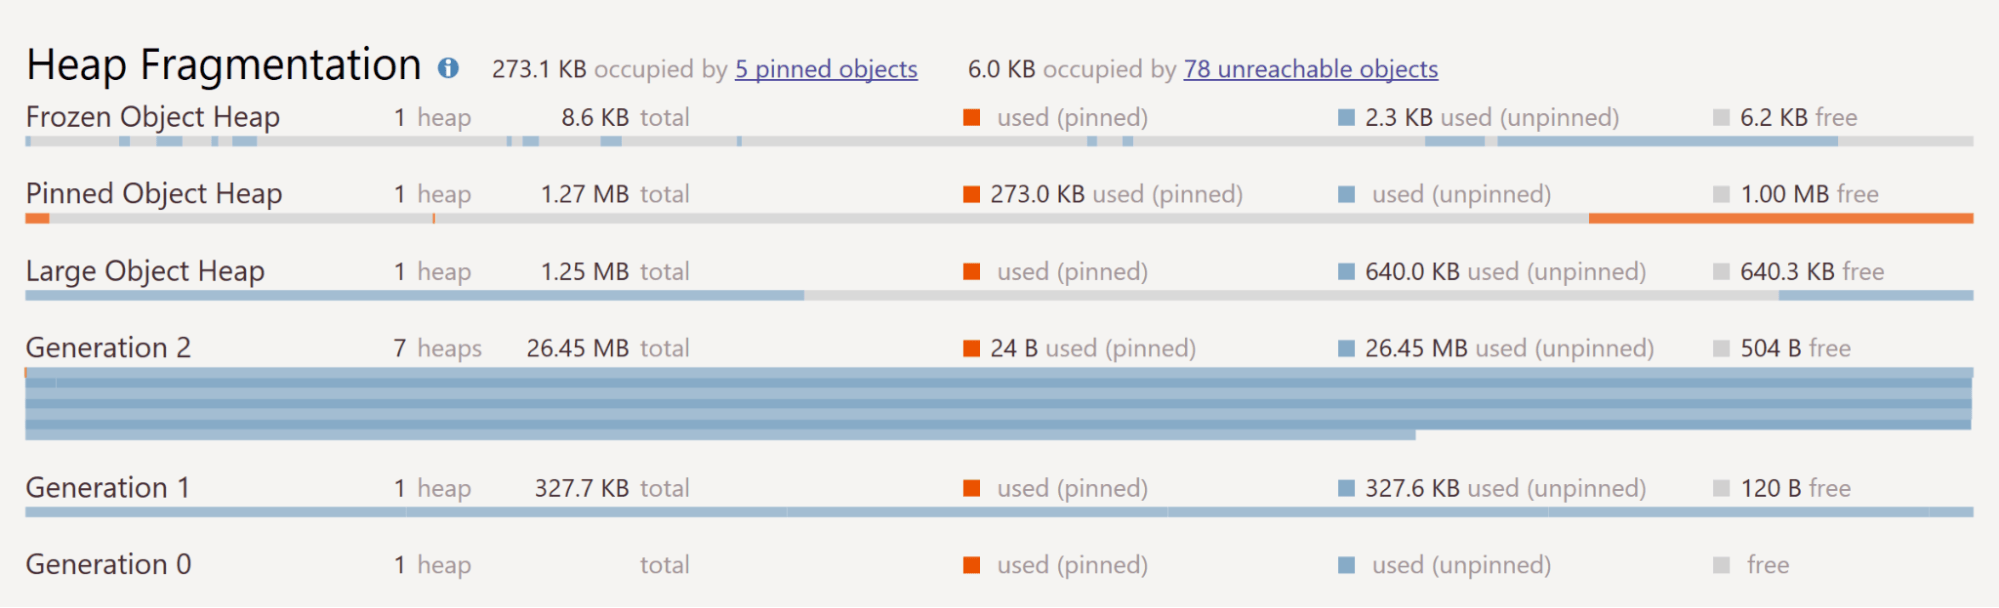
Support for Frozen Object Heap 2024.1
The information about immutable objects in the Frozen Object Heap is shown on the timeline, the Heap Fragmentation diagram, and the Generations view.
dotMemory Standalone on Linux and macOS 2023.3 Beta
Now, you can run the standalone version of dotMemory on Linux and macOS operating systems.
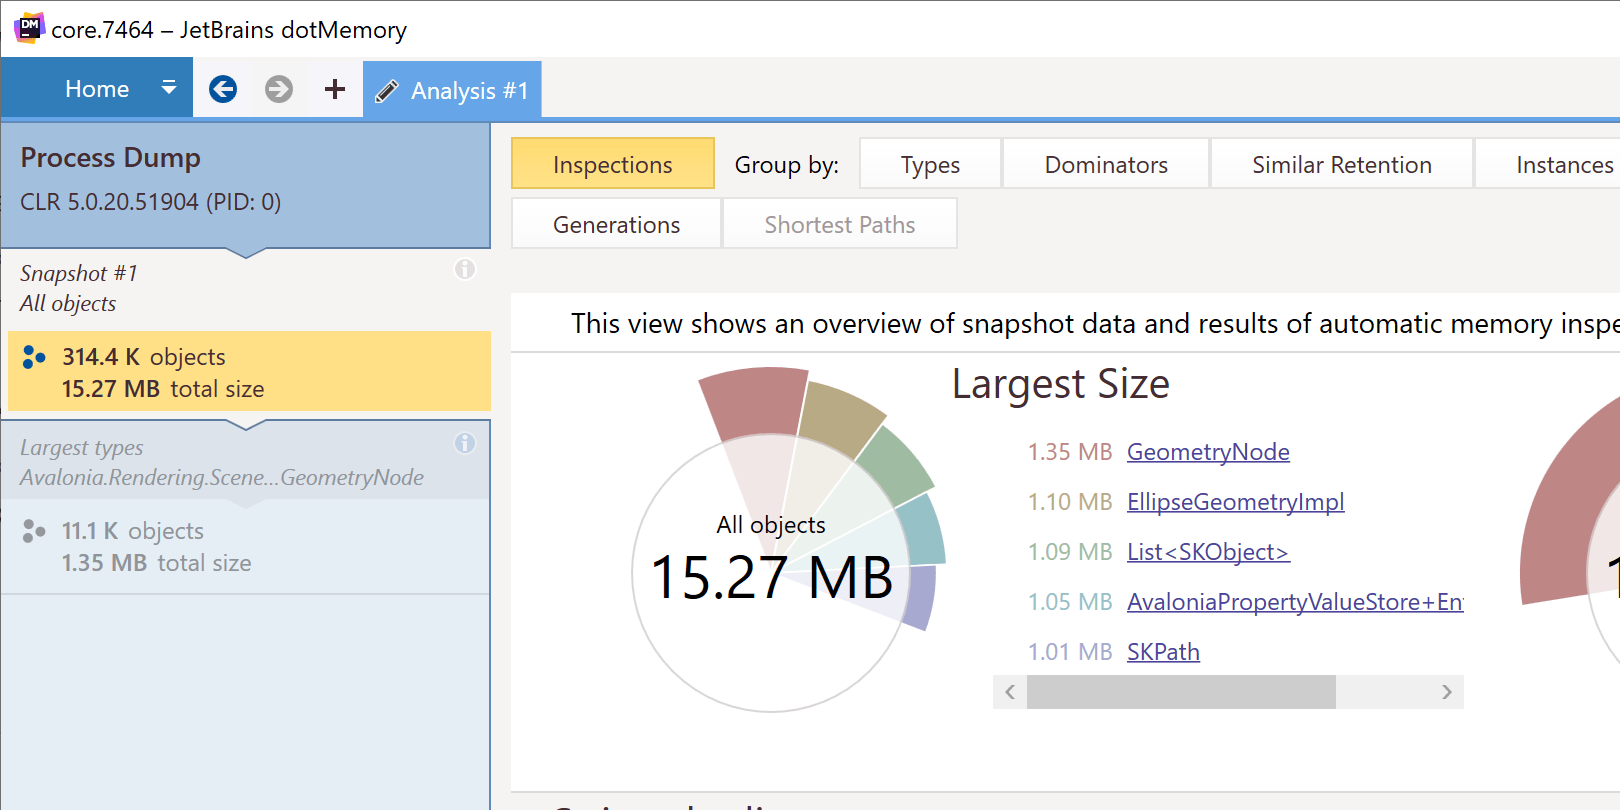
Analyze process dumps on Linux 2023.3
dotMemory now allows you to import and analyze process dumps as regular snapshots on Linux. Please note that the Linux version of dotMemory can only import dumps collected from processes running on the Linux OS.

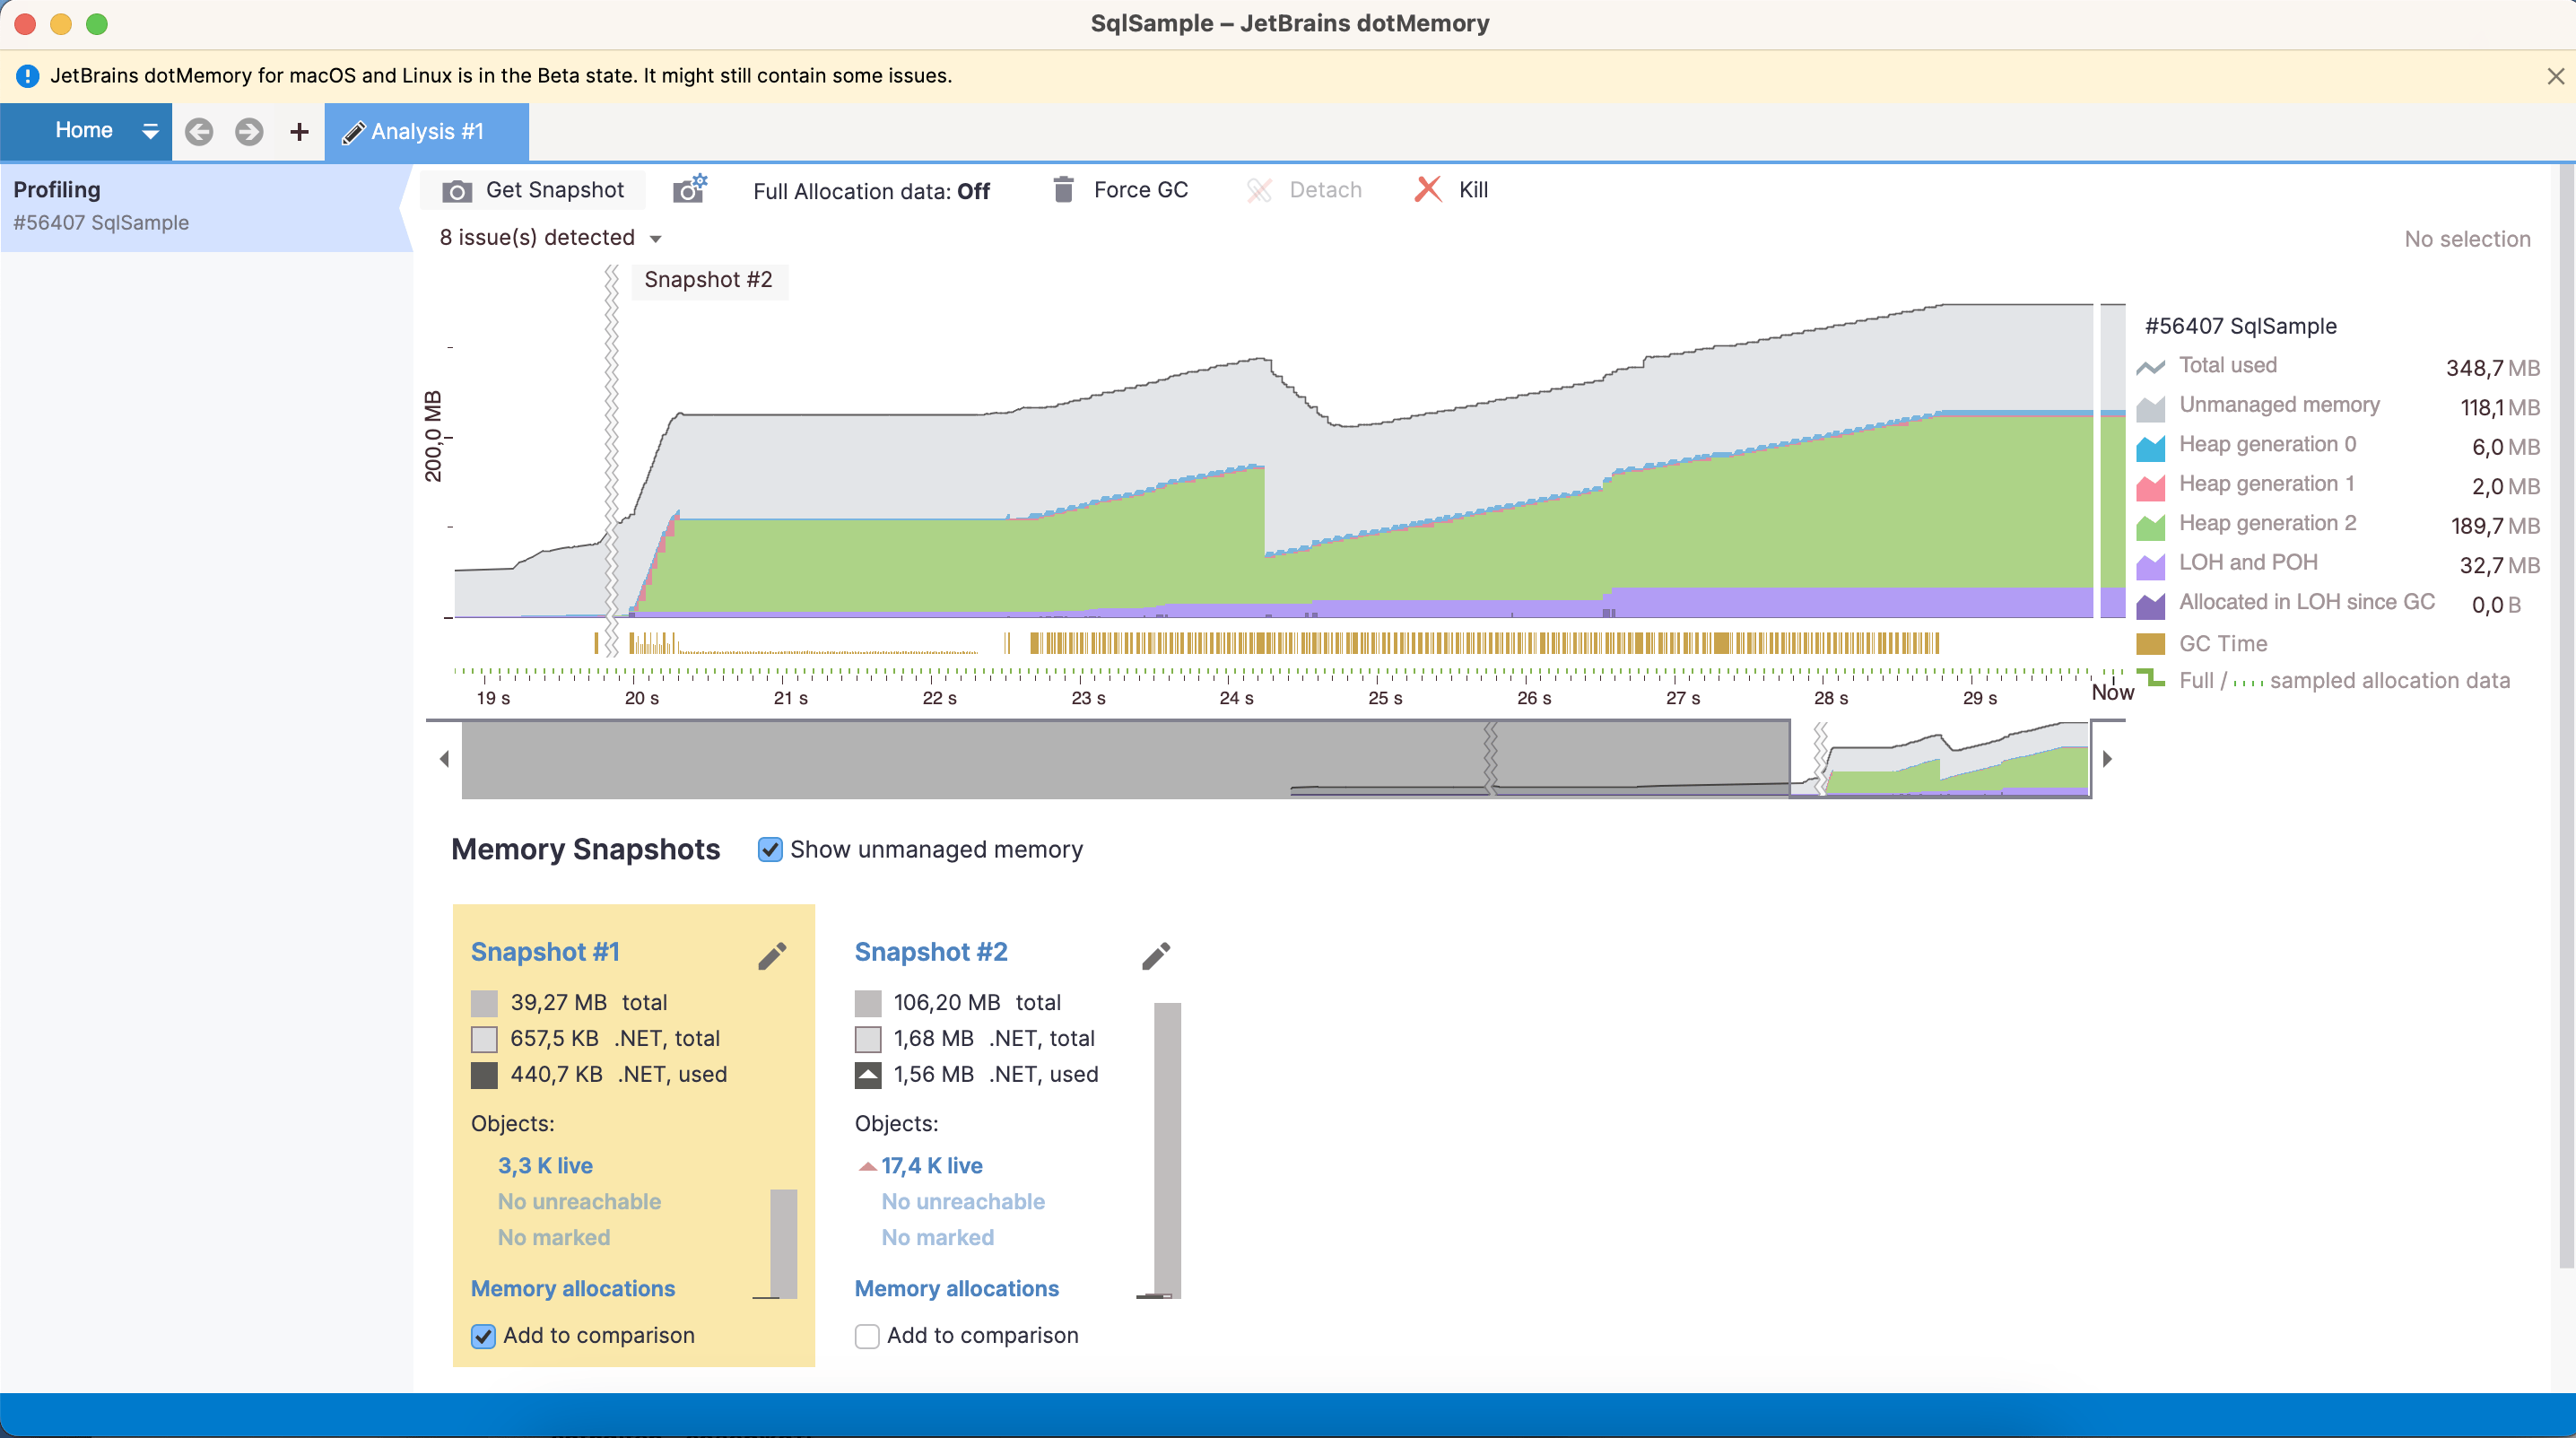
Snapshot analysis in JetBrains Rider 2023.2
Before 2023.2, you could only use dotMemory in Rider for memory allocation analysis. In 2023.2, you can collect memory snapshots and analyze them in Rider, just like in the standalone version of dotMemory.
- Snapshot analysis is available on Windows, Linux, and macOS.
- On Windows, you can also import and analyze process dumps.
- Some features and views are not available, e.g., automatic snapshot inspections and creation stack trace views.
Support for Windows ARM64 2022.3
Now, you can use dotMemory on ARM64 CPUs on Windows. This applies to all versions: dotMemory standalone, dotMemory in Rider, dotMemory in Visual Studio, and the dotMemory command-line tool.
Support for Linux ARM32 2022.3
Now you can run the dotMemory command-line profiler on ARM32 CPUs on Linux. The supported frameworks are .NET Core 3.1 and .NET 5.0–7.0.

dotMemory in JetBrains Rider 2022.3
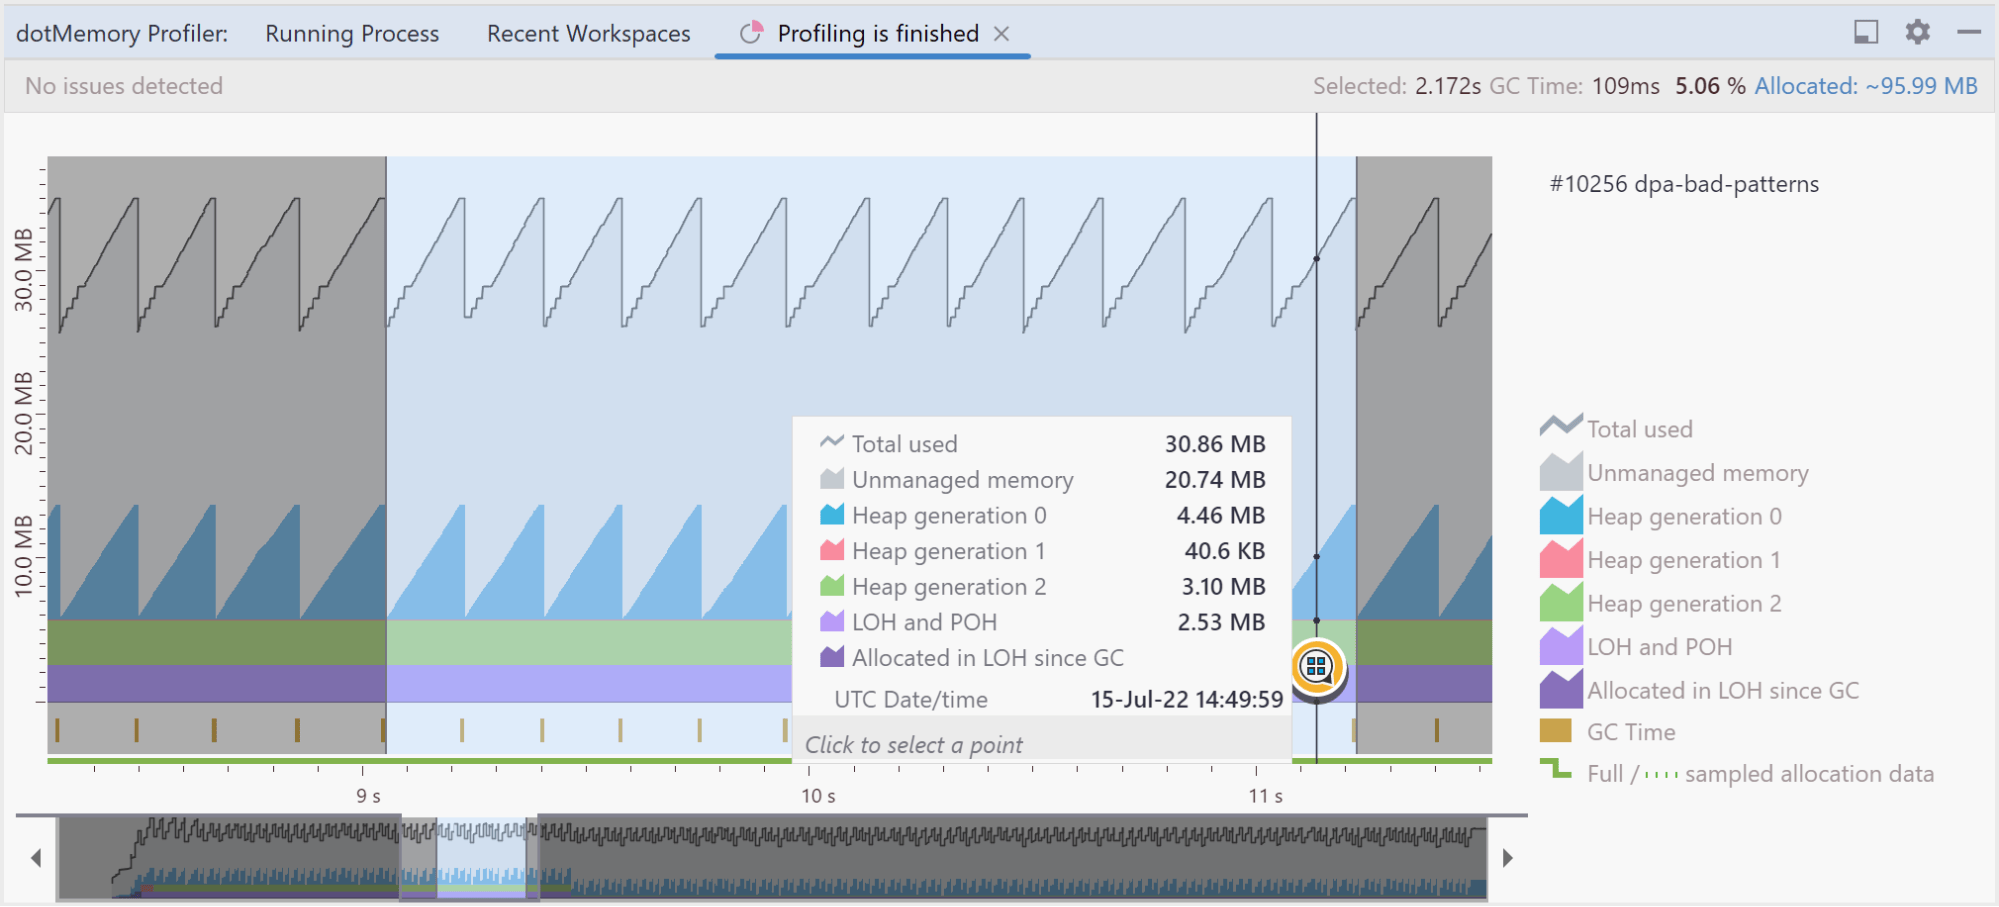
In addition to Windows, dotMemory is now available for JetBrains Rider on Linux and macOS. Two new profiling modes are available in the Run widget and in the Run | Switch profiler configuration menu – Memory (sampled allocations) and Memory (full allocations). You can learn more about the differences between these in dotMemory’s Help.
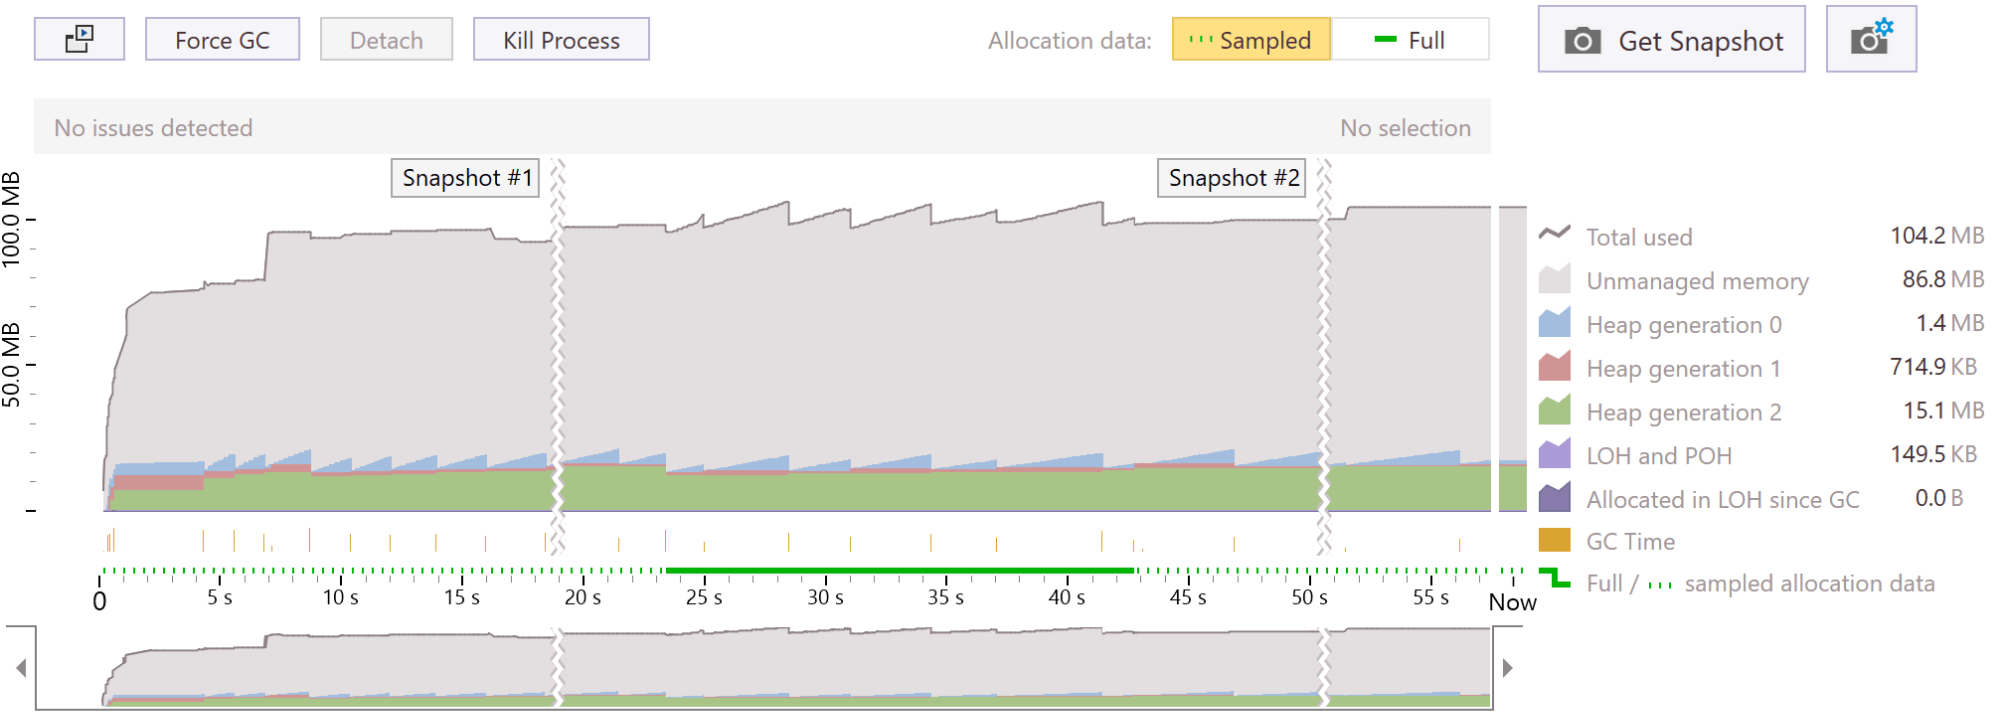
You can attach the profiler to a running process from the Run menu and watch the Timeline Graph unroll in real time. Select an interval to open the Memory Allocations view, which is the same as in dotMemory Standalone. It lets you analyze allocated objects and the allocation call tree for a specific time frame.
Unfortunately, it is not yet possible to collect memory snapshots in this version.
Improvements in the dotMemory command-line profiler 2022.3
The command-line profiler now has the --saving-mode argument, which lets
you set conditions for when to save a dotMemory workspace.
dotMemory in JetBrains Rider 2022.2
dotMemory is now available right in JetBrains Rider:
- Two new profiling modes are available in the Run widget and Run | Switch profiler configurations in the main menu – Memory (sampled allocations) and Memory (full allocations). You can learn more about the difference between these in the dotMemory Help.
- You can attach the profiler to a running process from the Run menu.
- Watch the Timeline Graph unfold in real-time by selecting an interval and opening the Memory Allocation view. It is equivalent to the same view in dotMemory Standalone and allows you to dig deeper into the analysis of a specific time frame.
The dotMemory plugin doesn’t allow collecting snapshots and only works on Windows in the 2022.2 release.
Support for musl-based Linux distributions 2022.1
The dotMemory command-line tool now supports Alpine versions 3.13–3.15. The following CPUs and frameworks are supported:
- x64: .NET Core 3.1, .NET 5.0–6.0.
- arm64: .NET 5.0–6.0.
Improved Profiling API 2022.1
When getting a snapshot with the help of the profiling API, you can now
specify a snapshot name using DotMemory.GetSnapshot("snapshot name");
The name will be shown on the dotMemory Home | Snapshots page.
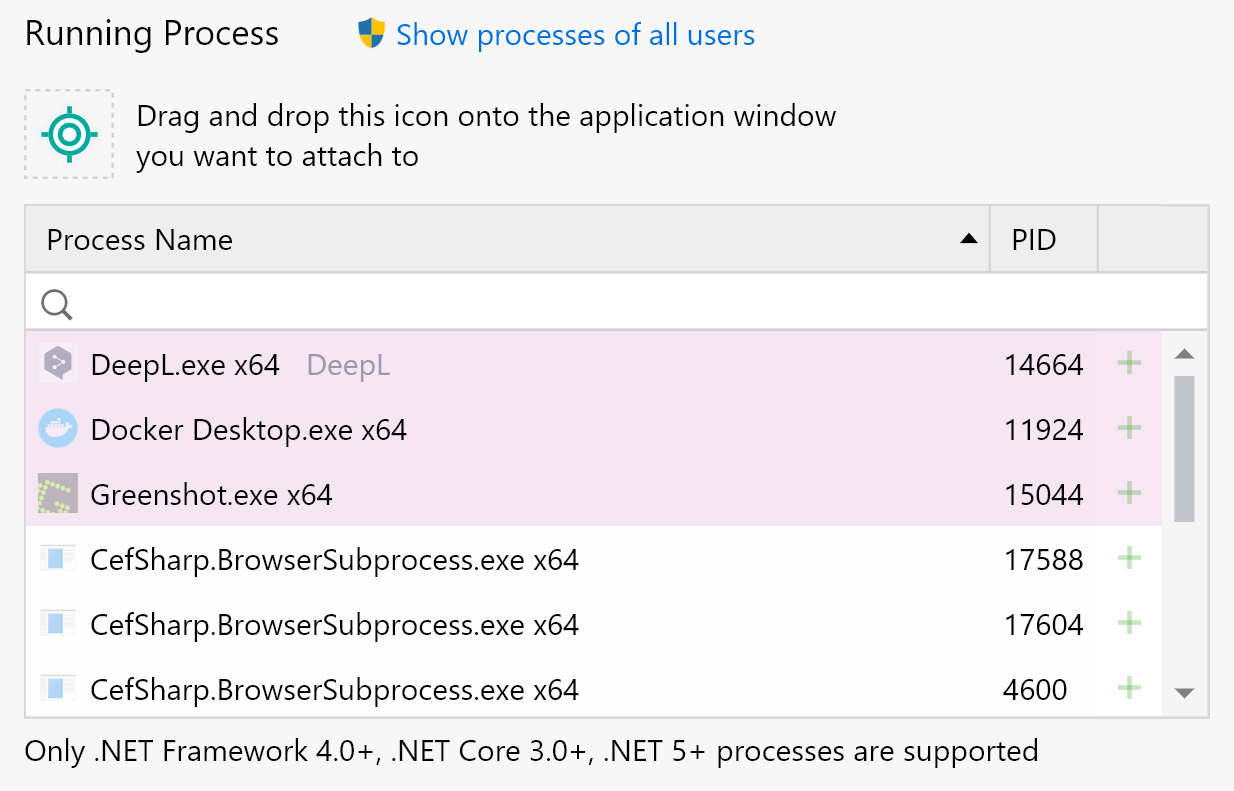
Attaching to applications with drag and drop 2022.1
You can now attach the profiler to an already running application by simply dragging the special icon onto the application window.
Command-line tool improvement 2022.1
The dotMemory command-line tool now shows its progress when saving a snapshot.
Improved performance of the Similar Retention view 2022.1
The Similar Retention view now processes data much faster.
Support for Apple silicon processors 2021.3
The dotMemory command-line tool now works on computers with Apple silicon processors. You can now use dotMemory CLT to profile .NET 6 applications (native mode) and .NET 5 applications (Rosetta 2 mode).
Performance improvements 2021.3
We completely reworked the algorithm behind the dominators tree (the object retention graph). Even if an object set contains hundreds of millions of objects, it only takes dotMemory a couple of minutes to open a specific view.
Sampled memory allocation data 2021.3
dotMemory can now get sampled data about memory allocation based on ETW events. Compared to the traditional (statistical) way of collecting allocation data, sampling is less accurate but provides a number of advantages:
- The sampled allocation data is collected without performance penalties.
- You don’t need to enable this data collection explicitly; it is always active.
- Sampled allocation data can also be collected when you attach the profiler to an application that is already running.
Note that this feature is available only on Windows.
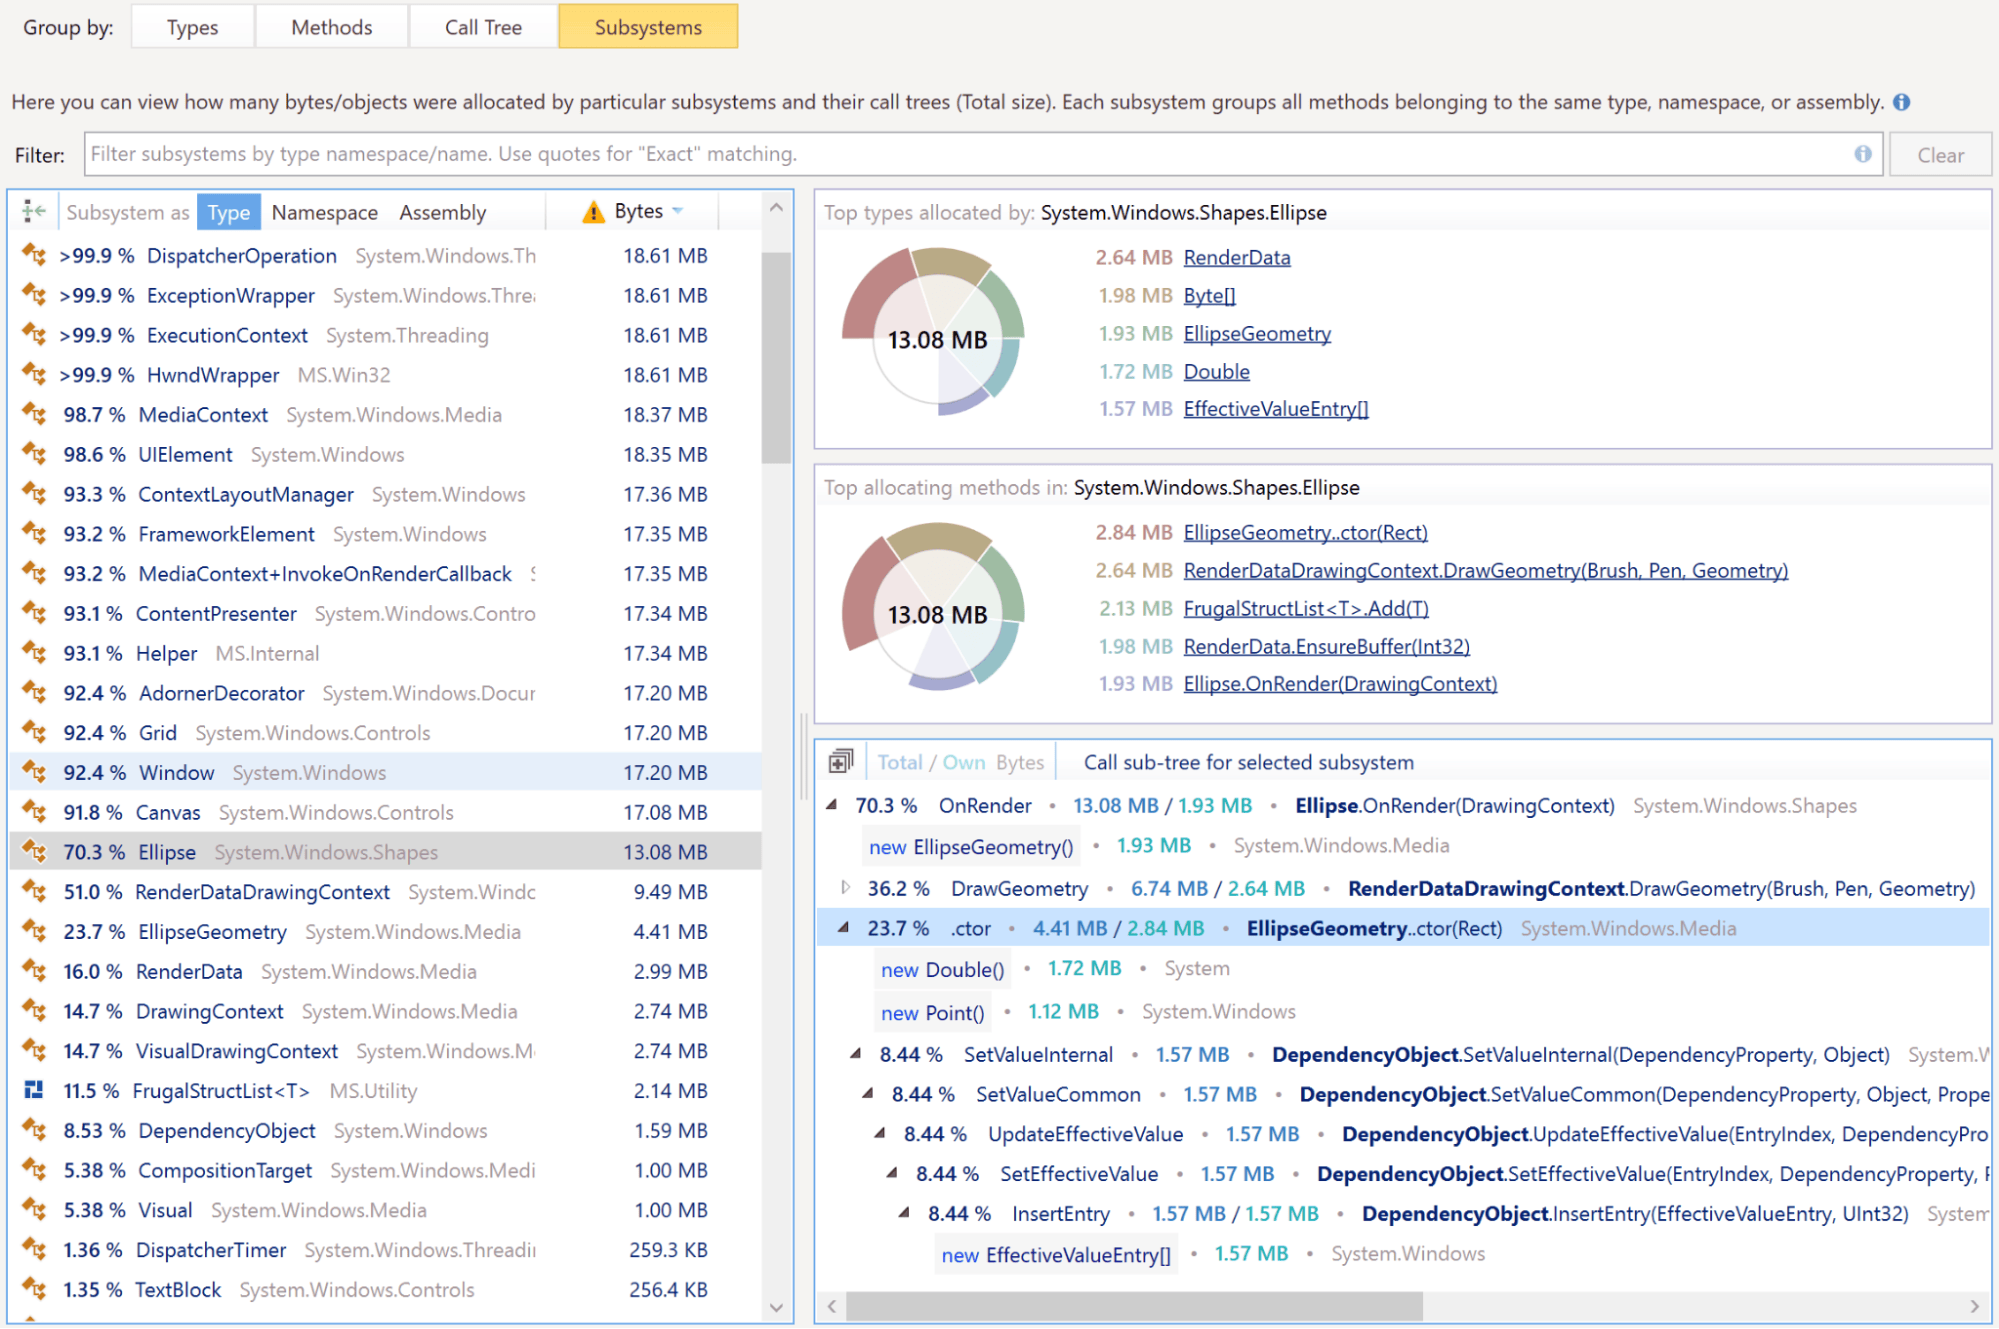
Subsystems view 2021.3
You can now use the Subsystems view to analyze memory allocation data. A subsystem groups all methods belonging to the same type, namespace, or assembly. The resulting view displays objects created by the subsystems and a merged call tree for each subsystem.
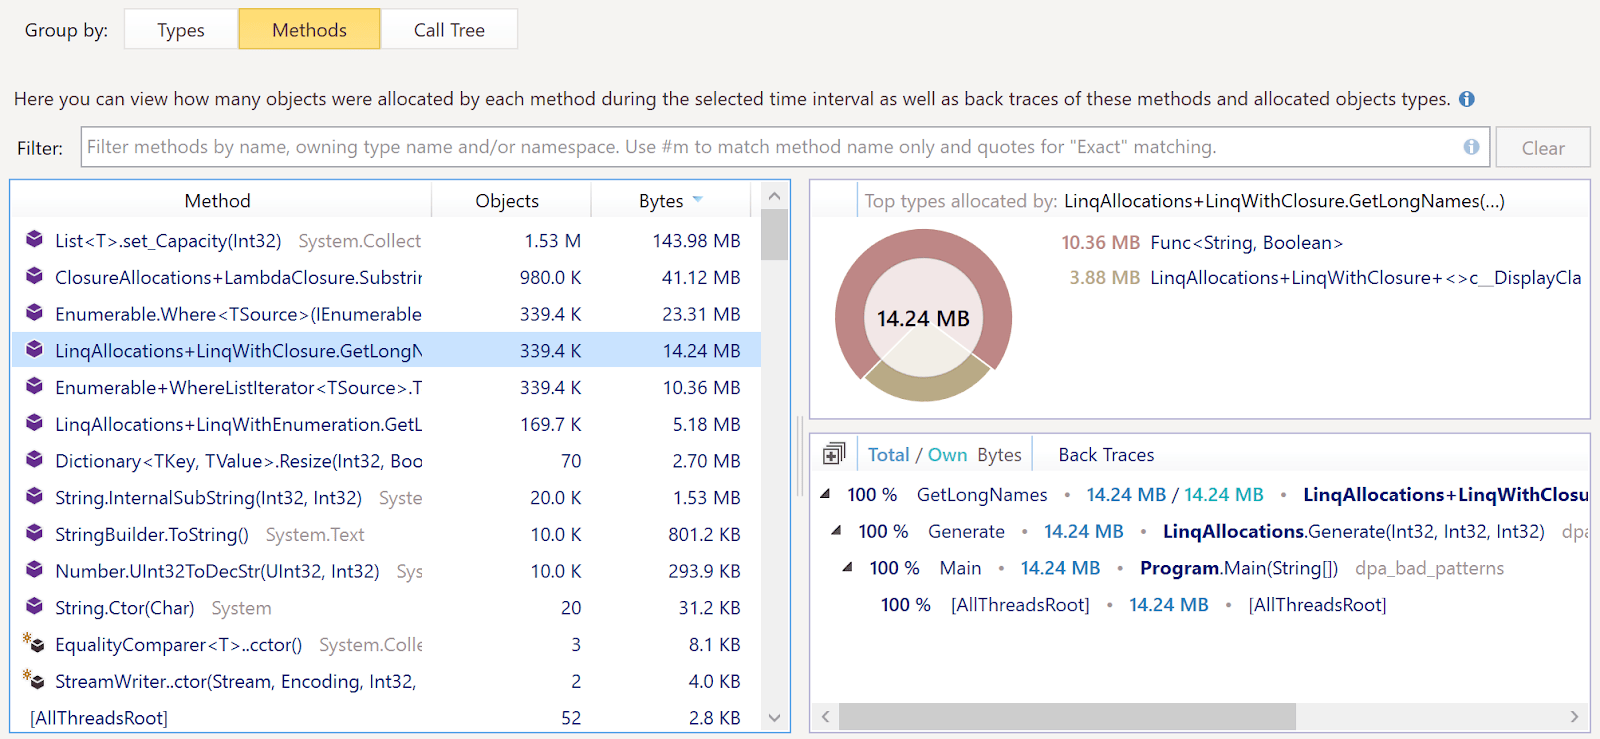
Updates to memory allocation analysis 2021.2
In this release, we have continued to improve the way you analyze memory allocation. Two new tabs have been added to the Memory Allocation view:
- The Methods tab lets you analyze a plain list of methods that have allocated memory.
- The Call Tree tab lets you analyze the allocation call tree. Each node in the tree shows not only the called method but also the objects allocated by the call.
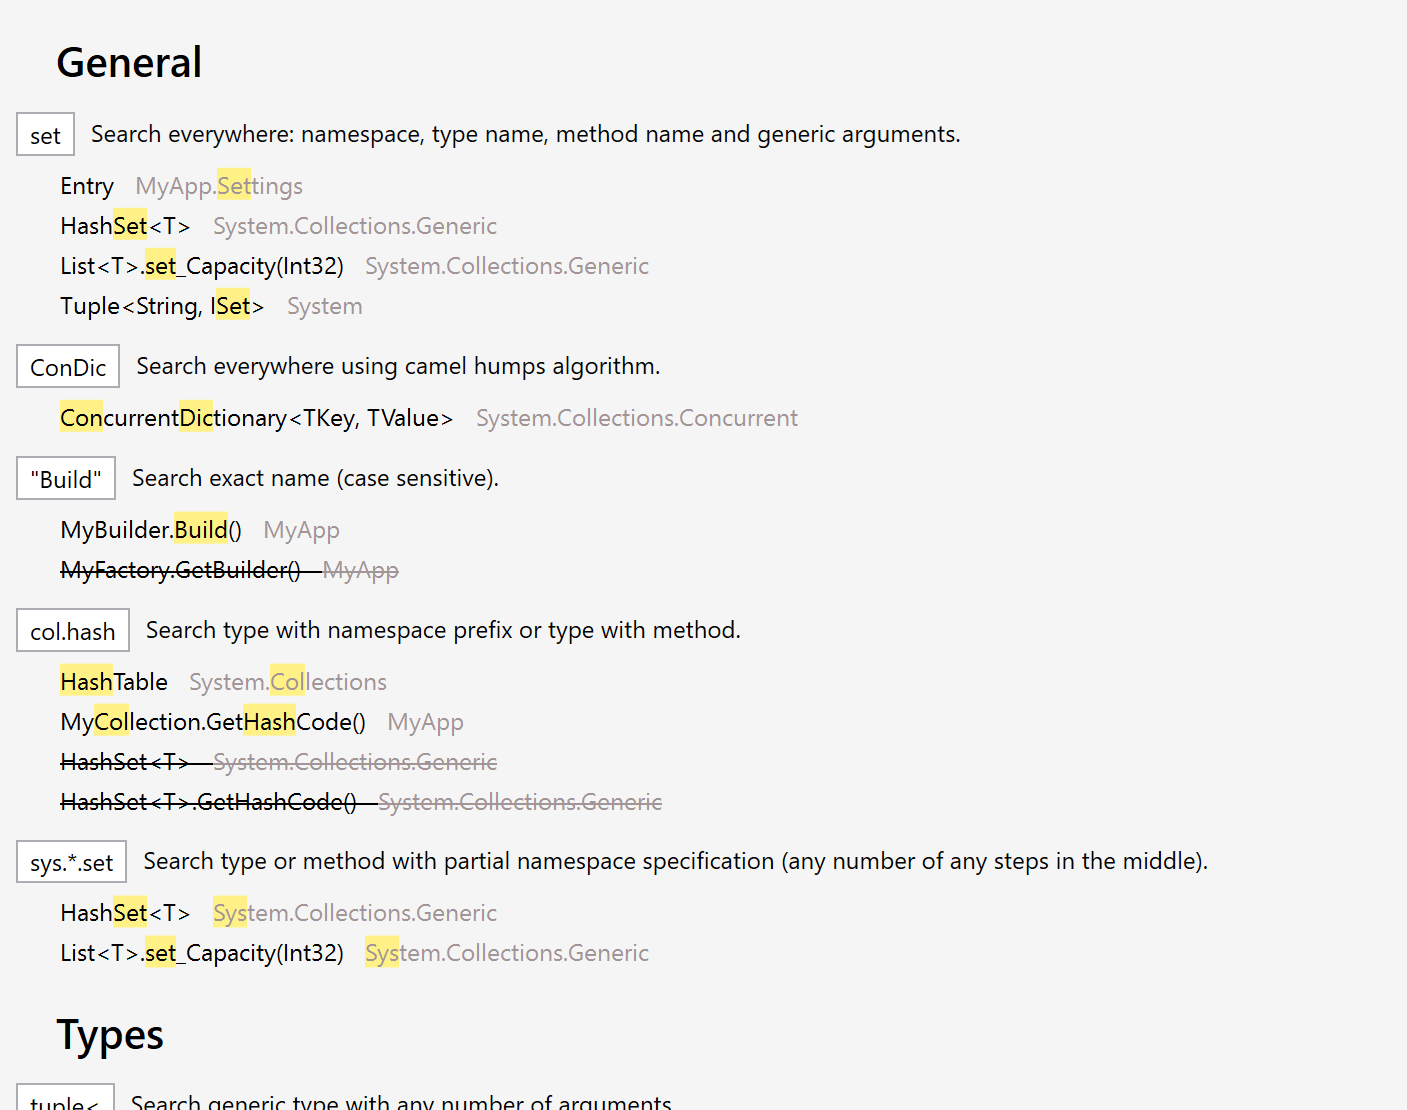
Improved filters 2021.2
The search bar at the top of dotMemory views is now more flexible and easier to use:
- The filters have additional options for narrowing the search scope: #struct (search only in value types), #c (only in types), #m (only in methods), #ns (only in namespaces).
- You can get help for all filters possible in a given context.
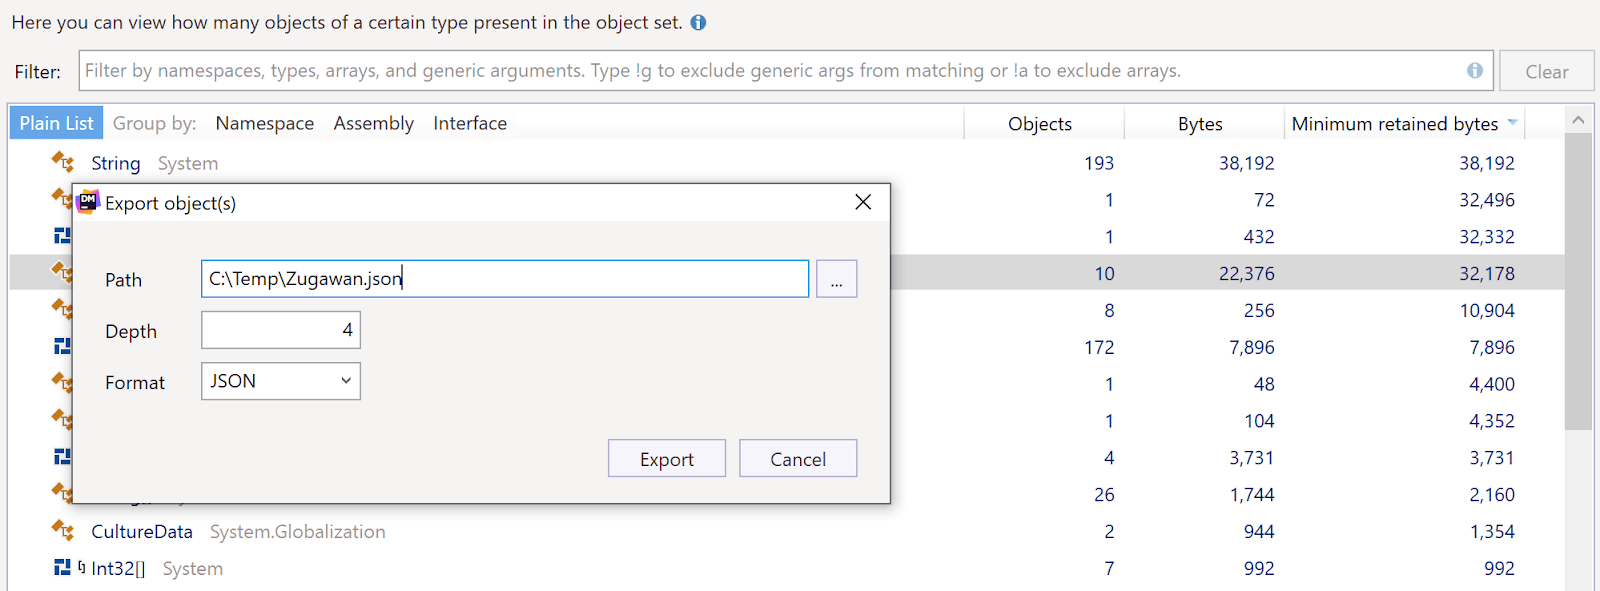
Improved object export 2021.2
It’s now possible to:
- Specify the traversal depth when exporting object data.
- Select one or more types and export their data to a single file.
- Export object data from the Instances, Outgoing References, and Unreachable Objects views.
Console profiler update 2021.2
It’s now possible to use service messages to enable and disable the collection of memory allocation data.
Copy stack trace to clipboard 2021.2
A stack trace copied to the clipboard in dotMemory is now automatically opened in Rider / Visual Studio with ReSharper.

New Home Screen 2021.1
We’ve completely reworked the dotMemory Home screen – it is much easier to configure and start new profiling sessions, work with snapshots, and perform other basic operations.
Support for Linux dumps 2021.1
Now, you can analyze dumps of .NET Core applications collected on the Linux systems
using gcore.
Improved memory allocation analysis 2021.1
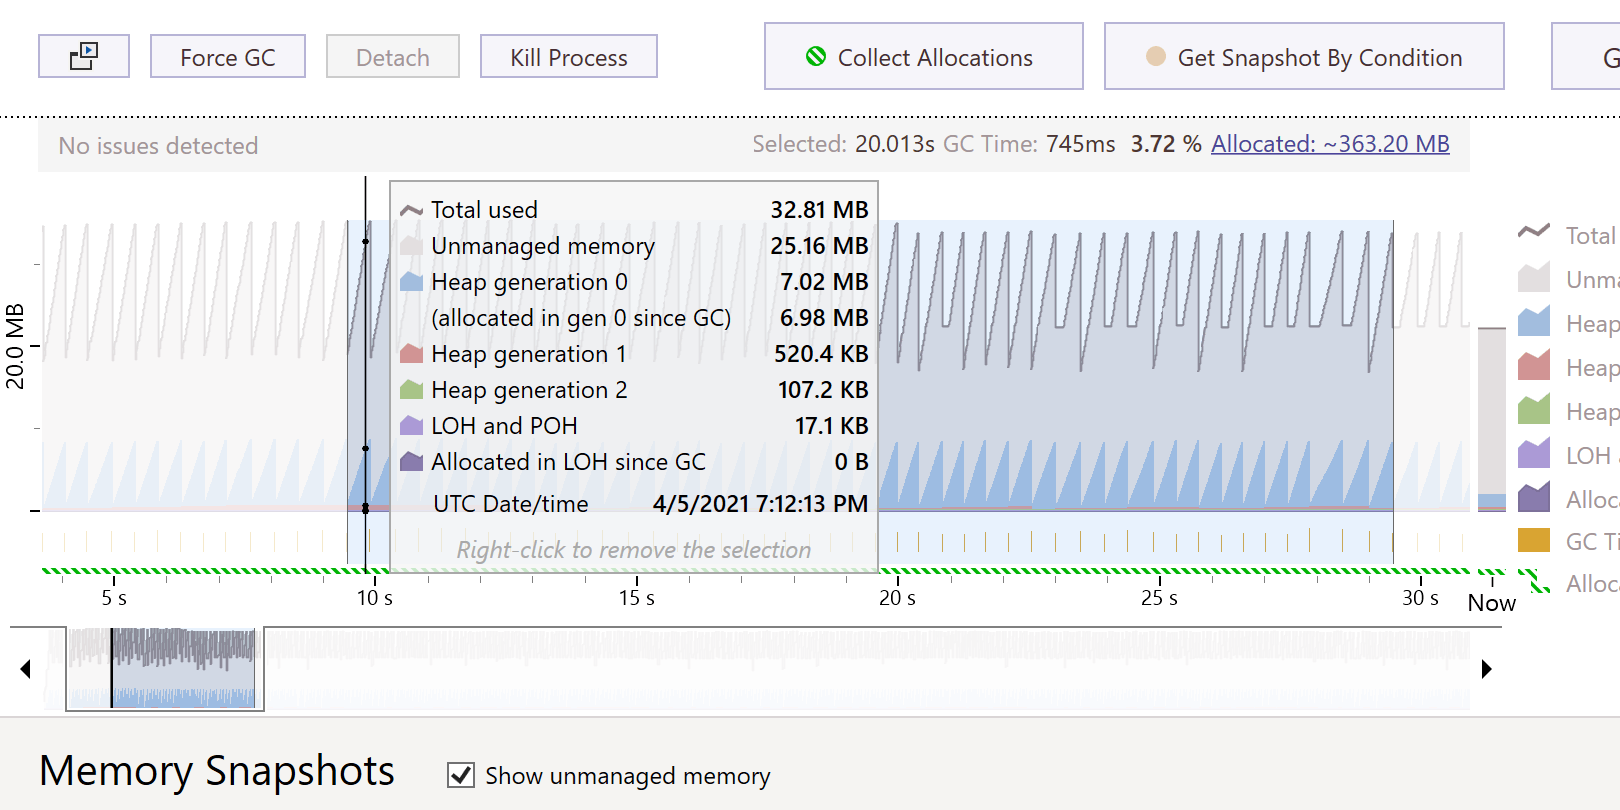
Now, dotMemory lets you analyze memory allocation on an arbitrary time interval. Just select the interval on the timeline and the Memory Allocation view will show you the objects allocated on this interval, as well as the stack trace that allocated them.