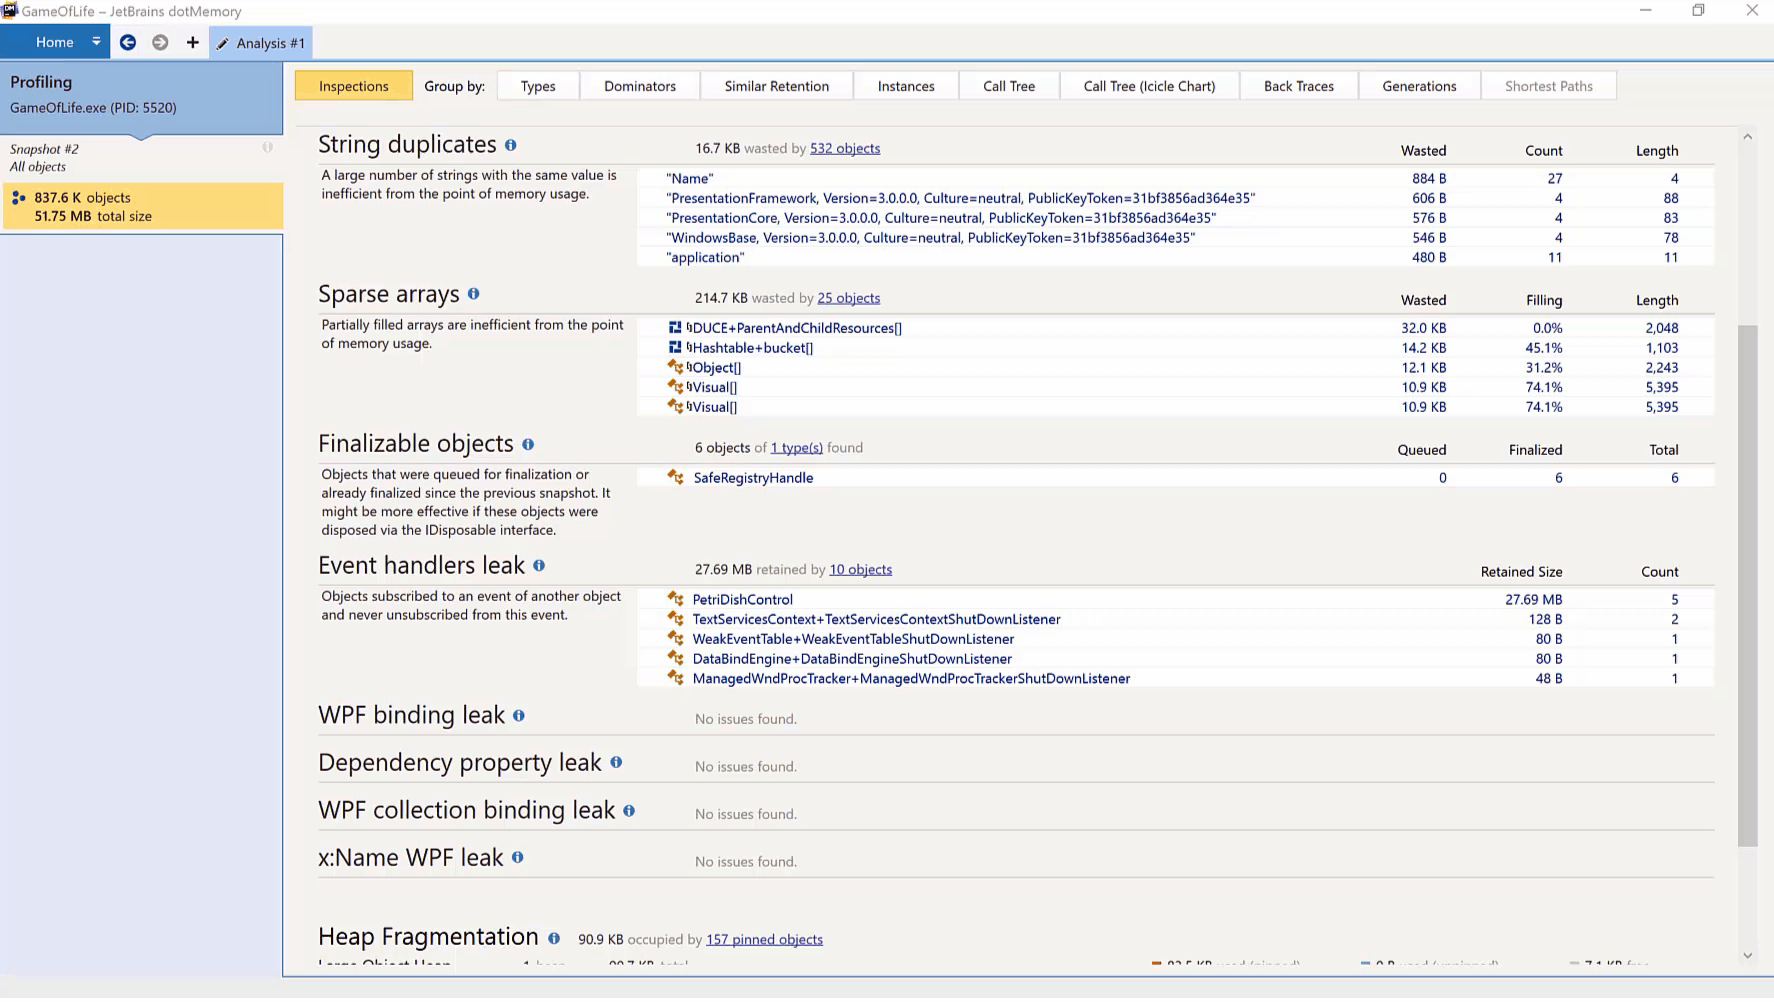
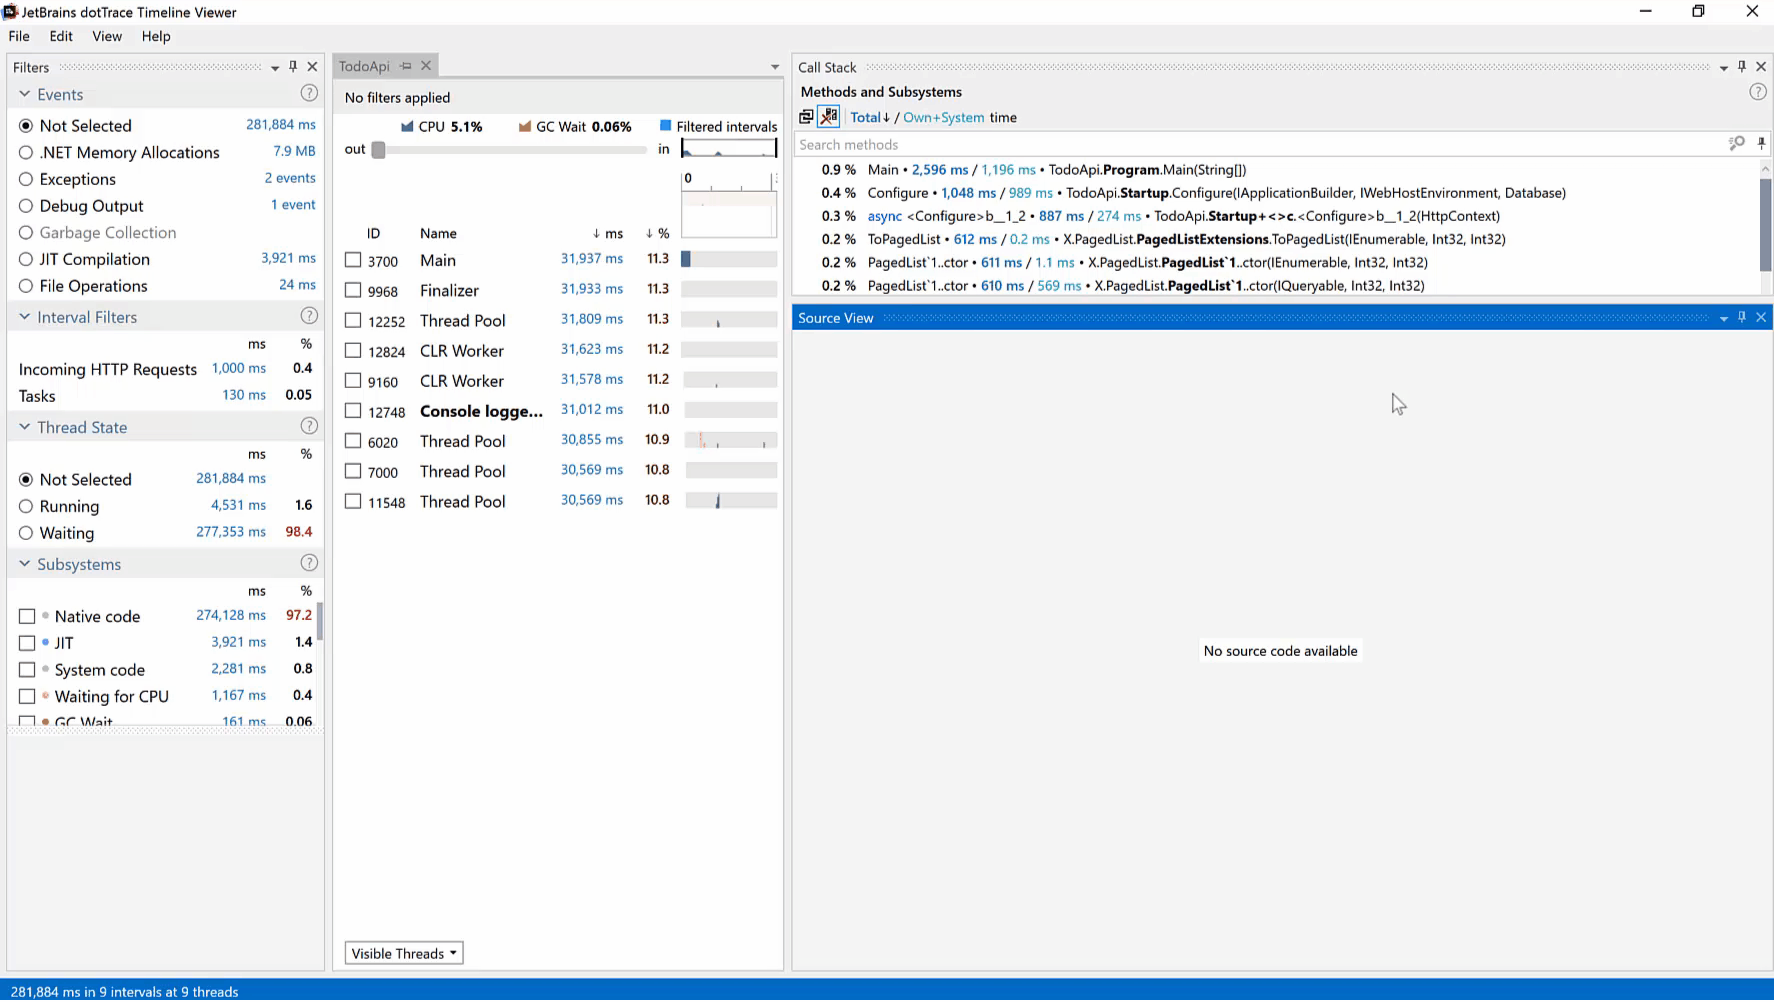
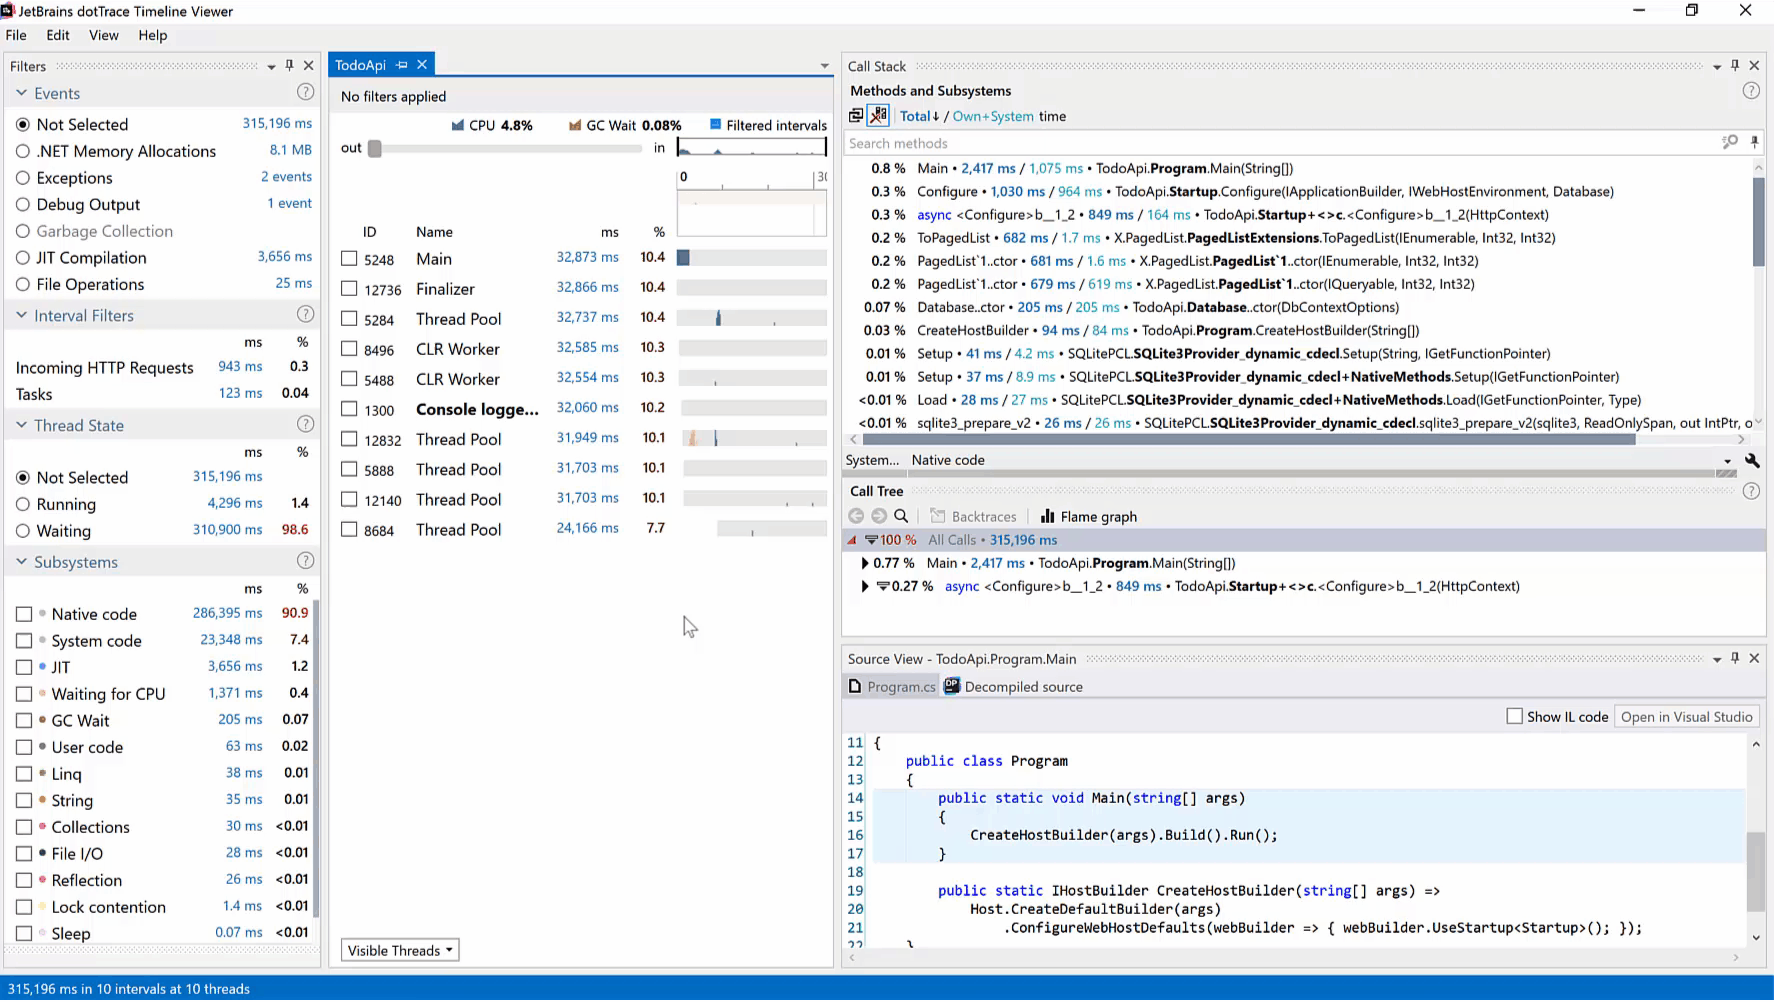
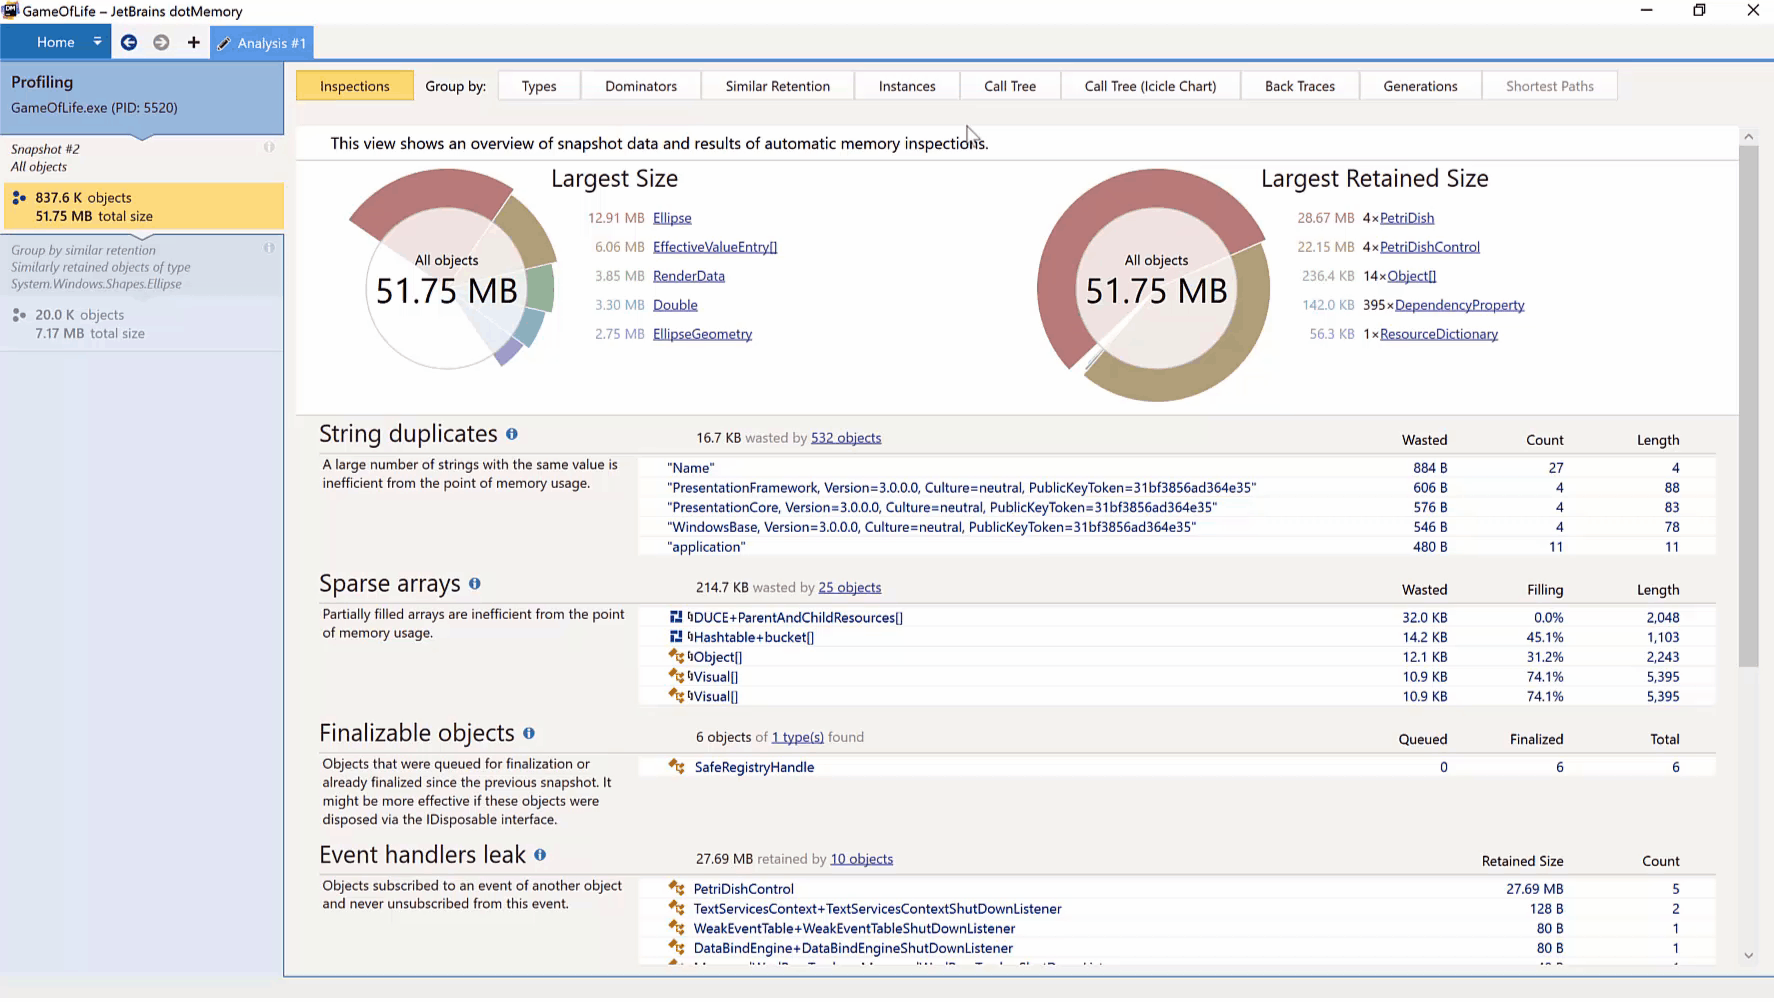
Profiling

Profiling

Analyze application performance and memory usage.

Detect performance and memory bottlenecks in a variety of .NET and .NET Core applications.

See Also

playlist

JetBrains .NET Day Online 2023
Session recordings of JetBrains .NET Day Online 2023.

YouTube

F# for Performance Critical Code
Matthew Crews

playlist

JetBrains .NET Days Online 2022
Session recordings of JetBrains .NET Days Online 2022.

tip

Automatic Inspections
Detect common memory issues - automatically.

tip

Preview Source Code
Introduce variables the way you like!

tip

Profile an HTTP request
What happens when an HTTP request is made?

tip

Object Retention
Inspect retention paths for an instance or a group of objects.

Part of tutorial

Writing and Running Unit Tests with ReSharper
Run, debug and profile tests, do continuous testing, and inspect code coverage.

tutorial

Profiling in Rider
Explore performance and memory profiling options in Rider, and optimize an existing application.

Part of tutorial

Introduction to Profiling in Rider
Let's run a first profiling session on a Sudoku solver sample application.

Part of tutorial

Conclusion - Profiling in Rider
What have we learned? Profiling, profiler modes, optimizing code, DPA, and more. Let's summarize!

Part of tutorial

Profiling Modes
What are the differences between Sampling, Tracing, Line-by-Line, and Timeline profiling?

Part of tutorial

Optimize Performance with Rider
Let's try to optimize the Sudoku solver by profiling, and then optimizing code based on the performance snapshot.

Part of tutorial

Dynamic Program Analysis (DPA)
Rider automatically analyzes memory of your applications, all the time!