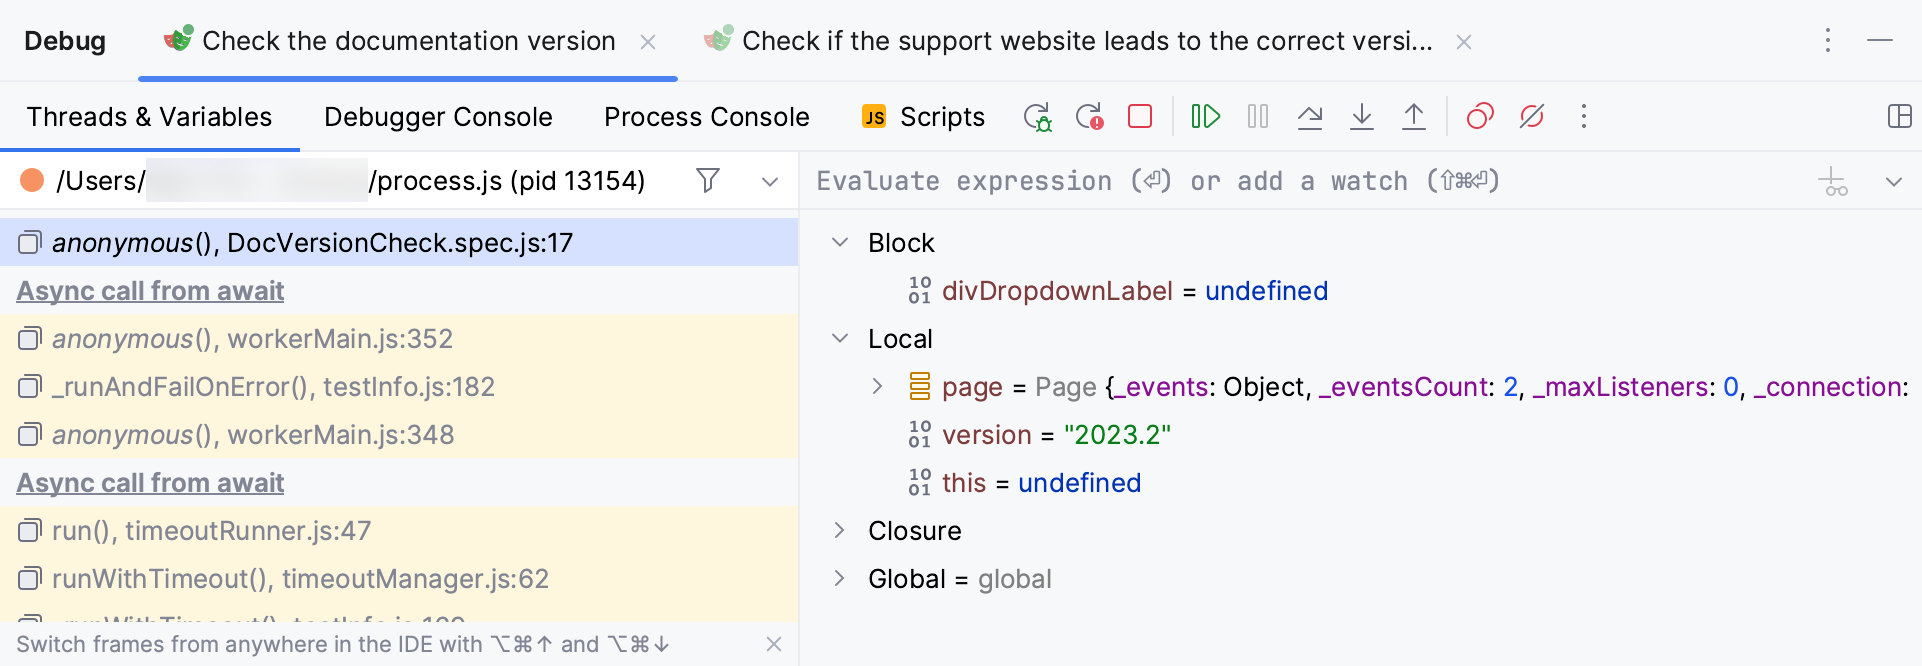
Debug tool window
When you start a debugger session, the Debug tool window opens. Use this window to control the debugger session, view and analyze the program data (frames, threads, variables, and so on), and perform debugger actions.

Sessions
The available debug sessions are separated into tabs in the top part of the Debug tool window.

All the information in the editor, like inline variable values and execution point, is shown for the selected session tab. This is important if you are running several debug sessions in parallel that use the same classes.
When you close a tab, the corresponding debug session terminates.
Tabs
The Debug tool window shows the following tabs and panes for each session:
Threads & Variables: this tab comprises several panes that display information about threads, frames, watches, and variables.

Console: displays the program output.

For local sessions, the tab works the same as when you just run the program without the debugger attached. The only difference is that debugger output (for example, log messages from breakpoints) is added to the console.
When you attach to a process, the program output is not redirected and only the debugger output is shown in the debugger console.
Process Console: Aqua opens this tab when you are debugging a Node.js application. The tab shows the output of the node process itself, that is, everything that is written to process.stdout and process.stderr directly or is logged using console.*.

Debugger Console: Aqua opens this tab when you are debugging a Node.js application. Here you can run JavaScript code snippets and view the console.* messages.

Scripts: during a JavaScript debugging session, the tab shows all the external resources that are automatically downloaded during the JavaScript code execution. Use this tab to monitor downloading the external resources. To open the code of a resource in the editor, double-click the item in question.

Switch tabs
To cycle through the tool window tabs, press Alt+Right and Alt+Left.
Show/hide tabs
Click
and select which tabs you want to see.

Restore default layout
If you changed the layout of the Debug tool window and don't like the new arrangement, you can revert it to the default state.
Click
in the top-right corner of the Debug tool window, then click Restore Default Layout.
Move tabs
You can arrange the tabs to fit your preference. You can move a tab to another location or group a tab with another tab, so that they share the same space on the screen.
Drag the tab header to the desired location. The blue frame indicates the destination.