Configuring Debugger Options
On this page:
Introduction
CLion supports debugging for C/C++ executables using GDB. CLion provides you with the bundled version of GDB, but you can use any compatible GDB version installed on your platform.
Configuring debugger settings
To configure settings required for debugging, perform the following general steps
- In the Project Structure, configure the roots, dependencies and libraries to be passed to the interpreter.
- In the Toolchains Dialog Box, check up the actual GDB executable: bundled or specific. Change the current setting, if required.
- In the Settings/Preferences dialog box, configure the debugger options:
- Under the Build, Execution and Deployment, click Debugger, and define the debugger options as required.
Adjusting GDB start-up time out value
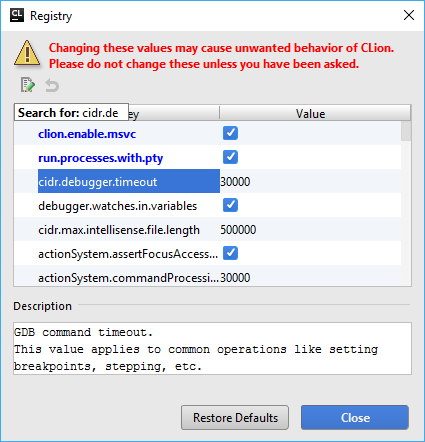
As it is known, there exists delay between the program launch and start of its execution. This time is needed to allocate code in memory, load and deploy program's components, libraries, data, etc. For that reason, start of GDB follows the program's launch after some time out as well. The value of that time out is predefined in CLion IDE (30000 milliseconds). However, for massive projects this value can be insufficient. You can adjust it to fit exactly your project. To change the time out value for GDB to start, do the following:
- Go to the main menu option and type registry.
- In the dialog that opens, start typing cidr.debugger.timeout. Click the Value field of the highlighted string and enter here the timeout value in milliseconds.

- Click Close button to apply changes.