Remote Debug
Basics
CLion supports remote debug with GDB/gdbserver. That means that having executable running on one machine under gdbserver, you can connect to it with the GDB from CLion from another machine and inspect the code using all the benefits of CLion’s debugger UI: set breakpoints from the IDE, view variable values, evaluate expressions and more.
Since the bundled GDB in CLion is built with multi-arch support, it can be used for remote cross-platform debug in various Linux/Windows/macOS and embedded cases.
Remote targets supported by the bundled GDB
i686-pc-mingw32
i686-w64-mingw32
x86_64-w64-mingw32
i686-linux-gnu
x86_64-linux-gnu
aarch64-linux-gnu
alpha-linux-gnu
arm-linux-gnu
arm-linux-gnueabi
arm-linux-gnueabihf
hppa-linux-gnu
ia64-linux-gnu
m68k-linux-gnu
m68k-rtems
mips-linux-gnu
mipsel-linux-gnu
mips64-linux-gnu
mips64el-linux-gnu
powerpc-linux-gnu
powerpc-linux-gnuspe
Remote GDB debug
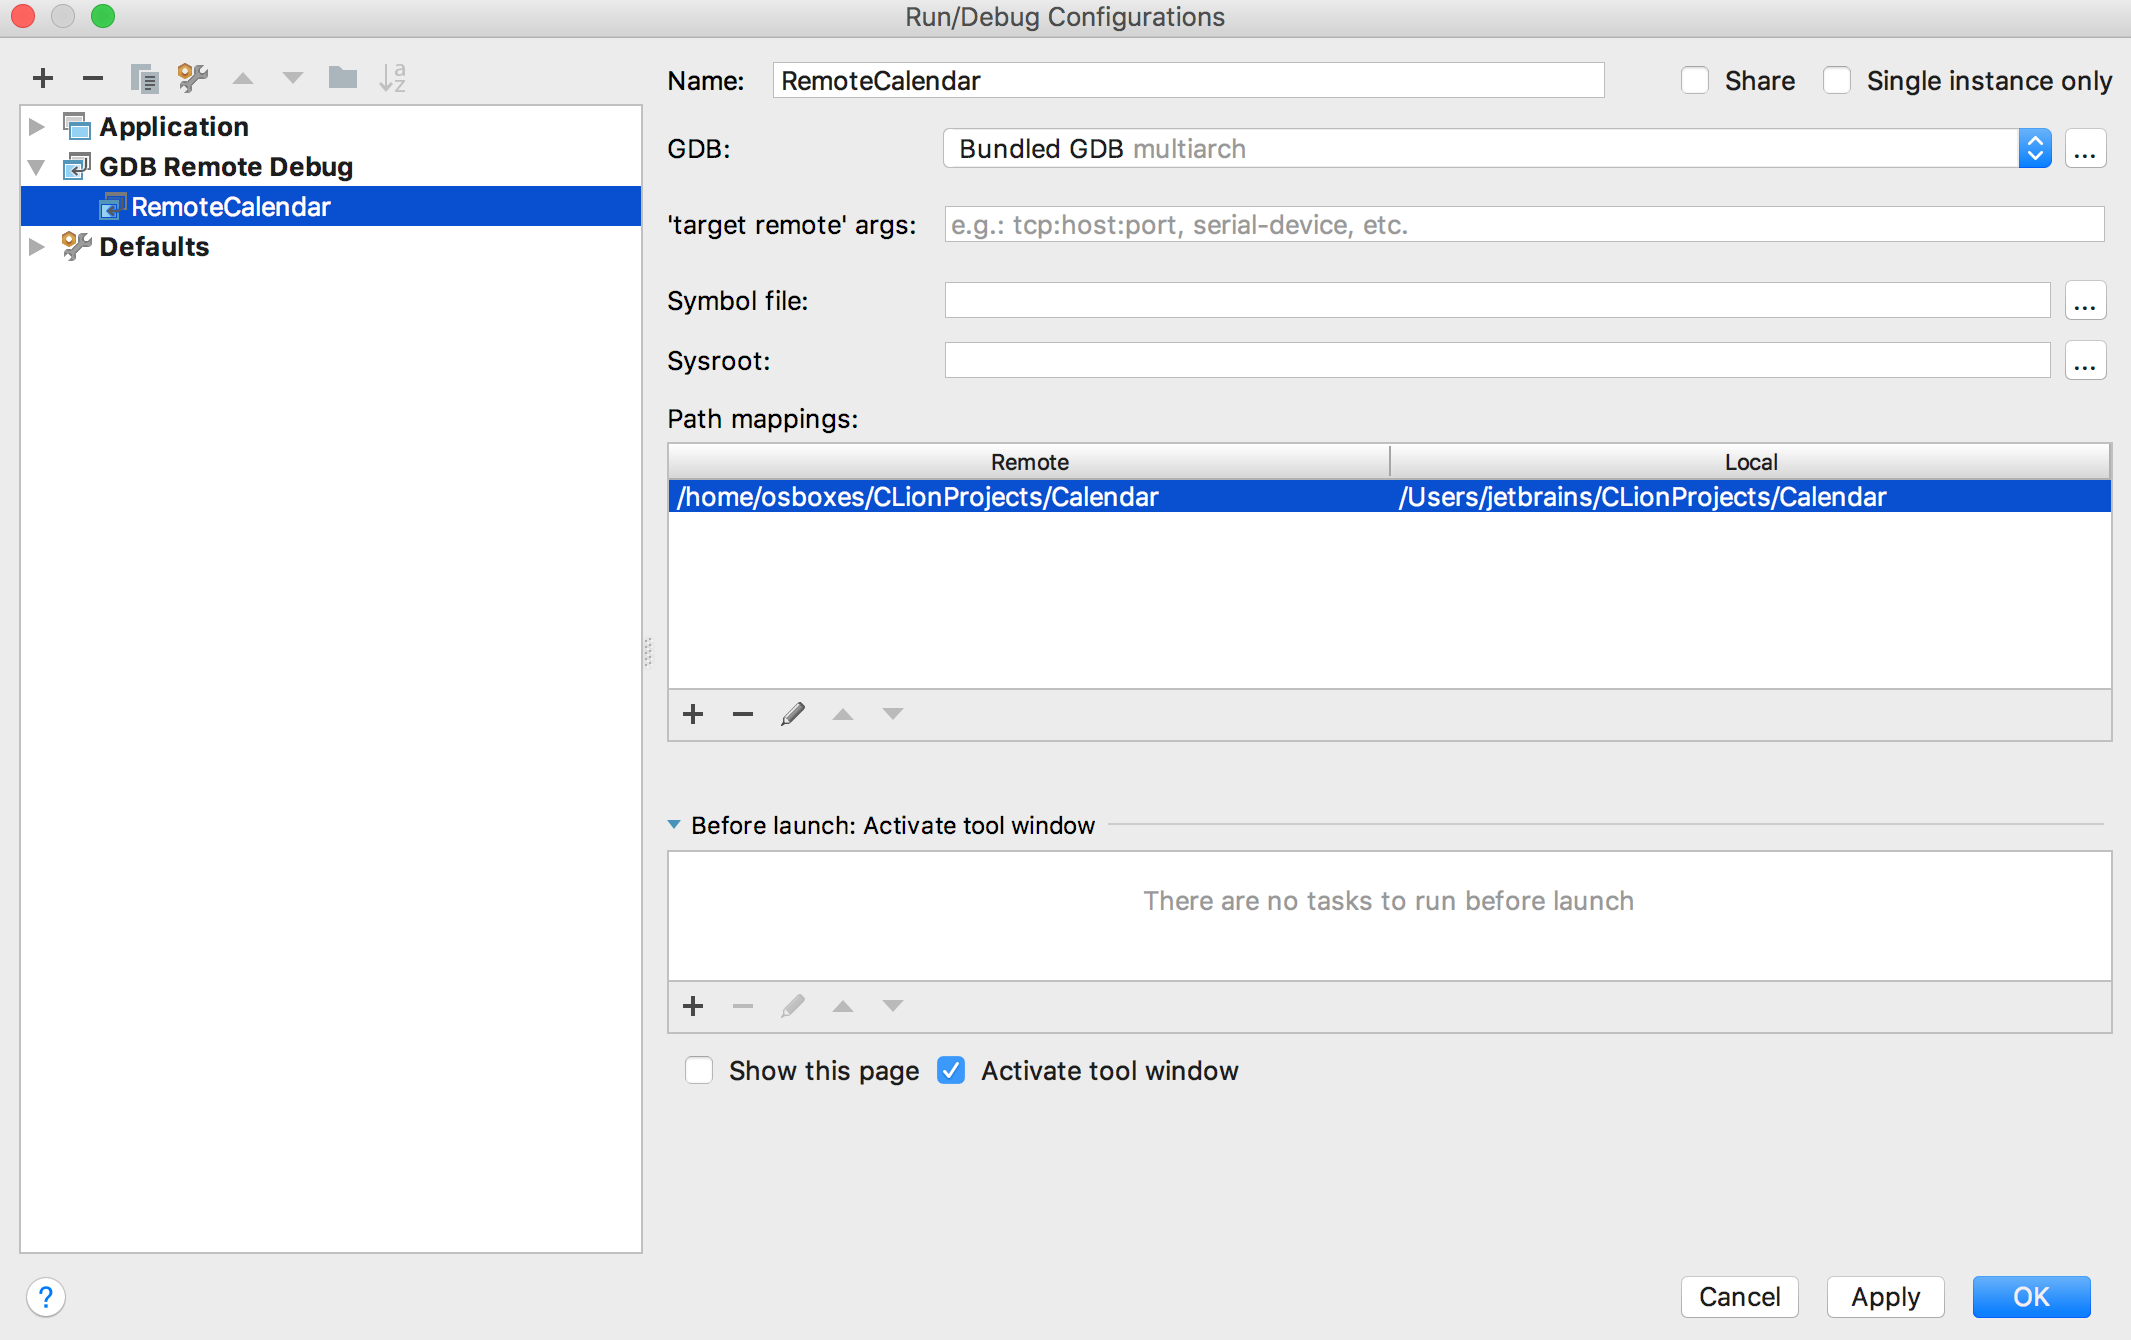
Before starting the debug session, you need to create a Remote GDB Run/Debug configuration: 
Launching the remote GDB debug session
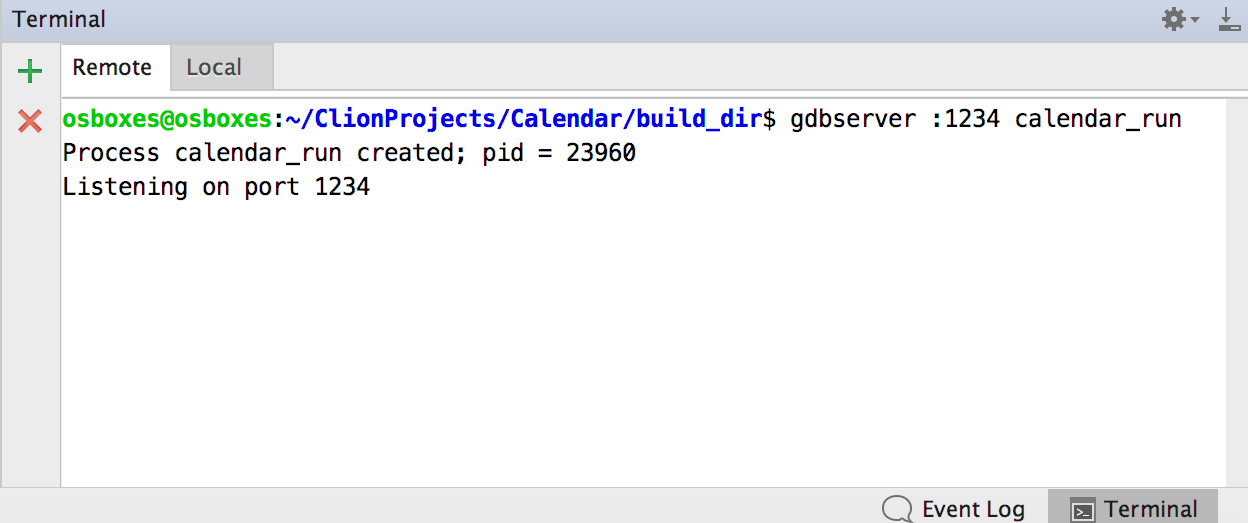
- Run an executable on target system under gdbserver. For example, you can use the built-in terminal to access the remote host:

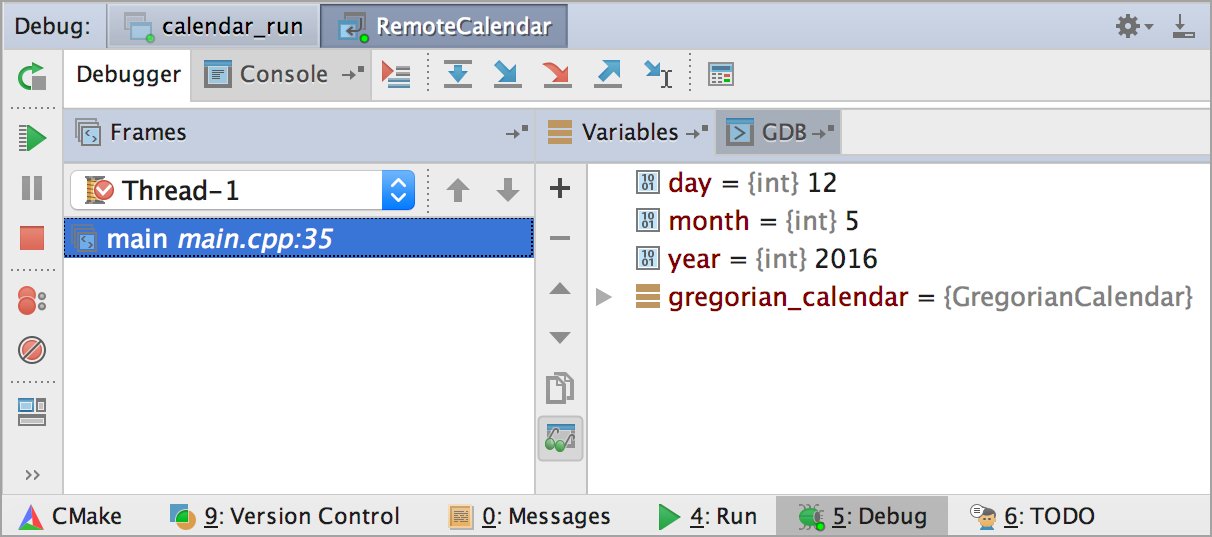
- Then launch the remote Run/Debug configuration in CLion:

Last modified: 24 July 2018