Running and Debugging Node.js
CLion helps you run and debug your Node.js applications. You can debug applications that are started from CLion as well as attach to already running applications.
Before you start
Install and enable the NodeJS plugin. The plugin is not bundled with CLion, but it can be installed from the JetBrains plugin repository as described in Installing, Updating and Uninstalling Repository Plugins and Enabling and Disabling Plugins.
Debugging a Node.js application
CLion makes it easier to debug Node.js applications. You can put breakpoints right in your JavaScript or TypeScript code so you no longer need any debugger and console.log() statements. You can do many things that will help you explore the code and understand where the bug is. In the Debug tool window, you can view the call stack and the variables in their current state, evaluate expressions in the editor, and step through the code.
Local and Remote debugging
CLion supports two debugging modes:
- Local debugging: in this mode, your application is started from CLion and is running locally on your computer. To debug it, use a Node.js configuration.
- Debugging a remote application: in this mode, your application is running in a remote environment in the debug mode and CLion attaches to a running process. CLion recognizes
--inspectand--debugflags so you can make any application accessible for remote debugging. CLion supports remote debugging with the Chrome Debugging Protocol and the V8 Debugging Protocol (also known as Legacy Protocol). In either case, a debugging session is initiated through a run/debug configuration of the type Attach to Node.js/Chrome.
Debugging a Node.js application locally
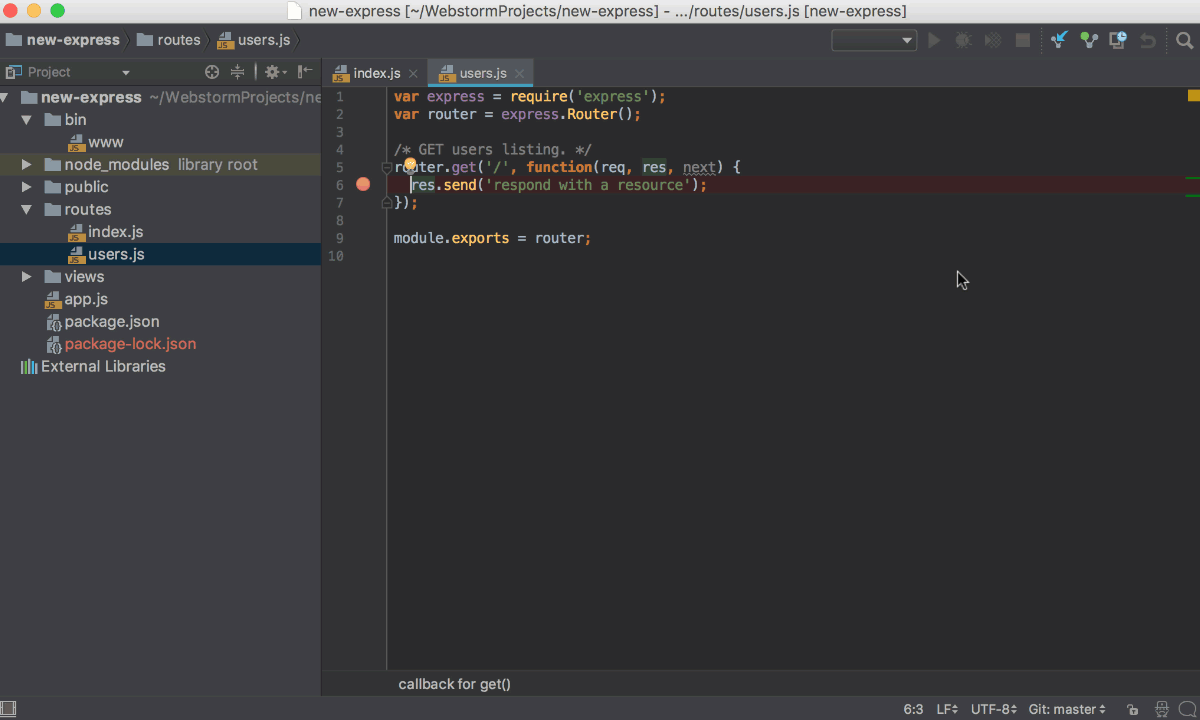
- Set the breakpoints in the Node.js code where necessary.
- Create a Node.js run/debug configuration. If necessary, CLion can generate a JavaScript Debug configuration and start it automatically together with the Node.js configuration.
- Choose the newly created Node.js configuration in the Select run/debug configuration drop-down list on the toolbar and click
 next to it. The Debug Tool Window opens.
 - Perform the steps that will trigger the execution of the code with the breakpoints.
- Switch to CLion, where the controls of the Debug tool window are now enabled. Proceed with the debugging session — step through the breakpoints, switch between frames, change values on-the-fly, examine a suspended program, evaluate expressions, and set watches.
Using interactive Debugger Console
When you are debugging a Node.js application, CLion shows two console tabs in the Debug tool window - Console and Debugger Console.
- The Console tab shows the output of the node process itself, that is, everything that is written to process.stdout and process.stderr directly or is logged using console.*.

- The Debugger Console lets you execute JavaScript code, view the console.log messages, jump to the location where
console.logwas called, and use other console features provided by the Chrome Debugging Protocol.
Node.js multiprocess debugging
CLion supports debugging additional Node.js processes that are launched by the child_process.fork() method or by the cluster module. Such processes are shown as threads in the Frame pane on the Debugger tab of the Debug Tool Window.
- Set the breakpoints in the processes to debug.
- Create a Node.js run/debug configuration.
- Choose the newly created configuration in the Select run/debug configuration drop-down list on the tool bar and click Debug .
The Debug Tool Window opens and the Frames drop-down list shows the additional processes as threads as soon as they are launched:

To examine the data (variables, watches, etc.) for a process, select its thread in the list and view its data in the Variables and Watches panes. When you select another process, the contents of the panes are updated accordingly.