Debugger Options
CLion supports debugging for C/C++ executables using bundled LLDB and bundled or custom GDB.
To configure the settings required for debugging
In the Project view, configure roots, dependencies and libraries.
In the Debugger section of the Toolchains Dialog, choose the desired debugger.
In Debugger settings dialog of the Settings / Preferences | Build, Execution and Deployment menu, configure the debugger options.
Adjusting GDB start-up time out value
As it is known, there exists a delay between the program launch and the start of its execution. This time is required for code allocation in memory, loading and deploying program's components, libraries, and data. Due to that, the start of GDB follows the program's launch after a delay as well. The value of that time out is predefined in CLion (30000 milliseconds), however you can adjust it for the needs of your project.
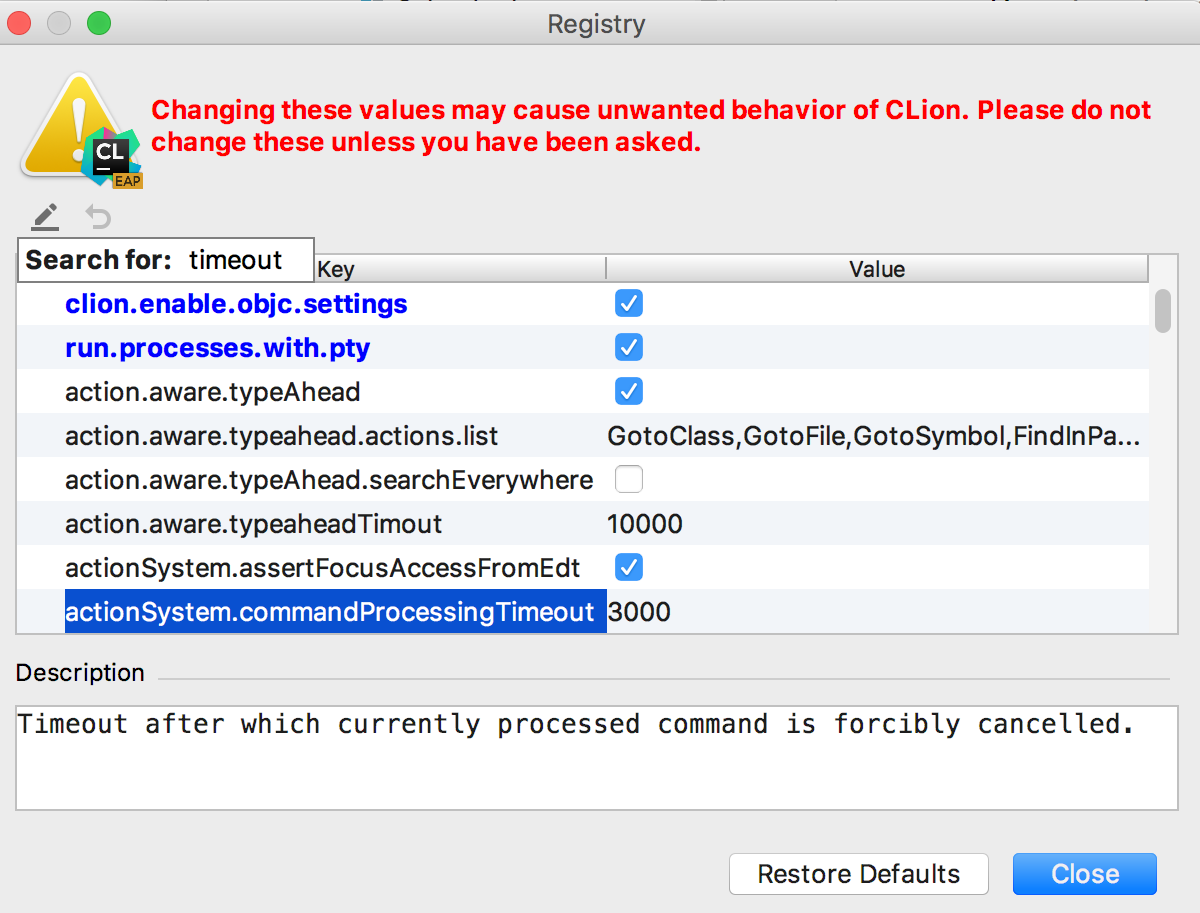
To change the time out value GDB
Go to the main menu option and type registry.
In the dialog that opens, start typing timeout. Click the Value field of the highlighted string and enter the timeout value in milliseconds.

Click Close button to apply the change.
Configuring external GDB console on Windows
On Windows with GDB versions prior to 8.0, a separate console is used for application input/output. For newer GDB versions, the output is redirected to CLion console by default. However, you can easily switch back to opening an external output window by enabling the cidr.debugger.gdb.workaround.windows.forceExternalConsole key in the Registry (open the Find Action dialog, search for Registry, and start typing the key name).