Database diagrams
Enable the Database Tools and SQL plugin
This functionality relies on the Database Tools and SQL plugin, which is bundled and enabled in CLion by default. If the relevant features are not available, make sure that you did not disable the plugin.
Press Ctrl+Alt+S to open settings and then select .
Open the Installed tab, find the Database Tools and SQL plugin, and select the checkbox next to the plugin name.
Enable the Diagrams plugin
This functionality relies on the Diagrams plugin, which is bundled and enabled in CLion by default. If the relevant features are not available, make sure that you did not disable the plugin.
Press Ctrl+Alt+S to open settings and then select .
Open the Installed tab, find the Diagrams plugin, and select the checkbox next to the plugin name.
Database diagrams graphically show the structure of the database and relations between database objects. You can generate a diagram for a data source, a schema, or a table. To create relations between database objects, consider using primary and foreign keys.
You can save the generated diagrams in two formats: UML and PNG. The UML format is an internal format developed specifically for CLion. It is not supported by other products. If you want to share the created diagram, consider using PNG.
Also, you can build execution plans. An execution plan is a set of steps that were used to access data in a database. For more information about creating an execution plan, refer to Visualize a query plan.
Generate a diagram for a database object
In the Database tool window, right-click a database object and select .
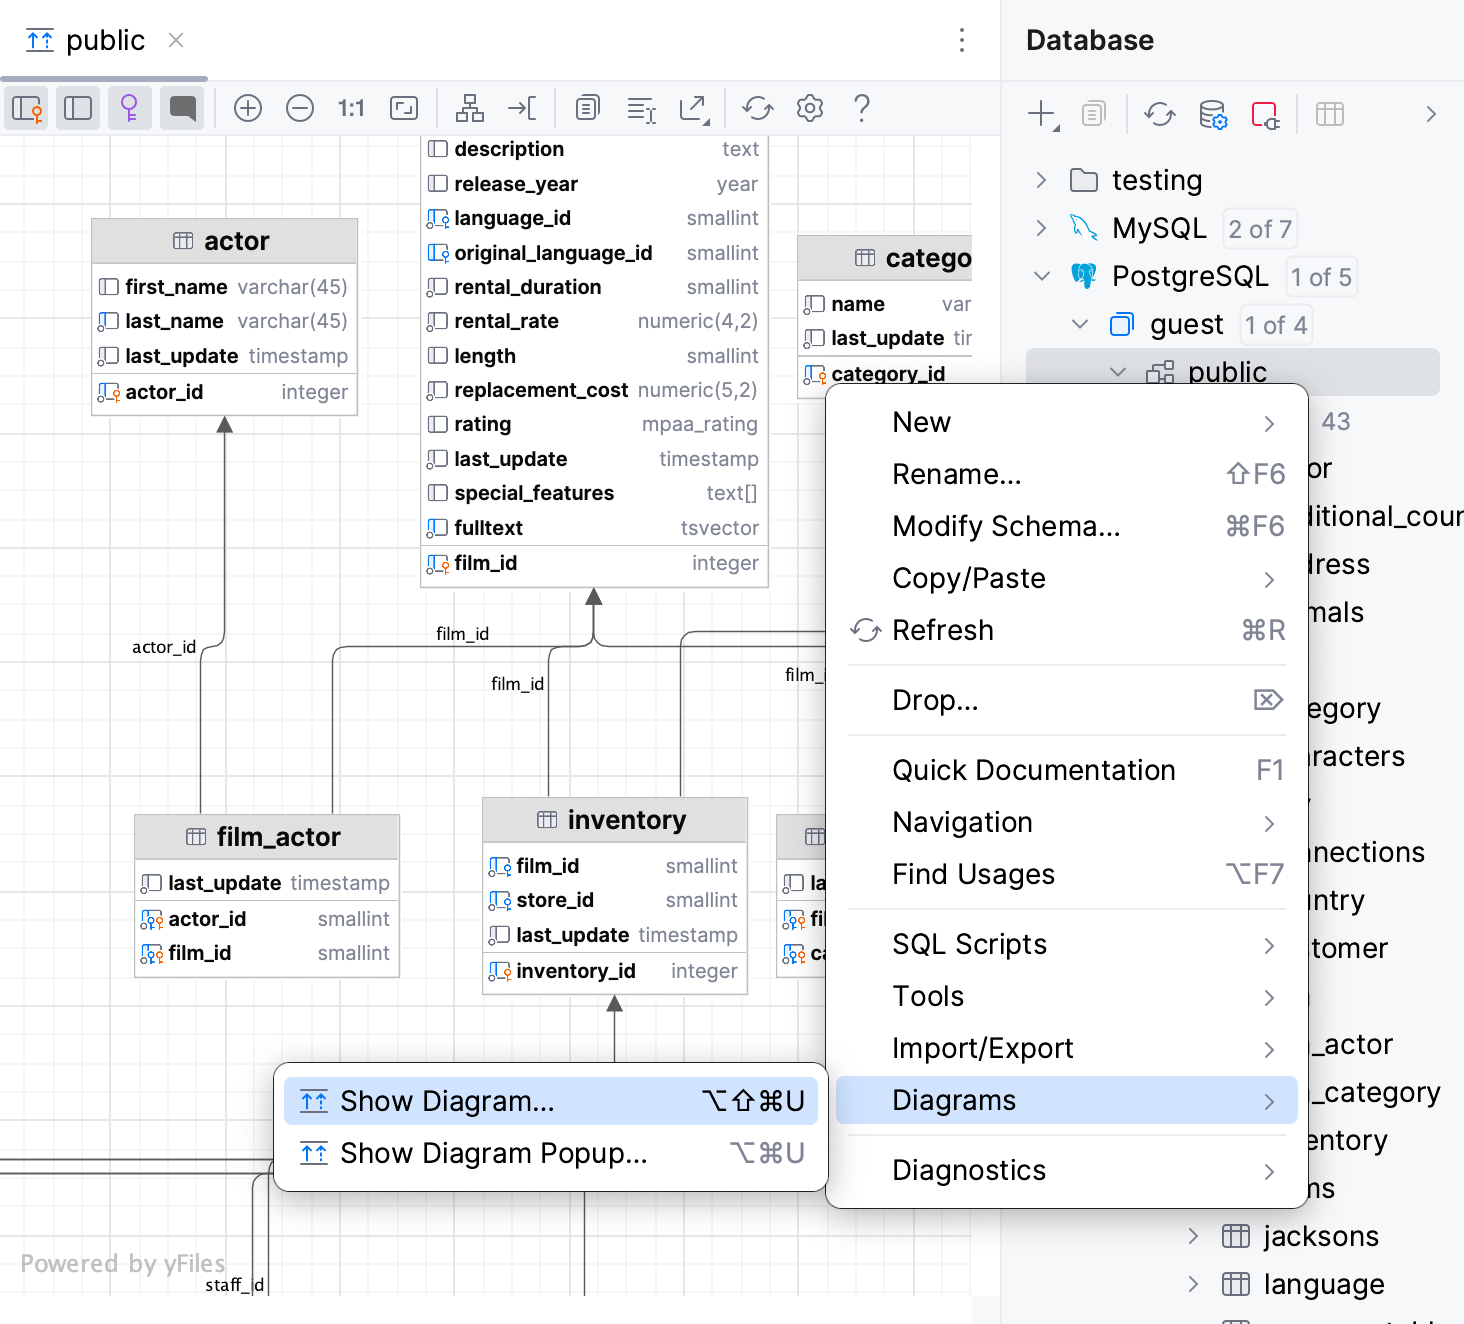
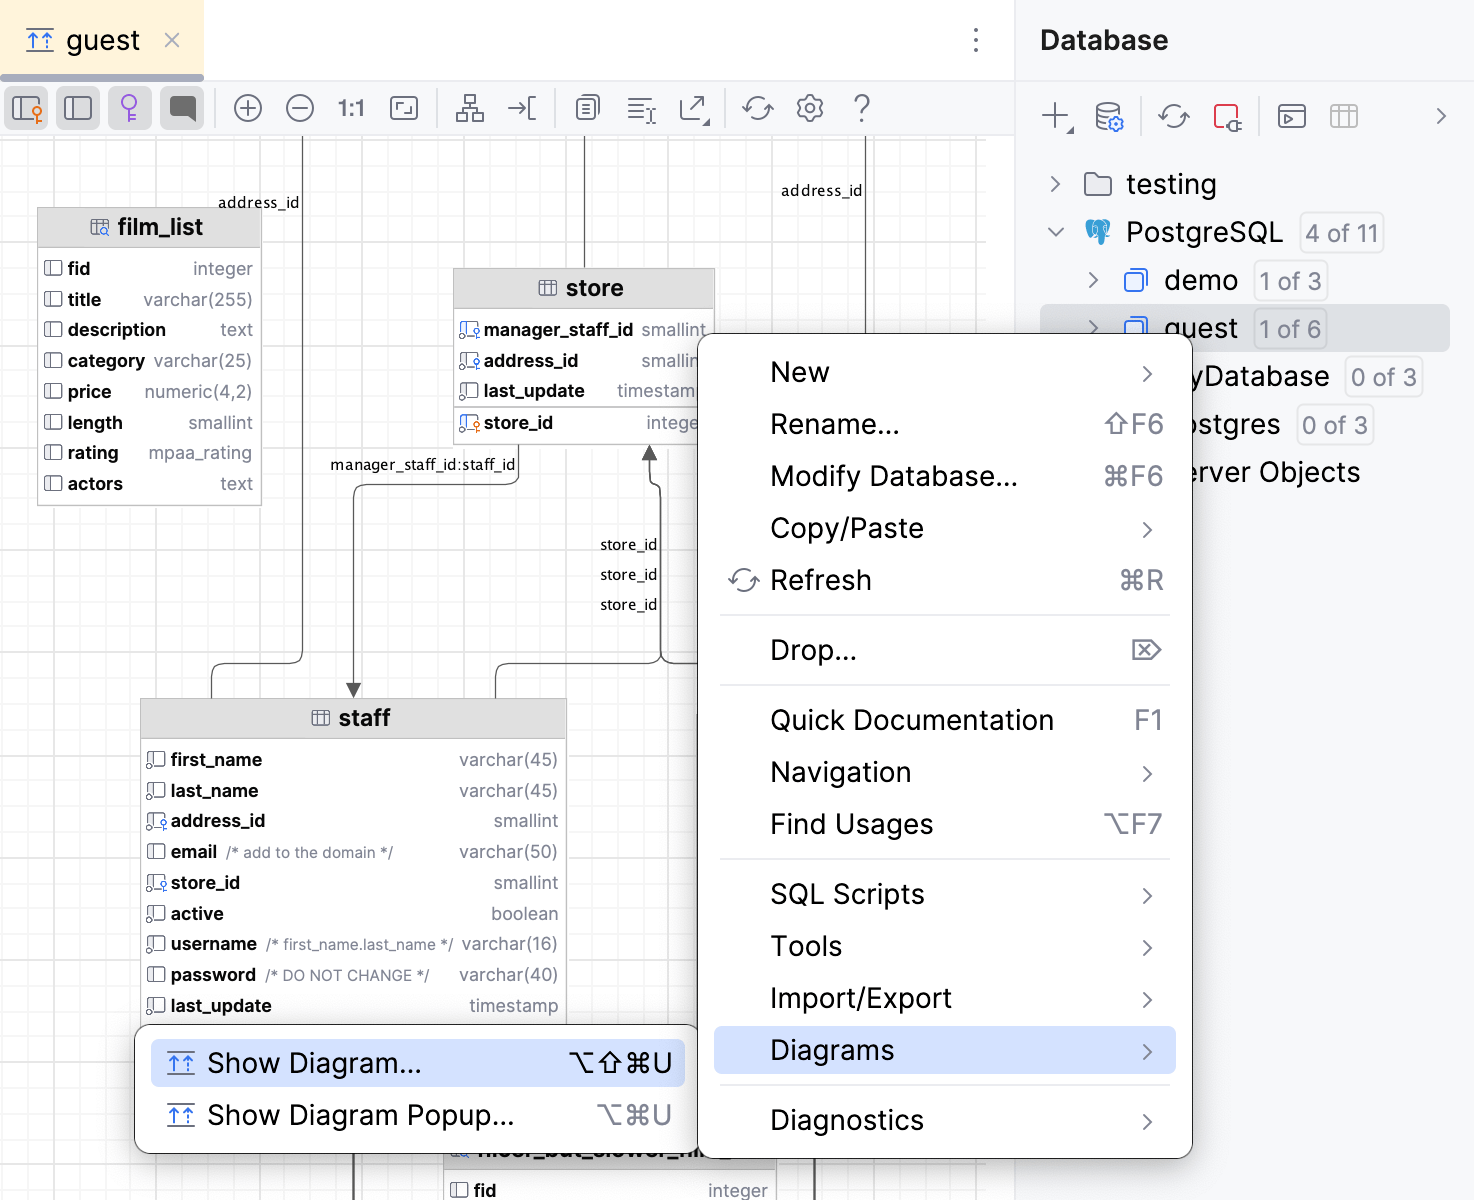
View and manage diagrams
Pan and zoom
To pan and zoom the diagram, use your touchpad, scroll bars or the mouse wheel for vertical scrolling and Shift + mouse wheel for horizontal scrolling. You can also use Shift + mouse wheel for zooming.
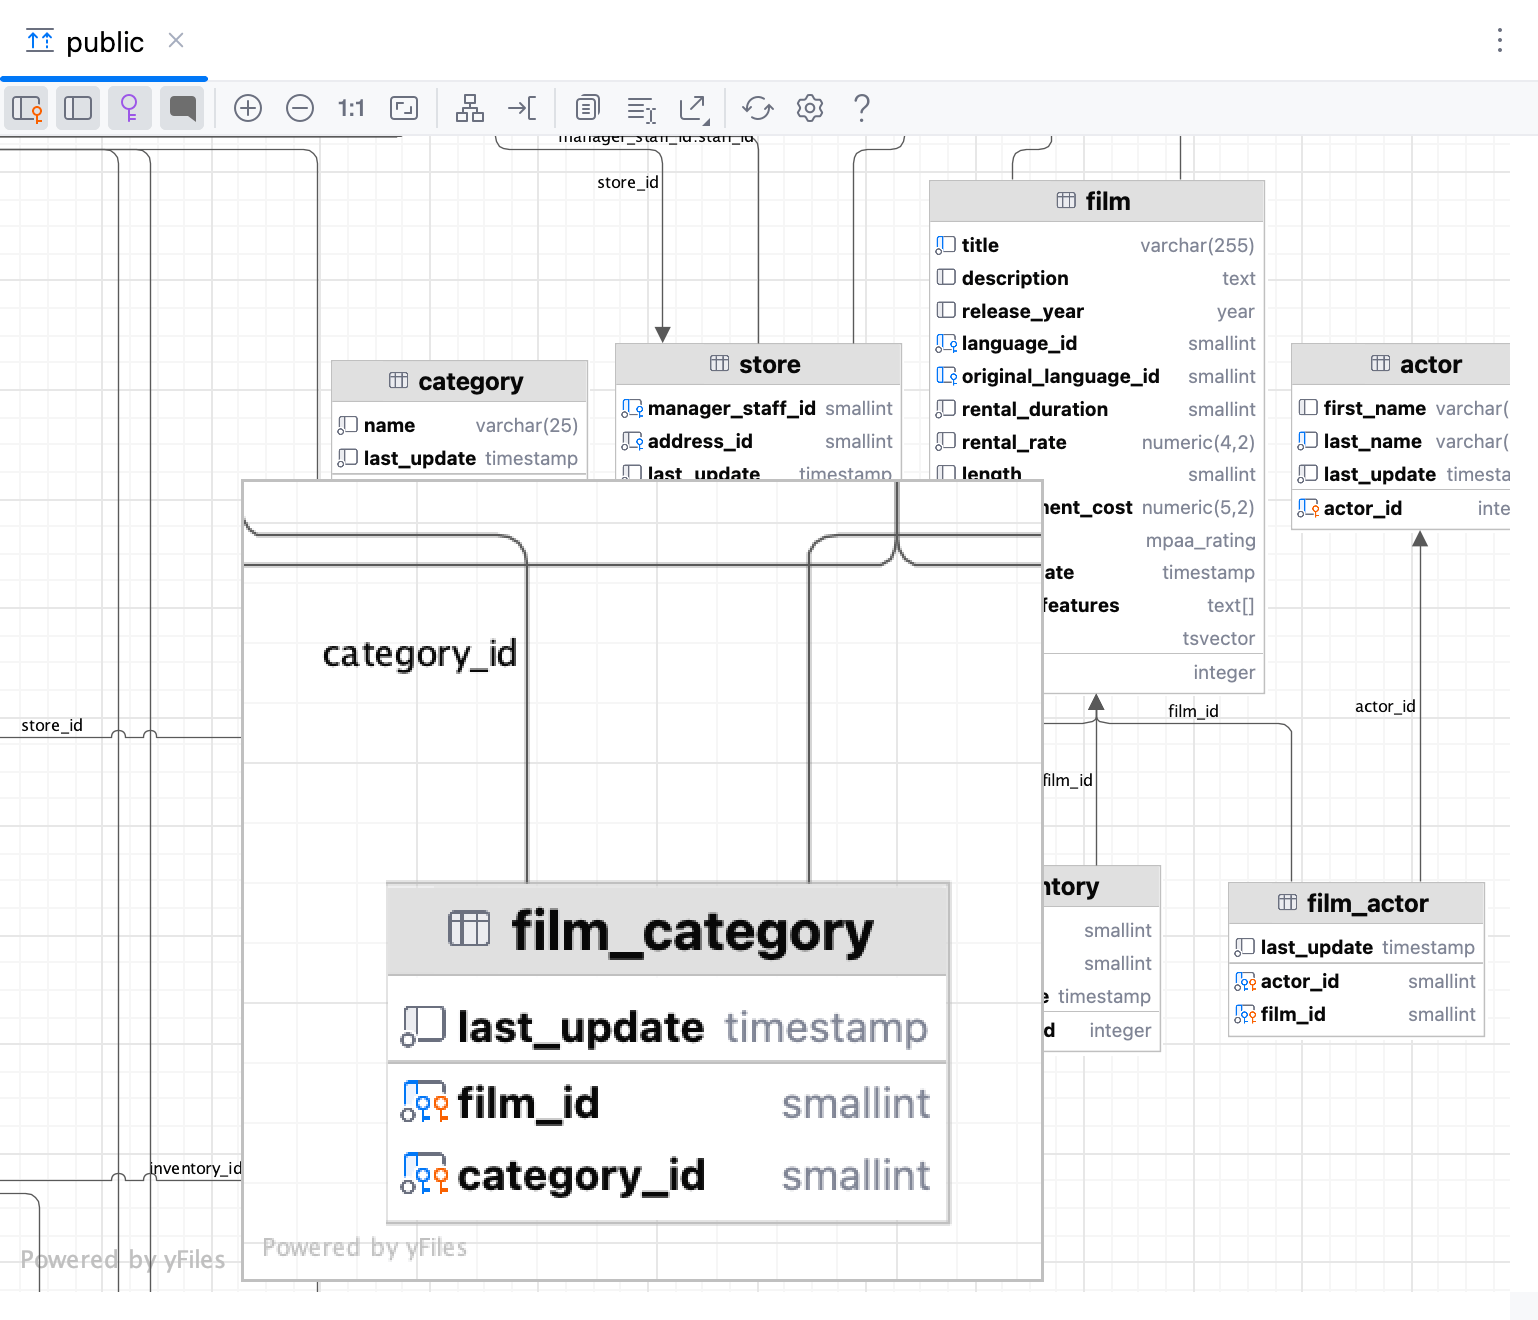
To use the magnifier tool, keep the Alt key pressed and hover over the desired areas of the diagram. Use the mouse wheel to extra zoom the diagram area within the magnifier tool.
Enable column comments
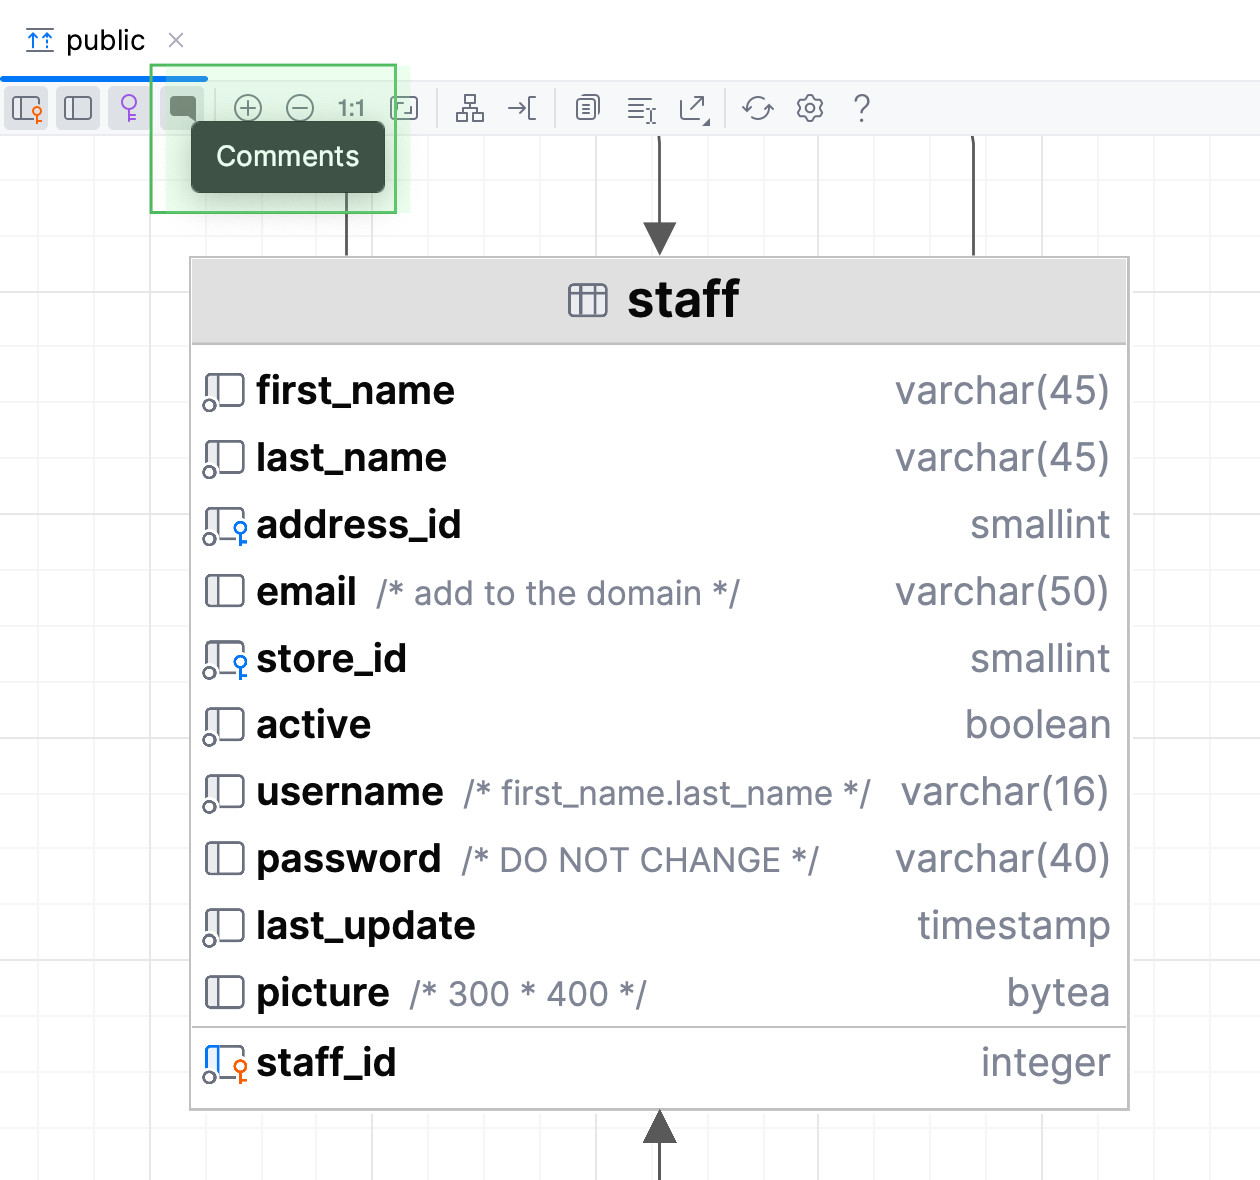
Generate a diagram. For more information about generating a diagram, refer to Generate a diagram for a database object.
Click the Comments button (
).
Apply colors to diagram objects
In the Database tool window, right-click an object and select .
Select a color and click OK. Refresh the diagram to apply the color by clicking the Refresh button ().
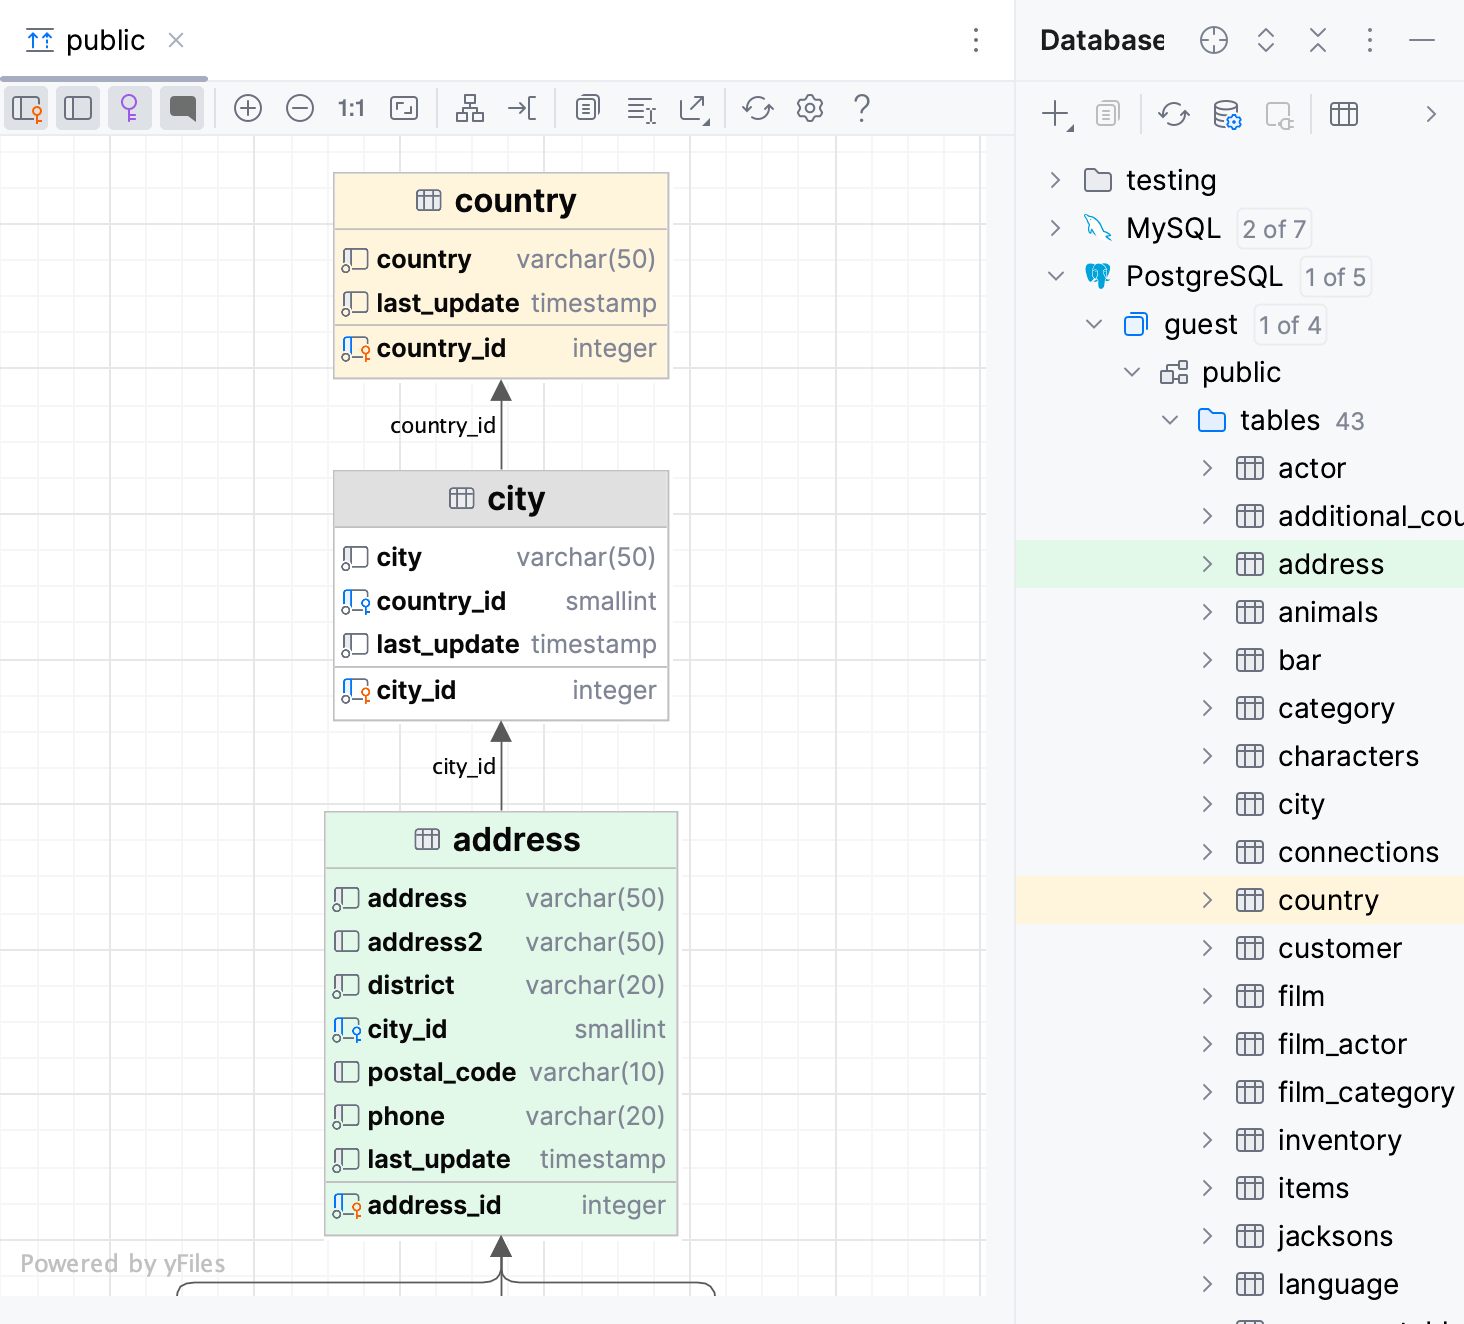
Find diagram elements
To locate your element on the diagram, do the following:
Press Ctrl+F to open the Diagram Elements popup window.
Start typing the name of the element, select it, and press Enter.
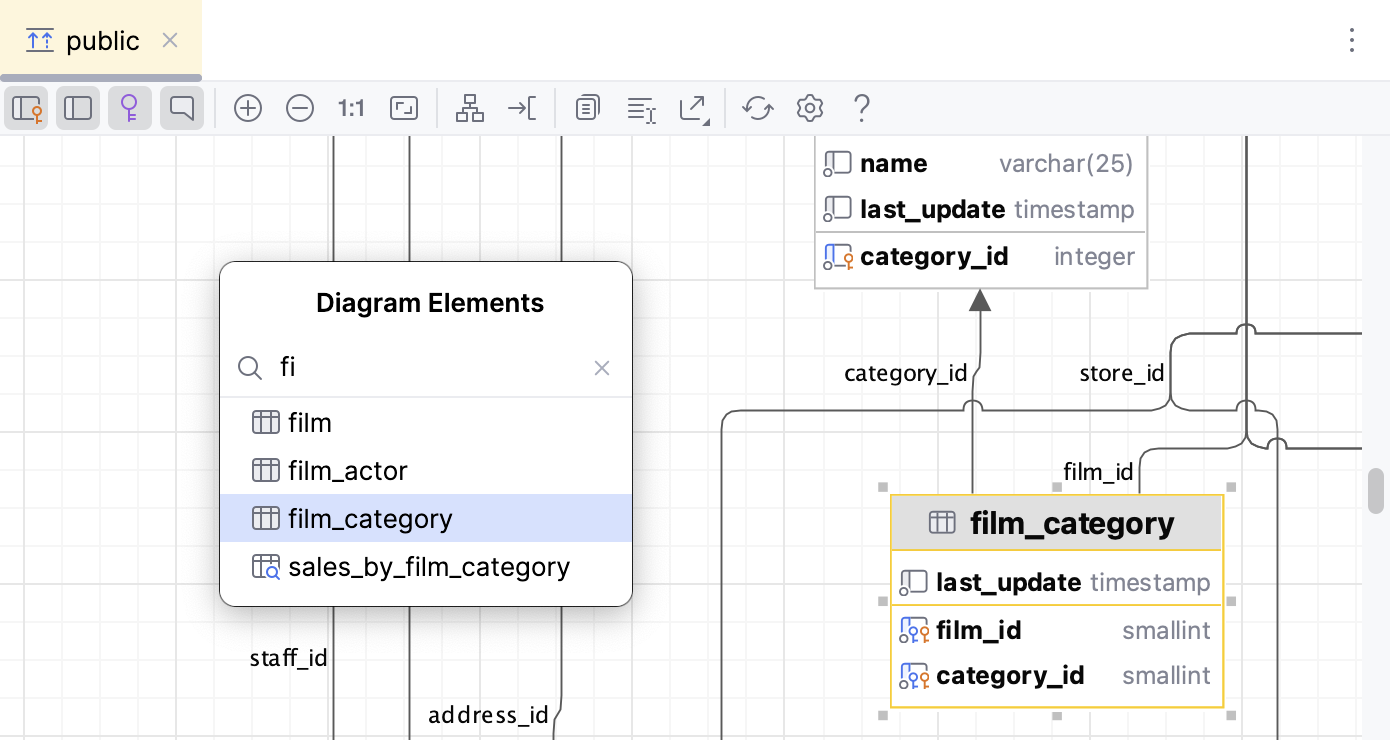
Export diagrams
In CLion, you can export a diagram in various formats to a file, to clipboard, and open it in a web editor. You can also print a diagram and save it as an image. To do that, use the corresponding actions in the context menu of your diagram.
Open diagrams in web editors
To export your diagram to a third-party editor in web browser, right-click the diagram, navigate to , and select the editor.
Alternatively, click the Export Diagram button (
) on the diagram toolbar, and select the editor in the corresponding submenu.
The supported editors are as follows:
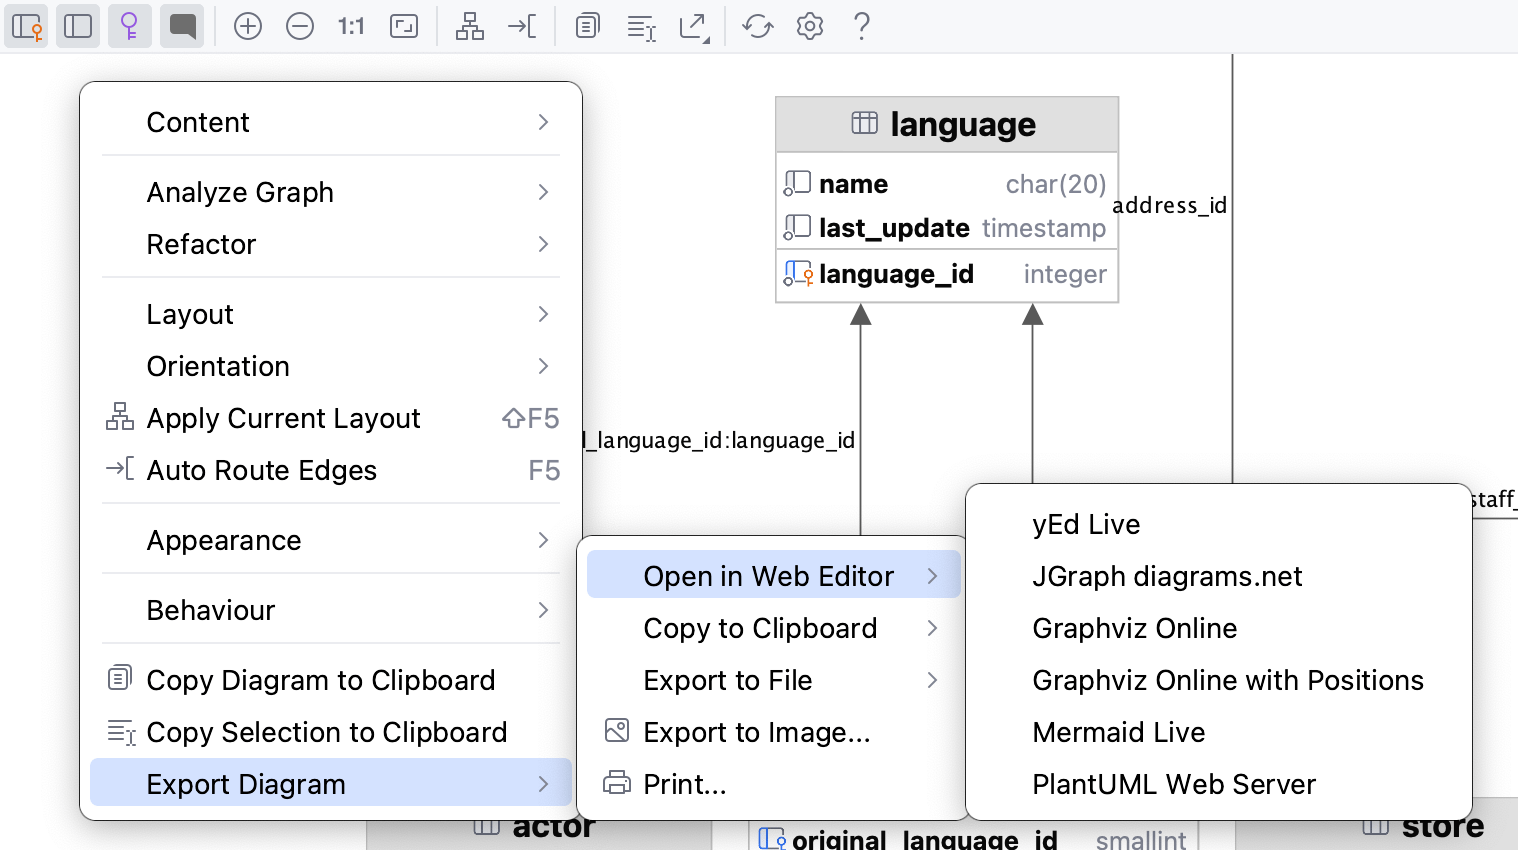
Copy diagrams to clipboard
To copy your diagram to clipboard, right-click the diagram, navigate to , and select the format.
Alternatively, click the Export Diagram button (
) on the diagram toolbar, and select the format in the corresponding submenu.
The supported formats are as follows:
Mermaid
classDiagram direction BT class actor { varchar(45) first_name varchar(45) last_name timestamp last_update smallint unsigned actor_id } class node19 { smallint unsigned actor_id varchar(45) first_name varchar(45) last_name timestamp last_update blob column_nameimg } class actor_info { smallint unsigned actor_id varchar(45) first_name varchar(45) last_name text film_info } class address { varchar(50) address varchar(50) address2 varchar(20) district smallint unsigned city_id varchar(10) postal_code varchar(20) phone timestamp last_update smallint unsigned address_id } class category { varchar(25) name timestamp last_update tinyint unsigned category_id } class city { varchar(50) city smallint unsigned country_id timestamp last_update smallint unsigned city_id } class country { varchar(50) country timestamp last_update smallint unsigned country_id } class customer { tinyint unsigned store_id varchar(45) first_name varchar(45) last_name varchar(50) email smallint unsigned address_id tinyint(1) active datetime create_date timestamp last_update smallint unsigned customer_id } class customer_list { smallint unsigned ID varchar(91) name varchar(50) address varchar(10) zip code varchar(20) phone varchar(50) city varchar(50) country varchar(6) notes tinyint unsigned SID } class film { varchar(255) title text description year release_year tinyint unsigned language_id tinyint unsigned original_language_id tinyint unsigned rental_duration decimal(4,2) rental_rate smallint unsigned length decimal(5,2) replacement_cost enum('g', 'pg', 'pg-13', 'r', 'nc-17') rating set('trailers', 'commentaries', 'deleted scenes', 'behind the scenes') special_features timestamp last_update smallint unsigned film_id } class film_actor { timestamp last_update smallint unsigned actor_id smallint unsigned film_id } class film_category { timestamp last_update smallint unsigned film_id tinyint unsigned category_id } class film_text { varchar(255) title text description smallint film_id } class inventory { smallint unsigned film_id tinyint unsigned store_id timestamp last_update mediumint unsigned inventory_id } class language { char(20) name timestamp last_update tinyint unsigned language_id } class payment { smallint unsigned customer_id tinyint unsigned staff_id int rental_id decimal(5,2) amount datetime payment_date timestamp last_update smallint unsigned payment_id } class pet { varchar(150) pet varchar(150) name varchar(150) owner } class rental { datetime rental_date mediumint unsigned inventory_id smallint unsigned customer_id datetime return_date tinyint unsigned staff_id timestamp last_update int rental_id } class sales_by_film_category { varchar(25) category decimal(27,2) total_sales } class sales_by_store { varchar(101) store varchar(91) manager decimal(27,2) total_sales } class staff { varchar(45) first_name varchar(45) last_name smallint unsigned address_id blob picture varchar(50) email tinyint unsigned store_id tinyint(1) active varchar(16) username varchar(40) password timestamp last_update tinyint unsigned staff_id } class staff_list { tinyint unsigned ID varchar(91) name varchar(50) address varchar(10) zip code varchar(20) phone varchar(50) city varchar(50) country tinyint unsigned SID } class store { tinyint unsigned manager_staff_id smallint unsigned address_id timestamp last_update tinyint unsigned store_id } address --> city : city_id city --> country : country_id customer --> address : address_id customer --> store : store_id film --> language : original_language_id:language_id film --> language : language_id film_actor --> actor : actor_id film_actor --> film : film_id film_category --> category : category_id film_category --> film : film_id inventory --> film : film_id inventory --> store : store_id payment --> customer : customer_id payment --> rental : rental_id payment --> staff : staff_id rental --> customer : customer_id rental --> inventory : inventory_id rental --> staff : staff_id staff --> address : address_id staff --> store : store_id store --> address : address_id store --> staff : manager_staff_id:staff_idPlantUML
@startuml !theme plain top to bottom direction skinparam linetype ortho class actor { first_name: varchar(45) last_name: varchar(45) last_update: timestamp actor_id: smallint unsigned } class node16 as "actor_1 /* backup table */" { actor_id: smallint unsigned first_name: varchar(45) last_name: varchar(45) last_update: timestamp column_nameimg: blob } class actor_info { actor_id: smallint unsigned first_name: varchar(45) last_name: varchar(45) film_info: text } class address { address: varchar(50) address2: varchar(50) district: varchar(20) city_id: smallint unsigned postal_code: varchar(10) phone: varchar(20) last_update: timestamp address_id: smallint unsigned } class category { name: varchar(25) last_update: timestamp category_id: tinyint unsigned } class city { city: varchar(50) country_id: smallint unsigned last_update: timestamp city_id: smallint unsigned } class country { country: varchar(50) last_update: timestamp country_id: smallint unsigned } class customer { store_id: tinyint unsigned first_name: varchar(45) last_name: varchar(45) email: varchar(50) address_id: smallint unsigned active: tinyint(1) create_date: datetime last_update: timestamp customer_id: smallint unsigned } class customer_list { ID: smallint unsigned name: varchar(91) address: varchar(50) zip code: varchar(10) phone: varchar(20) city: varchar(50) country: varchar(50) notes: varchar(6) SID: tinyint unsigned } class film { title: varchar(255) description: text release_year: year language_id: tinyint unsigned original_language_id: tinyint unsigned rental_duration: tinyint unsigned rental_rate: decimal(4,2) length: smallint unsigned replacement_cost: decimal(5,2) rating: enum('g', 'pg', 'pg-13', 'r', 'nc-17') special_features: set('trailers', 'commentaries', 'deleted scenes', 'behind the scenes') last_update: timestamp film_id: smallint unsigned } class film_actor { last_update: timestamp actor_id: smallint unsigned film_id: smallint unsigned } class film_category { last_update: timestamp film_id: smallint unsigned category_id: tinyint unsigned } class film_text { title: varchar(255) description: text film_id: smallint } class inventory { film_id: smallint unsigned store_id: tinyint unsigned last_update: timestamp inventory_id: mediumint unsigned } class language { name: char(20) last_update: timestamp language_id: tinyint unsigned } class payment { customer_id: smallint unsigned staff_id: tinyint unsigned rental_id: int amount: decimal(5,2) payment_date: datetime last_update: timestamp payment_id: smallint unsigned } class pet { pet: varchar(150) name: varchar(150) owner: varchar(150) } class rental { rental_date: datetime inventory_id: mediumint unsigned customer_id: smallint unsigned return_date: datetime staff_id: tinyint unsigned last_update: timestamp rental_id: int } class sales_by_film_category { category: varchar(25) total_sales: decimal(27,2) } class sales_by_store { store: varchar(101) manager: varchar(91) total_sales: decimal(27,2) } class staff { first_name: varchar(45) last_name: varchar(45) address_id: smallint unsigned picture: blob email: varchar(50) store_id: tinyint unsigned active: tinyint(1) username: varchar(16) password: varchar(40) last_update: timestamp staff_id: tinyint unsigned } class staff_list { ID: tinyint unsigned name: varchar(91) address: varchar(50) zip code: varchar(10) phone: varchar(20) city: varchar(50) country: varchar(50) SID: tinyint unsigned } class store { manager_staff_id: tinyint unsigned address_id: smallint unsigned last_update: timestamp store_id: tinyint unsigned } address -[#595959,plain]-^ city : "city_id" city -[#595959,plain]-^ country : "country_id" customer -[#595959,plain]-^ address : "address_id" customer -[#595959,plain]-^ store : "store_id" film -[#595959,plain]-^ language : "language_id" film -[#595959,plain]-^ language : "original_language_id:language_id" film_actor -[#595959,plain]-^ actor : "actor_id" film_actor -[#595959,plain]-^ film : "film_id" film_category -[#595959,plain]-^ category : "category_id" film_category -[#595959,plain]-^ film : "film_id" inventory -[#595959,plain]-^ film : "film_id" inventory -[#595959,plain]-^ store : "store_id" payment -[#595959,plain]-^ customer : "customer_id" payment -[#595959,plain]-^ rental : "rental_id" payment -[#595959,plain]-^ staff : "staff_id" rental -[#595959,plain]-^ customer : "customer_id" rental -[#595959,plain]-^ inventory : "inventory_id" rental -[#595959,plain]-^ staff : "staff_id" staff -[#595959,plain]-^ address : "address_id" staff -[#595959,plain]-^ store : "store_id" store -[#595959,plain]-^ address : "address_id" store -[#595959,plain]-^ staff : "manager_staff_id:staff_id" @endumlGraphviz DOT
digraph "sakila" { splines = ortho; fontname = "Inconsolata"; node [colorscheme = ylgnbu4]; edge [colorscheme = dark28, dir = both]; actor [shape = record, label = "{ actor | first_name : varchar(45)\l last_name : varchar(45)\l last_update : timestamp\l| actor_id : smallint unsigned\l }"]; "actor_1 /* backup table */" [shape = record, label = "{ actor_1 /* backup table */ | actor_id : smallint unsigned\l first_name : varchar(45)\l last_name : varchar(45)\l last_update : timestamp\l column_nameimg : blob\l }"]; actor_info [shape = record, label = "{ actor_info | actor_id : smallint unsigned\l first_name : varchar(45)\l last_name : varchar(45)\l film_info : text\l }"]; address [shape = record, label = "{ address | address : varchar(50)\l address2 : varchar(50)\l district : varchar(20)\l city_id : smallint unsigned\l postal_code : varchar(10)\l phone : varchar(20)\l last_update : timestamp\l| address_id : smallint unsigned\l }"]; category [shape = record, label = "{ category | name : varchar(25)\l last_update : timestamp\l| category_id : tinyint unsigned\l }"]; city [shape = record, label = "{ city | city : varchar(50)\l country_id : smallint unsigned\l last_update : timestamp\l| city_id : smallint unsigned\l }"]; country [shape = record, label = "{ country | country : varchar(50)\l last_update : timestamp\l| country_id : smallint unsigned\l }"]; customer [shape = record, label = "{ customer | store_id : tinyint unsigned\l first_name : varchar(45)\l last_name : varchar(45)\l email : varchar(50)\l address_id : smallint unsigned\l active : tinyint(1)\l create_date : datetime\l last_update : timestamp\l| customer_id : smallint unsigned\l }"]; customer_list [shape = record, label = "{ customer_list | ID : smallint unsigned\l name : varchar(91)\l address : varchar(50)\l zip code : varchar(10)\l phone : varchar(20)\l city : varchar(50)\l country : varchar(50)\l notes : varchar(6)\l SID : tinyint unsigned\l }"]; film [shape = record, label = "{ film | title : varchar(255)\l description : text\l release_year : year\l language_id : tinyint unsigned\l original_language_id : tinyint unsigned\l rental_duration : tinyint unsigned\l rental_rate : decimal(4,2)\l length : smallint unsigned\l replacement_cost : decimal(5,2)\l rating : enum('g', 'pg', 'pg-13', 'r', 'nc-17')\l special_features : set('trailers', 'commentaries', 'deleted scenes', 'behind the scenes')\l last_update : timestamp\l| film_id : smallint unsigned\l }"]; film_actor [shape = record, label = "{ film_actor | last_update : timestamp\l| actor_id : smallint unsigned\l film_id : smallint unsigned\l }"]; film_category [shape = record, label = "{ film_category | last_update : timestamp\l| film_id : smallint unsigned\l category_id : tinyint unsigned\l }"]; film_text [shape = record, label = "{ film_text | title : varchar(255)\l description : text\l| film_id : smallint\l }"]; inventory [shape = record, label = "{ inventory | film_id : smallint unsigned\l store_id : tinyint unsigned\l last_update : timestamp\l| inventory_id : mediumint unsigned\l }"]; language [shape = record, label = "{ language | name : char(20)\l last_update : timestamp\l| language_id : tinyint unsigned\l }"]; payment [shape = record, label = "{ payment | customer_id : smallint unsigned\l staff_id : tinyint unsigned\l rental_id : int\l amount : decimal(5,2)\l payment_date : datetime\l last_update : timestamp\l| payment_id : smallint unsigned\l }"]; pet [shape = record, label = "{ pet | pet : varchar(150)\l name : varchar(150)\l owner : varchar(150)\l }"]; rental [shape = record, label = "{ rental | rental_date : datetime\l inventory_id : mediumint unsigned\l customer_id : smallint unsigned\l return_date : datetime\l staff_id : tinyint unsigned\l last_update : timestamp\l| rental_id : int\l }"]; sales_by_film_category [shape = record, label = "{ sales_by_film_category | category : varchar(25)\l total_sales : decimal(27,2)\l }"]; sales_by_store [shape = record, label = "{ sales_by_store | store : varchar(101)\l manager : varchar(91)\l total_sales : decimal(27,2)\l }"]; staff [shape = record, label = "{ staff | first_name : varchar(45)\l last_name : varchar(45)\l address_id : smallint unsigned\l picture : blob\l email : varchar(50)\l store_id : tinyint unsigned\l active : tinyint(1)\l username : varchar(16)\l password : varchar(40)\l last_update : timestamp\l| staff_id : tinyint unsigned\l }"]; staff_list [shape = record, label = "{ staff_list | ID : tinyint unsigned\l name : varchar(91)\l address : varchar(50)\l zip code : varchar(10)\l phone : varchar(20)\l city : varchar(50)\l country : varchar(50)\l SID : tinyint unsigned\l }"]; store [shape = record, label = "{ store | manager_staff_id : tinyint unsigned\l address_id : smallint unsigned\l last_update : timestamp\l| store_id : tinyint unsigned\l }"]; address -> city [color = "#595959", style = solid , arrowtail = none , arrowhead = normal , taillabel = "", label = "city_id", headlabel = ""]; city -> country [color = "#595959", style = solid , arrowtail = none , arrowhead = normal , taillabel = "", label = "country_id", headlabel = ""]; customer -> address [color = "#595959", style = solid , arrowtail = none , arrowhead = normal , taillabel = "", label = "address_id", headlabel = ""]; customer -> store [color = "#595959", style = solid , arrowtail = none , arrowhead = normal , taillabel = "", label = "store_id", headlabel = ""]; film -> language [color = "#595959", style = solid , arrowtail = none , arrowhead = normal , taillabel = "", label = "language_id", headlabel = ""]; film -> language [color = "#595959", style = solid , arrowtail = none , arrowhead = normal , taillabel = "", label = "original_language_id:language_id", headlabel = ""]; film_actor -> actor [color = "#595959", style = solid , arrowtail = none , arrowhead = normal , taillabel = "", label = "actor_id", headlabel = ""]; film_actor -> film [color = "#595959", style = solid , arrowtail = none , arrowhead = normal , taillabel = "", label = "film_id", headlabel = ""]; film_category -> category [color = "#595959", style = solid , arrowtail = none , arrowhead = normal , taillabel = "", label = "category_id", headlabel = ""]; film_category -> film [color = "#595959", style = solid , arrowtail = none , arrowhead = normal , taillabel = "", label = "film_id", headlabel = ""]; inventory -> film [color = "#595959", style = solid , arrowtail = none , arrowhead = normal , taillabel = "", label = "film_id", headlabel = ""]; inventory -> store [color = "#595959", style = solid , arrowtail = none , arrowhead = normal , taillabel = "", label = "store_id", headlabel = ""]; payment -> customer [color = "#595959", style = solid , arrowtail = none , arrowhead = normal , taillabel = "", label = "customer_id", headlabel = ""]; payment -> rental [color = "#595959", style = solid , arrowtail = none , arrowhead = normal , taillabel = "", label = "rental_id", headlabel = ""]; payment -> staff [color = "#595959", style = solid , arrowtail = none , arrowhead = normal , taillabel = "", label = "staff_id", headlabel = ""]; rental -> customer [color = "#595959", style = solid , arrowtail = none , arrowhead = normal , taillabel = "", label = "customer_id", headlabel = ""]; rental -> inventory [color = "#595959", style = solid , arrowtail = none , arrowhead = normal , taillabel = "", label = "inventory_id", headlabel = ""]; rental -> staff [color = "#595959", style = solid , arrowtail = none , arrowhead = normal , taillabel = "", label = "staff_id", headlabel = ""]; staff -> address [color = "#595959", style = solid , arrowtail = none , arrowhead = normal , taillabel = "", label = "address_id", headlabel = ""]; staff -> store [color = "#595959", style = solid , arrowtail = none , arrowhead = normal , taillabel = "", label = "store_id", headlabel = ""]; store -> address [color = "#595959", style = solid , arrowtail = none , arrowhead = normal , taillabel = "", label = "address_id", headlabel = ""]; store -> staff [color = "#595959", style = solid , arrowtail = none , arrowhead = normal , taillabel = "", label = "manager_staff_id:staff_id", headlabel = ""]; }Graphviz DOT with Positions
digraph "sakila" { splines = ortho; fontname = "Inconsolata"; node [colorscheme = ylgnbu4]; edge [colorscheme = dark28, dir = both]; actor [shape = record, pos = "4.333,20.917!" , label = "{ actor | first_name : varchar(45)\l last_name : varchar(45)\l last_update : timestamp\l| actor_id : smallint unsigned\l }"]; "actor_1 /* backup table */" [shape = record, pos = "-4.111,4.681!" , label = "{ actor_1 /* backup table */ | actor_id : smallint unsigned\l first_name : varchar(45)\l last_name : varchar(45)\l last_update : timestamp\l column_nameimg : blob\l }"]; actor_info [shape = record, pos = "-0.611,4.681!" , label = "{ actor_info | actor_id : smallint unsigned\l first_name : varchar(45)\l last_name : varchar(45)\l film_info : text\l }"]; address [shape = record, pos = "-2.564,26.375!" , label = "{ address | address : varchar(50)\l address2 : varchar(50)\l district : varchar(20)\l city_id : smallint unsigned\l postal_code : varchar(10)\l phone : varchar(20)\l last_update : timestamp\l| address_id : smallint unsigned\l }"]; category [shape = record, pos = "15.972,20.750!" , label = "{ category | name : varchar(25)\l last_update : timestamp\l| category_id : tinyint unsigned\l }"]; city [shape = record, pos = "-2.550,28.972!" , label = "{ city | city : varchar(50)\l country_id : smallint unsigned\l last_update : timestamp\l| city_id : smallint unsigned\l }"]; country [shape = record, pos = "-2.550,31.236!" , label = "{ country | country : varchar(50)\l last_update : timestamp\l| country_id : smallint unsigned\l }"]; customer [shape = record, pos = "-0.681,16.458!" , label = "{ customer | store_id : tinyint unsigned\l first_name : varchar(45)\l last_name : varchar(45)\l email : varchar(50)\l address_id : smallint unsigned\l active : tinyint(1)\l create_date : datetime\l last_update : timestamp\l| customer_id : smallint unsigned\l }"]; customer_list [shape = record, pos = "19.694,31.236!" , label = "{ customer_list | ID : smallint unsigned\l name : varchar(91)\l address : varchar(50)\l zip code : varchar(10)\l phone : varchar(20)\l city : varchar(50)\l country : varchar(50)\l notes : varchar(6)\l SID : tinyint unsigned\l }"]; film [shape = record, pos = "7.486,22.417!" , label = "{ film | title : varchar(255)\l description : text\l release_year : year\l language_id : tinyint unsigned\l original_language_id : tinyint unsigned\l rental_duration : tinyint unsigned\l rental_rate : decimal(4,2)\l length : smallint unsigned\l replacement_cost : decimal(5,2)\l rating : enum('g', 'pg', 'pg-13', 'r', 'nc-17')\l special_features : set('trailers', 'commentaries', 'deleted scenes', 'behind the scenes')\l last_update : timestamp\l| film_id : smallint unsigned\l }"]; film_actor [shape = record, pos = "9.174,15.458!" , label = "{ film_actor | last_update : timestamp\l| actor_id : smallint unsigned\l film_id : smallint unsigned\l }"]; film_category [shape = record, pos = "14.592,15.458!" , label = "{ film_category | last_update : timestamp\l| film_id : smallint unsigned\l category_id : tinyint unsigned\l }"]; film_text [shape = record, pos = "2.889,4.681!" , label = "{ film_text | title : varchar(255)\l description : text\l| film_id : smallint\l }"]; inventory [shape = record, pos = "2.889,15.625!" , label = "{ inventory | film_id : smallint unsigned\l store_id : tinyint unsigned\l last_update : timestamp\l| inventory_id : mediumint unsigned\l }"]; language [shape = record, pos = "10.731,25.542!" , label = "{ language | name : char(20)\l last_update : timestamp\l| language_id : tinyint unsigned\l }"]; payment [shape = record, pos = "-1.459,8.208!" , label = "{ payment | customer_id : smallint unsigned\l staff_id : tinyint unsigned\l rental_id : int\l amount : decimal(5,2)\l payment_date : datetime\l last_update : timestamp\l| payment_id : smallint unsigned\l }"]; pet [shape = record, pos = "9.028,4.681!" , label = "{ pet | pet : varchar(150)\l name : varchar(150)\l owner : varchar(150)\l }"]; rental [shape = record, pos = "1.321,11.833!" , label = "{ rental | rental_date : datetime\l inventory_id : mediumint unsigned\l customer_id : smallint unsigned\l return_date : datetime\l staff_id : tinyint unsigned\l last_update : timestamp\l| rental_id : int\l }"]; sales_by_film_category [shape = record, pos = "11.917,4.681!" , label = "{ sales_by_film_category | category : varchar(25)\l total_sales : decimal(27,2)\l }"]; sales_by_store [shape = record, pos = "5.583,4.681!" , label = "{ sales_by_store | store : varchar(101)\l manager : varchar(91)\l total_sales : decimal(27,2)\l }"]; staff [shape = record, pos = "-4.111,16.792!" , label = "{ staff | first_name : varchar(45)\l last_name : varchar(45)\l address_id : smallint unsigned\l picture : blob\l email : varchar(50)\l store_id : tinyint unsigned\l active : tinyint(1)\l username : varchar(16)\l password : varchar(40)\l last_update : timestamp\l| staff_id : tinyint unsigned\l }"]; staff_list [shape = record, pos = "22.666,31.236!" , label = "{ staff_list | ID : tinyint unsigned\l name : varchar(91)\l address : varchar(50)\l zip code : varchar(10)\l phone : varchar(20)\l city : varchar(50)\l country : varchar(50)\l SID : tinyint unsigned\l }"]; store [shape = record, pos = "-2.638,20.917!" , label = "{ store | manager_staff_id : tinyint unsigned\l address_id : smallint unsigned\l last_update : timestamp\l| store_id : tinyint unsigned\l }"]; address -> city [color = "#595959", style = solid , arrowtail = none , arrowhead = normal , taillabel = "", label = "city_id", headlabel = ""]; city -> country [color = "#595959", style = solid , arrowtail = none , arrowhead = normal , taillabel = "", label = "country_id", headlabel = ""]; customer -> address [color = "#595959", style = solid , arrowtail = none , arrowhead = normal , taillabel = "", label = "address_id", headlabel = ""]; customer -> store [color = "#595959", style = solid , arrowtail = none , arrowhead = normal , taillabel = "", label = "store_id", headlabel = ""]; film -> language [color = "#595959", style = solid , arrowtail = none , arrowhead = normal , taillabel = "", label = "language_id", headlabel = ""]; film -> language [color = "#595959", style = solid , arrowtail = none , arrowhead = normal , taillabel = "", label = "original_language_id:language_id", headlabel = ""]; film_actor -> actor [color = "#595959", style = solid , arrowtail = none , arrowhead = normal , taillabel = "", label = "actor_id", headlabel = ""]; film_actor -> film [color = "#595959", style = solid , arrowtail = none , arrowhead = normal , taillabel = "", label = "film_id", headlabel = ""]; film_category -> category [color = "#595959", style = solid , arrowtail = none , arrowhead = normal , taillabel = "", label = "category_id", headlabel = ""]; film_category -> film [color = "#595959", style = solid , arrowtail = none , arrowhead = normal , taillabel = "", label = "film_id", headlabel = ""]; inventory -> film [color = "#595959", style = solid , arrowtail = none , arrowhead = normal , taillabel = "", label = "film_id", headlabel = ""]; inventory -> store [color = "#595959", style = solid , arrowtail = none , arrowhead = normal , taillabel = "", label = "store_id", headlabel = ""]; payment -> customer [color = "#595959", style = solid , arrowtail = none , arrowhead = normal , taillabel = "", label = "customer_id", headlabel = ""]; payment -> rental [color = "#595959", style = solid , arrowtail = none , arrowhead = normal , taillabel = "", label = "rental_id", headlabel = ""]; payment -> staff [color = "#595959", style = solid , arrowtail = none , arrowhead = normal , taillabel = "", label = "staff_id", headlabel = ""]; rental -> customer [color = "#595959", style = solid , arrowtail = none , arrowhead = normal , taillabel = "", label = "customer_id", headlabel = ""]; rental -> inventory [color = "#595959", style = solid , arrowtail = none , arrowhead = normal , taillabel = "", label = "inventory_id", headlabel = ""]; rental -> staff [color = "#595959", style = solid , arrowtail = none , arrowhead = normal , taillabel = "", label = "staff_id", headlabel = ""]; staff -> address [color = "#595959", style = solid , arrowtail = none , arrowhead = normal , taillabel = "", label = "address_id", headlabel = ""]; staff -> store [color = "#595959", style = solid , arrowtail = none , arrowhead = normal , taillabel = "", label = "store_id", headlabel = ""]; store -> address [color = "#595959", style = solid , arrowtail = none , arrowhead = normal , taillabel = "", label = "address_id", headlabel = ""]; store -> staff [color = "#595959", style = solid , arrowtail = none , arrowhead = normal , taillabel = "", label = "manager_staff_id:staff_id", headlabel = ""]; }
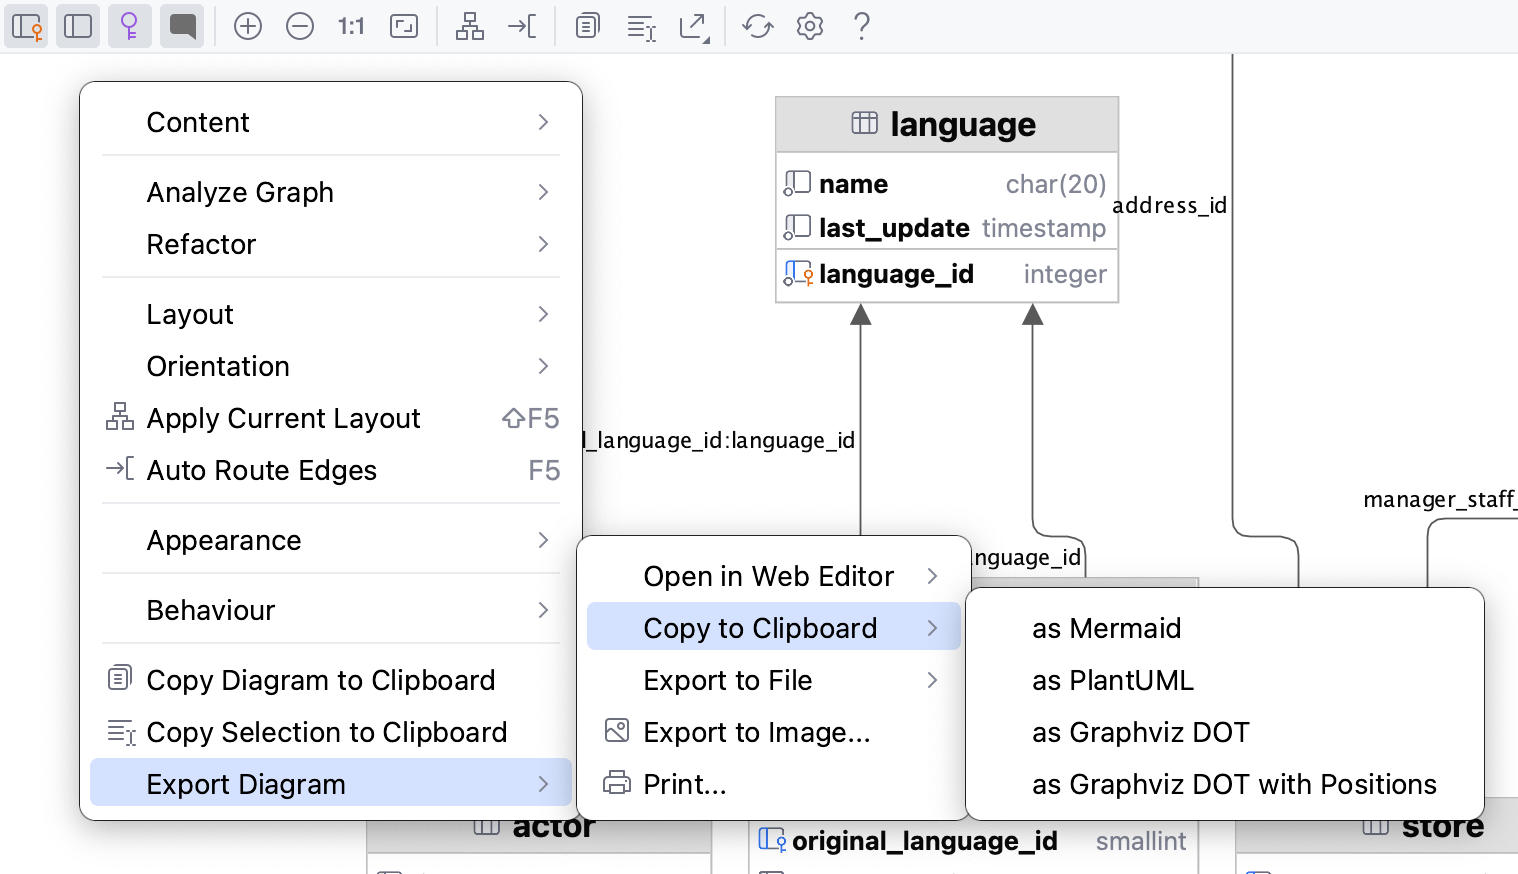
Export diagrams to files
To export your diagram to a file, right-click the diagram, navigate to , and select the format.
Alternatively, click the Export Diagram button (
) on the diagram toolbar, and select the format in the corresponding submenu.
The supported formats are as follows:
YEd .graphml
JGraph .drawio
Graphviz .dot
Graphviz .dot with Positions
Mermaid .md
PlantUML
IDEA .uml: The UML format is an internal format supported only by CLion. To open the saved diagram, drag the UML file to the editor.
Note that the UML file scope is limited to the original project. It can only be opened and used within the same project it was created.

Export diagrams as images in PNG format
To export your diagram as an image in PNG format, right-click the diagram and select .
Alternatively, click the Export Diagram button (
) on the diagram toolbar, and select Export to Image.
Reference
Icons
Possible icon combinations for columns in diagrams:
Icon | Foreign key | Primary key | Indexed | NOT NULL |
|---|---|---|---|---|
Diagram configuration settings
To configure the default visibility settings and layout for diagrams, Open settings by pressing Ctrl+Alt+S and navigate to . .
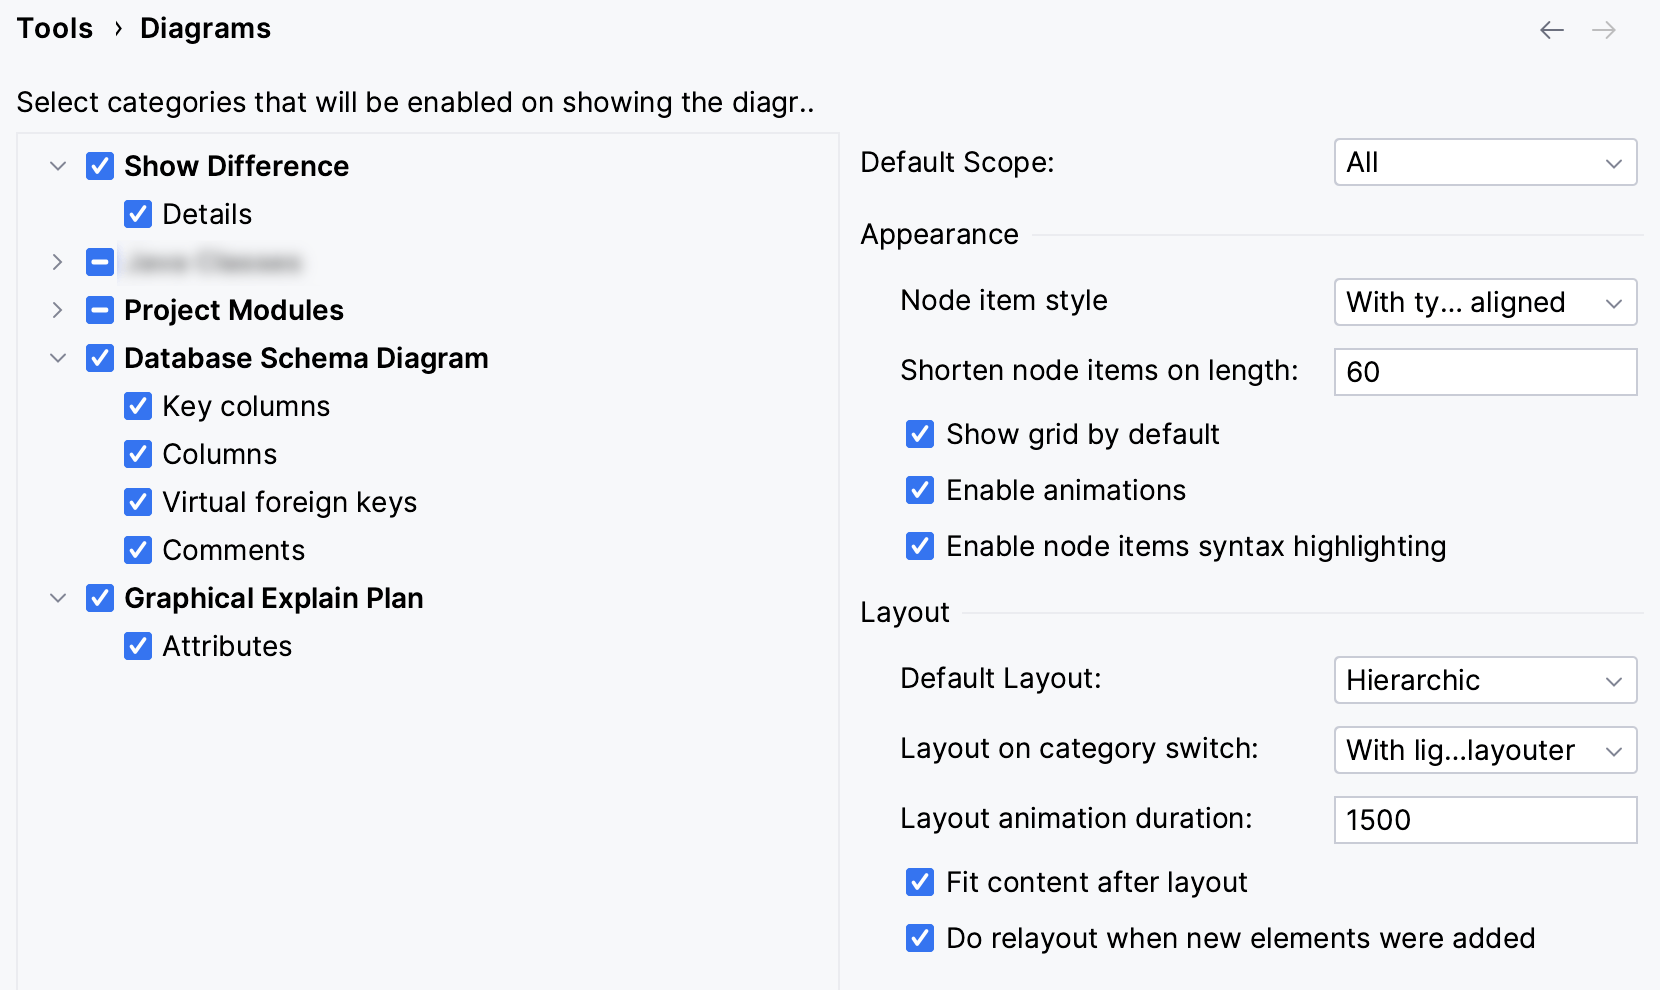
Content pane
Select the checkboxes next to the elements to be shown on diagrams.
Item | Description |
|---|---|
Show Difference | |
Details | If this checkbox is selected, all the specified details of the elements will be shown in the UML class diagram for a revision. If this checkbox is not selected, only node elements will be included in the diagram. |
DB Diagrams | |
Key columns | For the primary key columns to be shown when a diagram opens, select this checkbox. When viewing a diagram in the editor, use |
Columns | For the columns other than the primary key columns to be shown when a diagram opens, select this checkbox. When viewing a diagram in the editor, use |
Controls
Item | Description |
|---|---|
Default layout | Select the desired layout from the Default layout list. Node elements in newly created diagrams will be arranged according to the selected layout. |
Default scope | Select scope from the Default scope list. Specifying a scope helps you avoid showing in diagram the unnecessary hierarchies. You can define scopes for your project in the Scopes page of the Settings (Ctrl+Alt+S) dialog. |
Fit content after layout | If this checkbox is selected, then after applying a layout selected on the diagram context menu, all diagram elements will be resized to fit into the current diagram area. In diagram, use the |
Do relayout when new elements were added | If this checkbox is selected, diagram layout will be performed automatically after adding new elements. |
Toolbar and context menu
Use the diagram editor toolbar to quickly access actions and the context menu to manage the displayed diagram.
Toolbar
Item | Description |
|---|---|
(Available when you work with databases.) Click this button to show primary key columns in the diagram. | |
(Available when you work with databases.) Toggles the display of the following:
| |
(Available when you work with databases.) Click this button to hide or show virtual foreign keys in the diagram. | |
(Available when you work with databases.) Click this button to hide or show comments in the diagram. | |
Click this icon to increase the scale of the diagram. Alternatively, press NumPad+. | |
Click this icon to decrease the scale of the diagram. Alternatively, press NumPad-. | |
Click this icon to restore the actual size of the diagram. | |
Click this icon to make the contents fit into the current diagram size. | |
Click this icon to apply the current layout, selected from the Layout node of the diagram context menu. | |
Click this icon to scale the diagram to the edges of the window. | |
Click this icon to copy the diagram into the clipboard. | |
Click this icon and then select any diagram area with the mouse: the selected area will be copied into the clipboard. | |
Click this icon to export a diagram using various formats, which are compatible with third-party tools, to a file, to an image, or open the diagram in the browser.  You can select and configure the following options:
| |
Click this button to refresh the whole diagram. | |
Click this button to open the Diagram settings where you can configure additional options. |
Context menu
The table below contains commands that are not available from the toolbar.
Item | Description |
|---|---|
Selected Element Actions | Use this option to open a list of actions that is applied to a selected element in the diagram. You can select actions to copy an element, jump to its source, find its usages, use the Navigate actions, various Git actions, and so on. |
Content | Use this option to open a list of actions that help you to add new elements, show dependencies, sort elements inside the diagram, and so on.
|
Delete | Deletes the selected diagram. |
Analyze Graph | Use this node to select one of the commands to analyze a diagram. You can check the graph characteristics, change the focus of the graph, measure graph centrality, and so on. |
Layout | Select the desired diagram layout from the submenu. |
Behavior | Use this option to select commands related to the diagram behavior sucha as aligning elements against the grid, showing structure view for the selected node, or fitting the content after the layout. |
Export Diagram | Use this option to export a diagram using various formats, which are compatible with third-party tools, to a file, to an image, or open the diagram in the browser. |