Examine suspended program
After the debugger session has started, the Debug tool window appears, and the program runs normally until one of the following happens:
a breakpoint is hit
you manually pause the program
After that, the program is suspended, allowing you to examine its current state, control its further execution, and test various scenarios at runtime.
Frames and threads
The state of the program is represented by frames. When the program is suspended, the current frame stack is displayed in the Frames pane.

A frame corresponds to an active method or function call. It stores the local variables of the called method or function, its arguments, and the code context that enables expression evaluation.
Each time a Function is called, a new frame is added to the top of the stack. When the execution of a Function is complete, the corresponding frame is removed from the stack (in the last in, first out fashion).
Examining frames helps you understand why particular parameters were passed to a method and what the state of the caller was at the time of calling.
Module names
There are cases where the code can be compiled to different modules, like template functions. You can learn in which binary the code is being executed at any moment from module names.
Right-click anywhere in the Frames pane and select Show Module Name:

Modules names will be shown for each of the stack frame entries:

Threads
You can navigate through the list of the application threads. The ID given by the OS on thread start can help you identify the thread you are interested in:

Thread Icons
Icons near each thread indicate the status of the thread:
Icon | Description |
|---|---|
| The current thread in suspended state. |
| A suspended thread. Threads are marked as suspended when they were paused by the debugger. |
Free/unfreeze individual threads
In CLion, you can suspend and resume threads while debugging.
Use the context menu in the thread view of the Debug tool window or in the main menu:

Freeze ... and Unfreeze ... – freezes and unfreezes the currently selected thread.
Freeze Other Threads – freezes all other threads except the currently selected one and unfreezes the currently selected thread if it was frozen before.
Unfreeze All Threads – resumes execution in all threads.
Copy stack to clipboard
To copy the call stack for the current thread, right-click anywhere on the Frames pane and select Copy Stack.
Explore and edit variables
The Variables pane shows the list of the variables in the selected frame/thread. Examining the variables can help you understand why the program operates in a certain way.

View variables in a dedicated dialog
CLion allows you to inspect variables in a dedicated dialog. This is useful when you need to keep track of some variable (or the object whose reference it holds) and at the same time be able to navigate between frames and threads.
Right-click a variable or a watch and select Inspect.

Set variable values
If you want to test how the program would behave with certain data or change its flow at runtime, you can achieve that by changing the variable values.
Select a variable and press F2. Alternatively, select Set Value from the context menu.
Enter the value for the variable and press Enter.

Alternatively, you can set a variable value using the inline hint popup. Click the hint that corresponds to the desired variable, expand the tree if required, and select Set Value:

instance="rm"/>
View as array
The View as array action adds a watchpoint that renders a pointer value as array.
Select View as Array from the context menu of a pointer variable.
Specify the array size:

The array representation of the selected pointer will be added to the list or variables:

View OpenCV images
When debugging an application that contains two-dimensional OpenCV arrays of type cv::Mat, you can view them as images in a separate debugger dialog.
After debugging has started and an OpenCV array has been initialized, click View as image next to the variable in the debugger’s Variables pane:

A new dialog opens:

From this dialog, you can change the image’s color format, choose whether or not to reload it after the debugger steps, save it as a .png file, and more.

View other image types
If you’re working with image types other than cv::Mat, you can also view them as images using the OpenCV image viewer. In this case, you have to set an image format manually. Here is an example:
To view this image, right-click the pointer in the Variables pane and select View as Image… from the context menu:

Manually configure the width, height, and other parameters of the image:

Navigate to source code
You can navigate to declarations from the Variables pane.
To navigate to the code where the variable is declared, right-click the variable and select Jump to Source F4.
To navigate to the class declaration of the variable type, right-click the variable and select Jump to Type Source Shift+F4.
Evaluate expressions
CLion lets you evaluate expressions during a debugging session to obtain additional details about the program state or test various execution scenarios at runtime.
This feature only works if the program was suspended after hitting a breakpoint (not paused).
If there are breakpoints inside methods called within the expression, they will be ignored.
Evaluate a simple expression in the editor
To quickly evaluate an expression, point at it in the editor. Note that function calls cannot be evaluated this way.
Point at the expression you want to evaluate. The result of the expression appears in a tooltip.

To view child elements of the resulting object, click
 or press Ctrl+F1.
If you find value tooltips distracting, you can increase the delay or disable them altogether. To do this, in the Settings dialog (Ctrl+Alt+S) , go to and set the Show value tooltip and Value tooltip delay options according to your preference.
Evaluate a complex expression in the editor
If you want to evaluate an expression in the code that involves a method call or indicate a specific portion of the expression to evaluate, use the Quick Evaluate Expression option.
Select the expression and press Ctrl+Alt+F8 or select Evaluate Expression from the floating toolbar that appears .

Alternatively, go to or hold Alt and click the selection .
You can configure Quick Evaluate Expression to work for a piece of code on just selecting it (without using the menu/shortcut). Use this option carefully, as you can accidentally call methods when it is enabled.
Evaluate expressions on selecting code
Go to and set the Show value tooltip on code selection option.
Evaluate arbitrary expressions
Evaluating arbitrary expressions is the most flexible evaluating option. It lets you evaluate any custom code as long as it is in the context of the current frame. Using it, you can evaluate declarations, method calls, anonymous classes, lambdas, loops, and so on.
If you want to start with some expression or a variable, which is currently in front of you (for example, in the editor or on the Variables pane), select it.
Go to Alt+F8 or select Evaluate Expression from the context menu. The shortcut may not work on Ubuntu (for correct operation, adjust the shortcut configuration).
In the Evaluate dialog, modify the selected expression or enter a new one in the Expression field. Click Expand Shift+Enter to modify a multiline code fragment.
Click Evaluate (Ctrl+Enter for multiline mode). The expression result appears in the Result field.

The result of the expression is taken from the return statement. When there is no return statement, the result is taken from the last line of code (it does not even have to be an expression: a single literal works too). When there is no valid line to take the value from, the result is
undefined. If the specified expression cannot be evaluated, the Result field indicates the reason.
The Evaluate dialog is non-modal, so you can switch the focus back to the editor to copy other variables and expressions. You can also open multiple Evaluate dialogs.
View values inline
CLion shows the values of the variables right next to their usage. Once the variable value has changed, the inline view is updated with the new value and changes its color.
You can click an inline hint and expand it to examine the fields belonging to the variable. From this popup, you can also change the variable values and add inline watches.
The inline view is enabled by default. To turn it off, in the Settings dialog (Ctrl+Alt+S) , go to and disable the Show values inline option.
Add an Inline Watch
If you want the result of some expression to appear on a particular line, you can set up an inline watch for that. Inline watches are persistent and remain active after session restart.
Click the inline hint referring to the object whose field you want to track.
In the popup, select the field and click Add as Inline Watch.

Fine-tune the watch if needed. You can use any valid expression as a watch.

Press Enter and the inline watch will appear on the same line:

Inline watches you set in the editor are also shown under Inline Watches in the Variables pane of the Debug tool window:

To remove an inline watch, hover over the watch and click the cross near it.
Watches
If you want to keep track of some variable or the result of a more complex expression, set up a watch for this variable or expression. This is useful when you need to evaluate something that is not regularly displayed on the list of variables, or to pin some instance variable thus eliminating the need to expand the tree after each step.
This feature only works if the program was suspended after hitting a breakpoint (not paused).
Watches are evaluated in the context of the selected frame. Watches cannot be evaluated when they are out of context or when they fail to compile. If this is the case, the watch is marked with the error icon ![]() .
.
By default, watches are shown together with variables in the Variables pane. To hide/reveal the Watches pane, use the Separate watches option in the Layout Settings![]() menu.
menu.
Add a watch
Enter the expression in the top part of the Variables pane, then click Add to Watches.

After you have added a variable/expression to Watches, it stays there and is evaluated for each step, providing you with the result in the current context.
Edit a watch
Right-click the desired watch and select Edit.
Delete a watch
To remove a single watch, right-click it and select Remove Watch. Alternatively, select the watch and press Delete on the Variables/Watches pane.
To remove all watches, right-click anywhere on the Variables/Watches pane and select Remove All Watches.
Watches allow for the same actions as variables do. For example, you can view them in a dedicated dialog or use them to navigate to the source code.
Watches are a part of your project. This means you can stop and rerun the debugging session without risk of losing them.
Execution point
Return to the current execution point
Examining the program state involves navigating in code, and you often need to return to the place where your program is suspended.
Do one of the following:
In the main menu, go to .
Press Alt+F10.
Click
 on the stepping toolbar of the Debug tool window and select
  Show Execution Point from the context menu that opens.
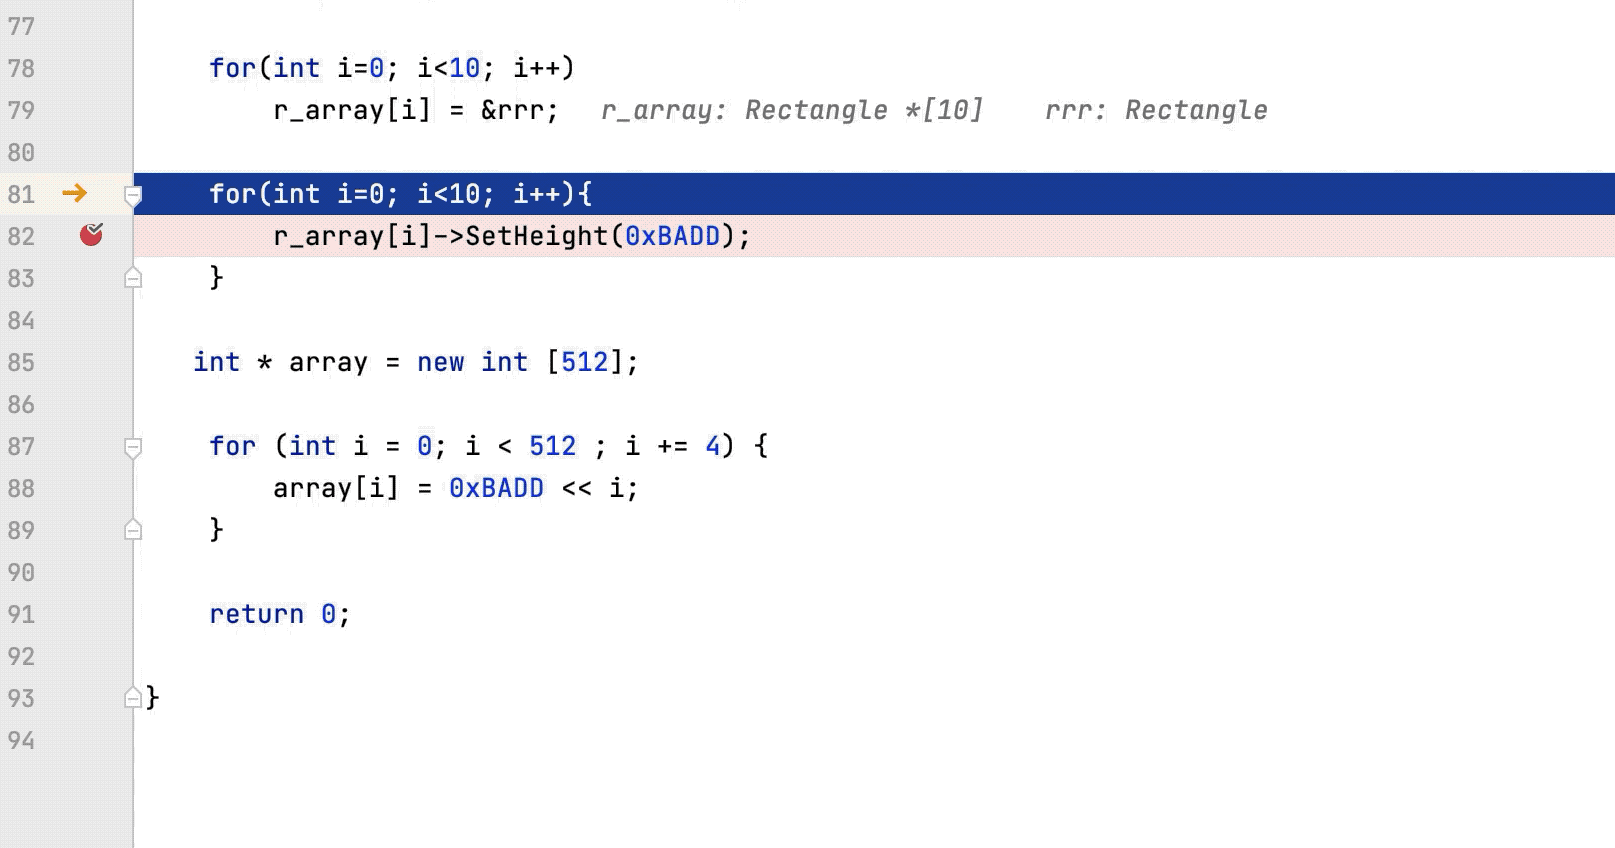
The current execution point is indicated with a blue line. The code at this line has not been executed yet.
