Memory View
In some cases (for example, to debug data processing problems) you may need to view raw memory of the running process. For this, CLion provides Memory View: you can jump from a pointer in the Variables pane to the memory region that includes the required address and examine the changes along with stepping through the program.
Invoke Memory View
-
In the Variables pane of the Debugger tool window, select the desired pointer variable. For a non-pointer object in memory, you can set a watch for the variable's address (like
&var) and then invoke Memory View for it. Press Ctrl+Enter or choose Show in Memory View from the variable's context menu:

-
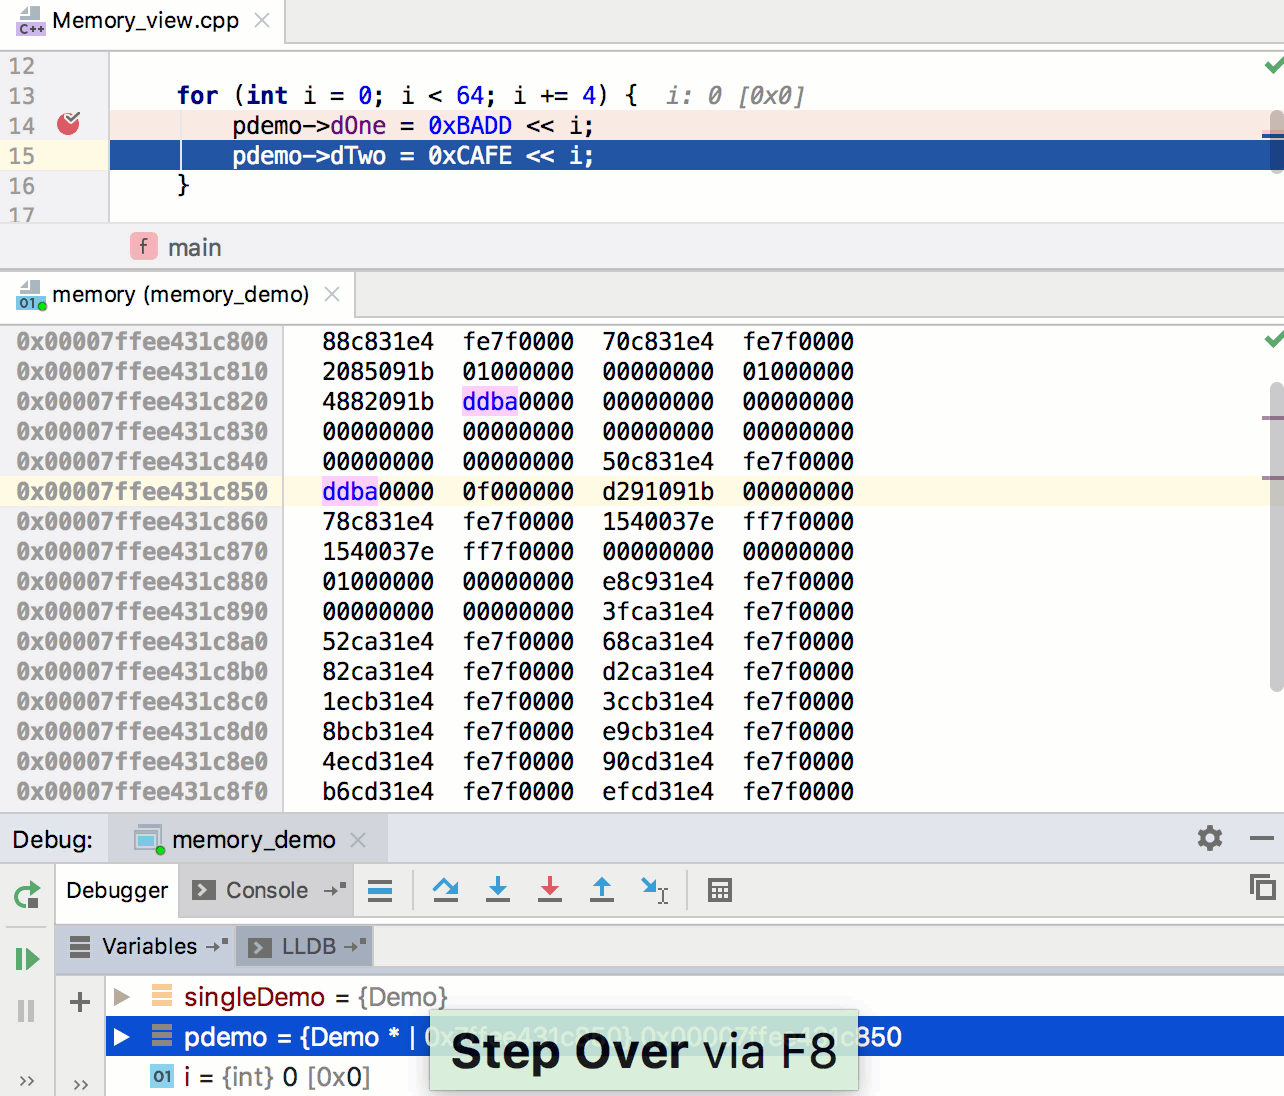
The Memory View window initially shows a 256-byte region that starts from the chosen address, with higher memory addresses at the bottom of the window. When you then invoke Memory View for other pointers, they arе highlighted in the same window, and the region is extended to show more addresses if necessary.
You can also open several Memory View windows by splitting the editor tabs vertically
 or horizontally
  . Use the context menu of the left column to hide/show or copy the addresses:
Examine memory while stepping
-
When you step through your code, CLion highlights the changes that happen in the currently shown memory region: