Valgrind memcheck
Valgrind Memcheck is a tool that detects memory usage problems such as leaks, invalid memory access-s, incorrect memory releases, and undefined value references.
Valgrind integration in CLion works on Linux, macOS, and Windows with WSL (refer to Valgrind on WSL).
Configure Valgrind
Install Valgrind on your system.
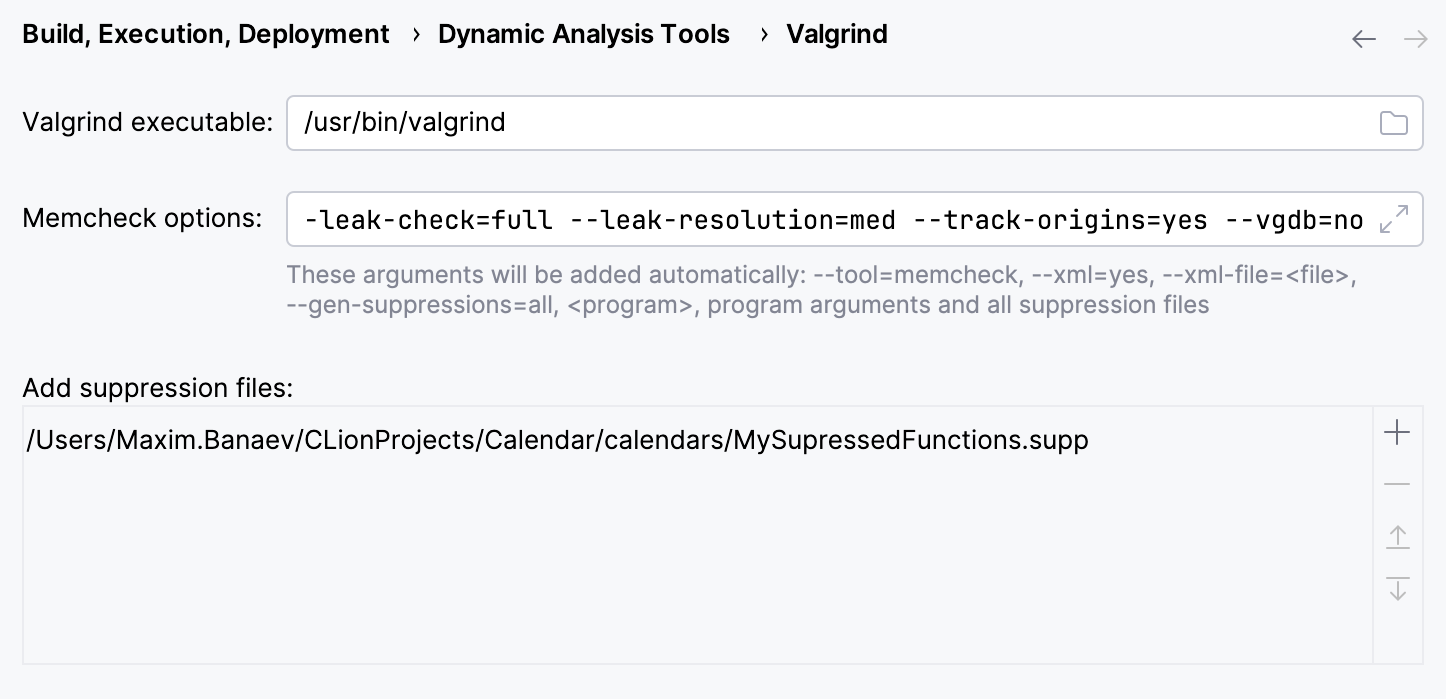
In CLion, go to .
CLion will attempt to detect the Valgrind binary as set in system
PATH.In case of a non-standard Valgrind location, provide the path manually in the Valgrind executable field.
Specify analysis options or use the default ones.
Optionally, configure the list of the suppression files.
For example, a suppression file can be used to turn off Valgrind checks for particular libraries.
Configure Valgrind on WSL
In , provide the 'subsystem' path to Valgrind, which is /usr/bin/valgrind by default, instead of the actual Windows location of the Valgrind binary.
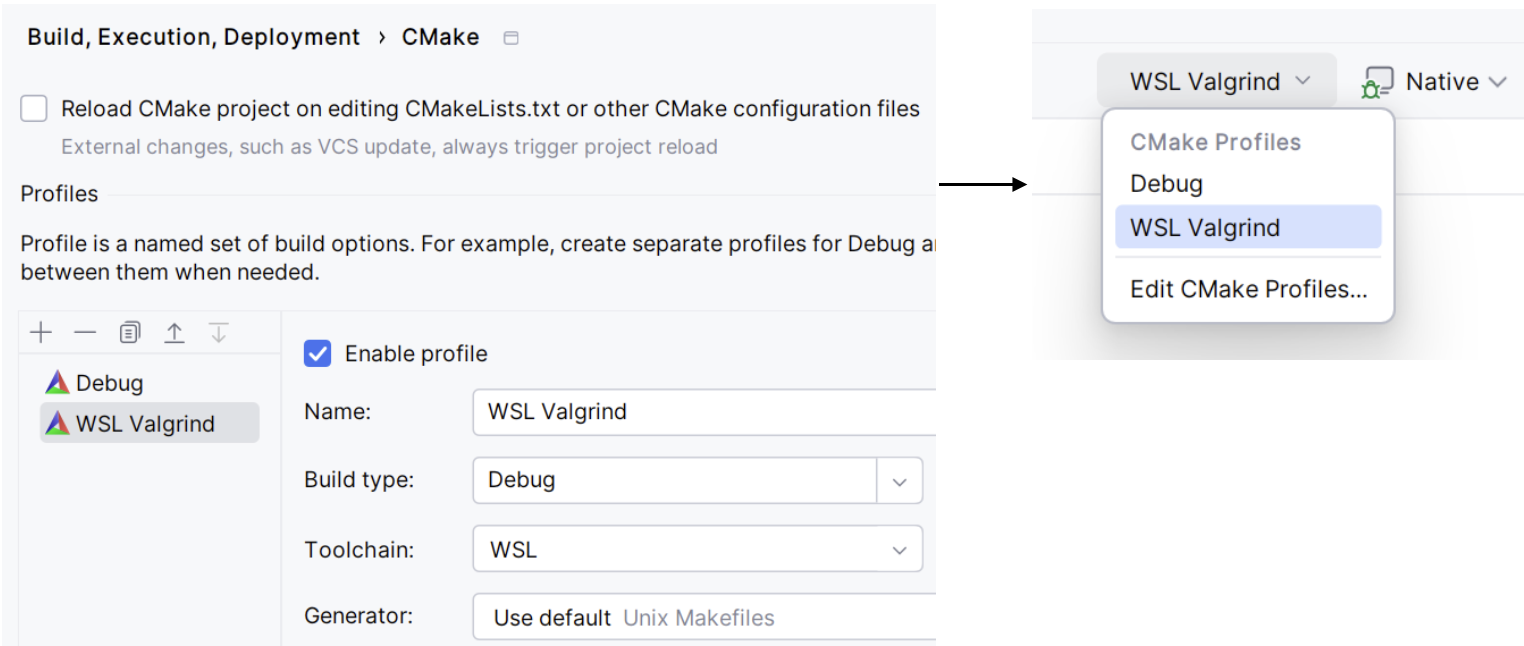
Activate a CMake profile connected to the WSL toolchain.
For this, do one of the following:
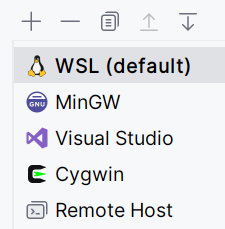
Set the WSL toolchain as default. This way, it will automatically connect to the default CMake profile:
Create a separate CMake profile, connect it to the WSL toolchain, and select this profile in the configurations switcher:
Run targets
To run a target (application or test) with Valgrind Memcheck, do one of the following:
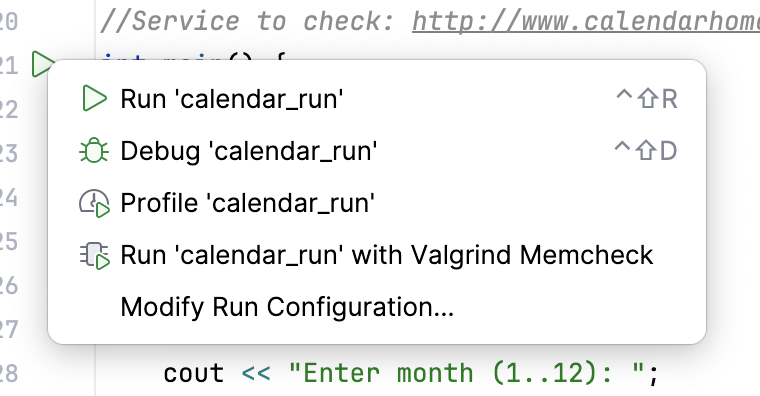
Click the
gutter icon and select Run 'your_target_name' with Valgrind Memcheck option from the menu:
Select the desired Run/Debug configuration and call from the main menu or click the dedicated toolbar icon:

If Valgrind was not configured previously, CLion will open the configuration dialog.
Explore results
When the launch is finished, open the Valgrind tab in the Run tool window.

The left-hand pane shows the list of all problems found by Valgrind Memcheck. Each entry includes the instruction pointer, problematic function name, and (if possible) the source file where the problem is located.
In the right-hand pane, you can find full stack frame description and the corresponding code preview (when possible).
Export and import results
To export the results, click the Export
 icon in the left pane of the Valgrind tab and specify the destination XML file:
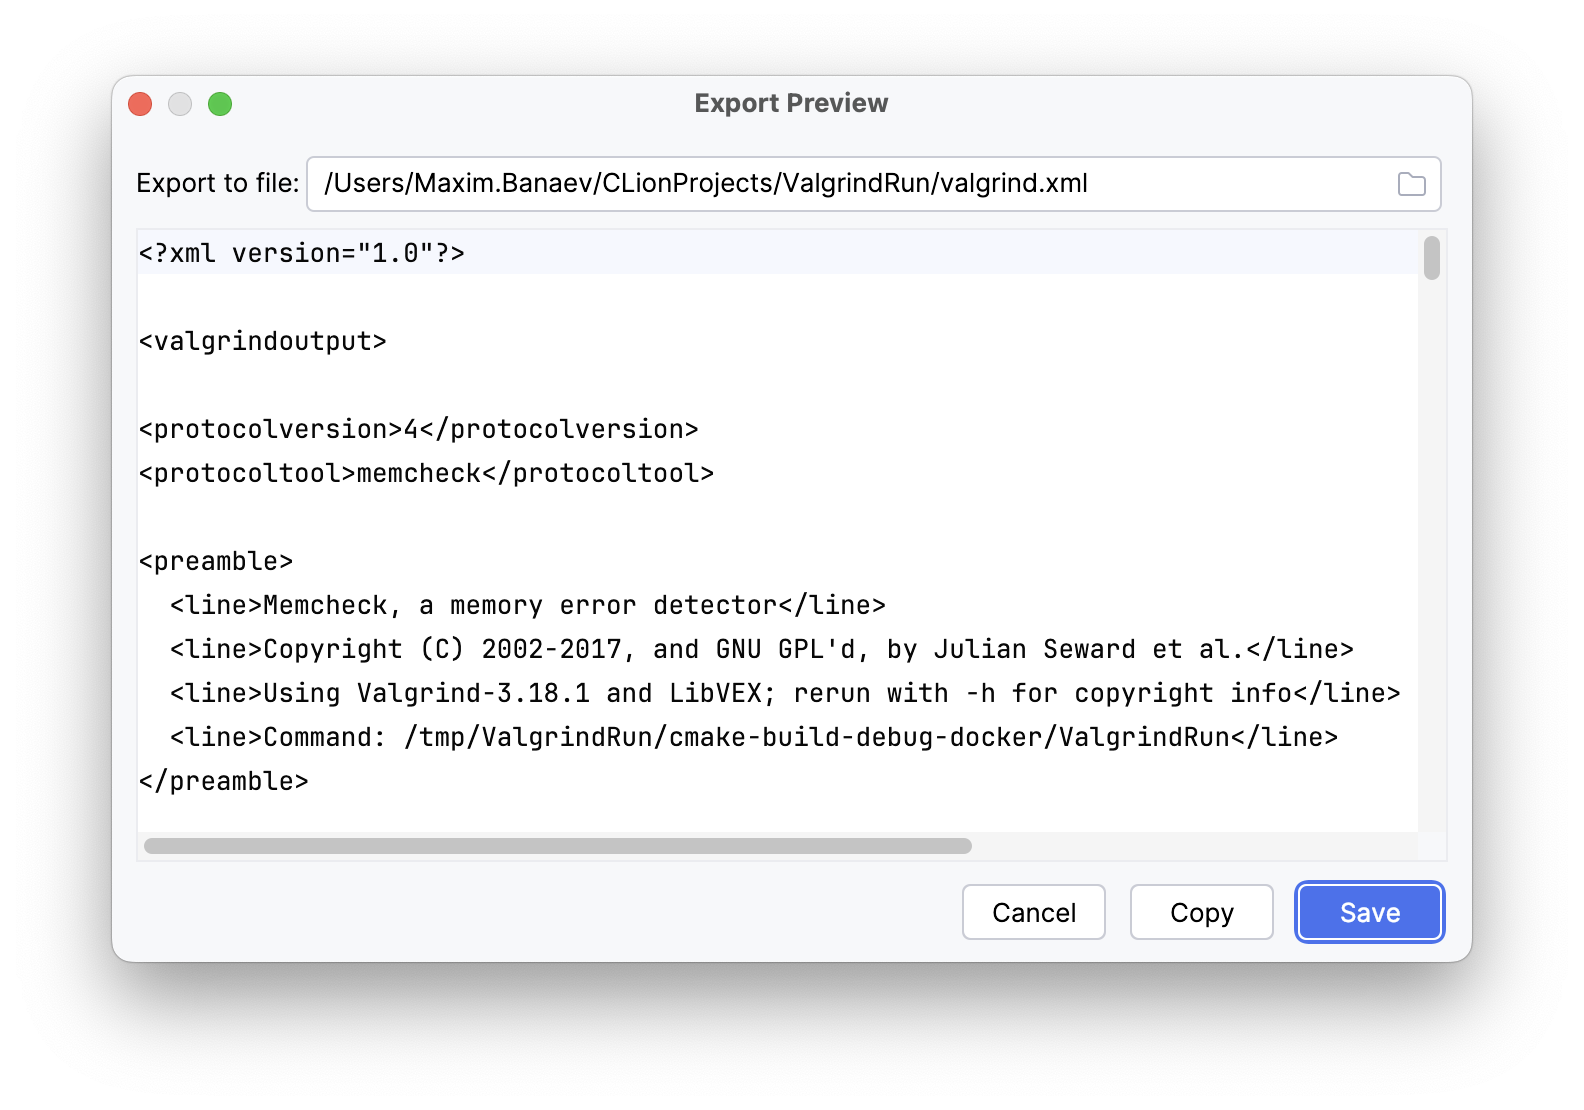
Note that the Export button is unavailable during execution.
To import the results, select from the main menu and choose the XML file to import from.