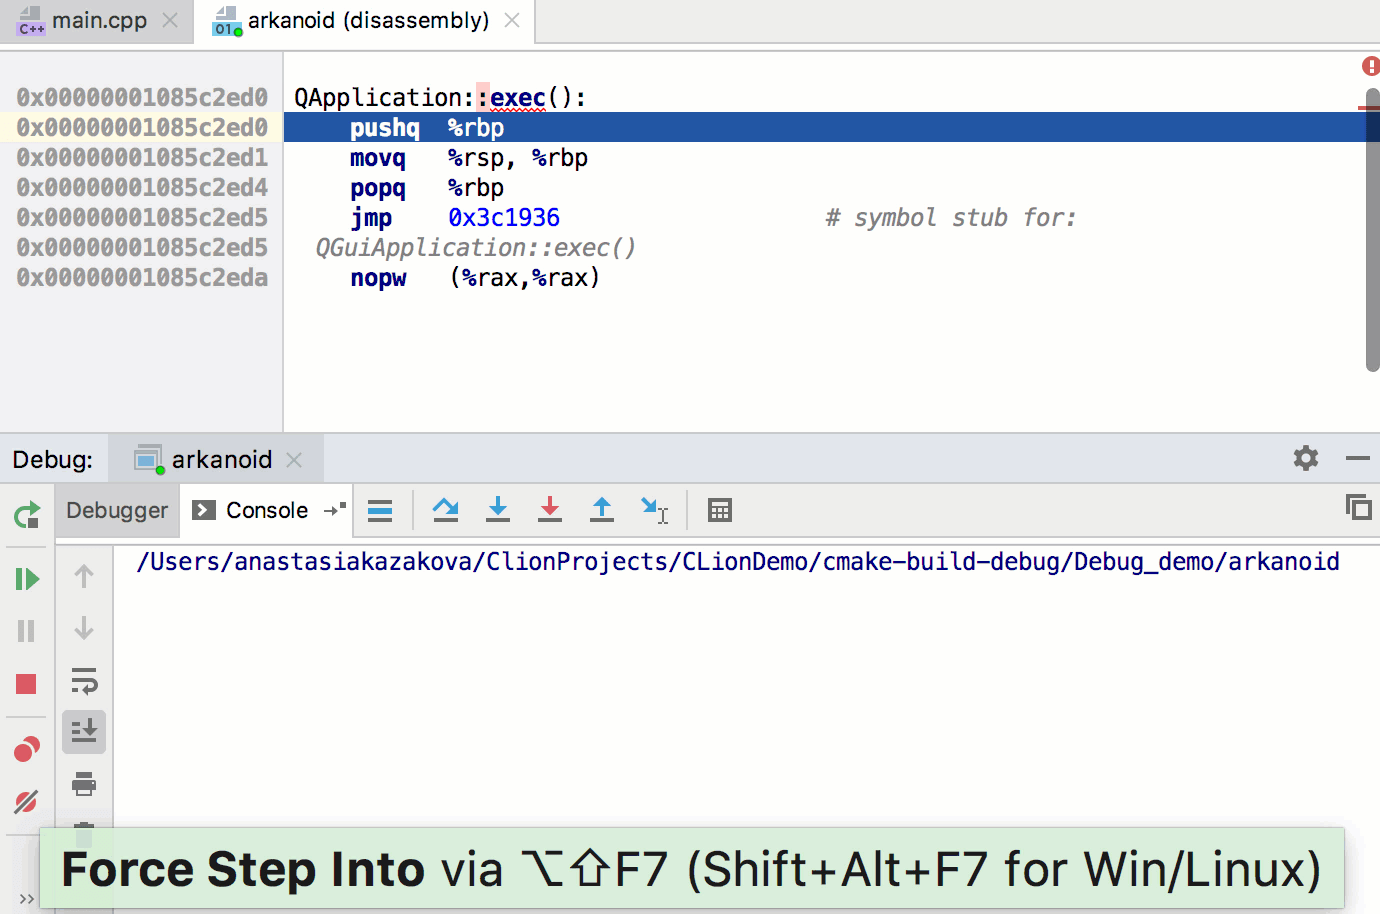
Disassembly View
In situations when source code is unavailable, you can step into and debug the disassembled code in the dedicated view.
Access the Disassembly view
When debugging your code, use the Force Step Into
 Shift+Alt+F7 command instead of Step Into F7. Step Into behaves as Step Over for functions with no source code.
Navigate to the desired frame in the Debug Tool window.
The disassembly view opens automatically when you launch a debug session for the attached process that does not provide debug information.
Syntax highlighting is available for AT&T assembly code. By default, the .s and .asm files are recognized as assembly code files, but you can configure other types. To do this, in the Settings/Preferences dialog (Ctrl+Alt+S), go to . Select Assembly Language in the list of recognized file types and add a new extension to the list.
To investigate your code in the disassembly view, use regular stepping actions. Note that Run to Cursor, Evaluate Expression, and breakpoints-related actions are not supported.
Extending the disassembly view functionality is under development in CLion. Vote for desired features and share your feedback in the following tickets: