Code Coverage
In CLion, you can run CMake applications and tests with code coverage measurements. Code coverage results provide the percentage of code lines executed during a run and the number of times a particular line was hit.
Compiler flags for code coverage
CLion relies on llvm-cov/gcov integration to collect and show code coverage data for your code. These tools require that you provide special coverage compiler flags in your CMakeLists.txt script. For this, you can use set(CMAKE_CXX_FLAGS "") or other alternatives like the add_compile_options command.
See below the options for the flags depending on your compiler and the coverage tooling you prefer.
-
GCC
-fprofile-arcs -ftest-coverageor--coverageIn this case, the gcov tool will be used.
-
Clang
You have two options here:
Use the same flags as for GCC to get the gcov-style coverage collected with llvm-cov gcov.
Use
-fprofile-instr-generate -fcoverage-mappingto invoke the Clang’s instrumentation-based profiling which uses a pair of thellvm-profdata mergeandllvm-cov exportcommands.
Running CMake applications or tests with coverage
After reloading your project with the added flags, you can use the Run with Coverage action for your CMake Application and test configurations (Boost.Test, Google Test, or Catch).
Run with Coverage is available from the toolbar next to the configuration switcher and from the gutter menu:


Reading coverage results
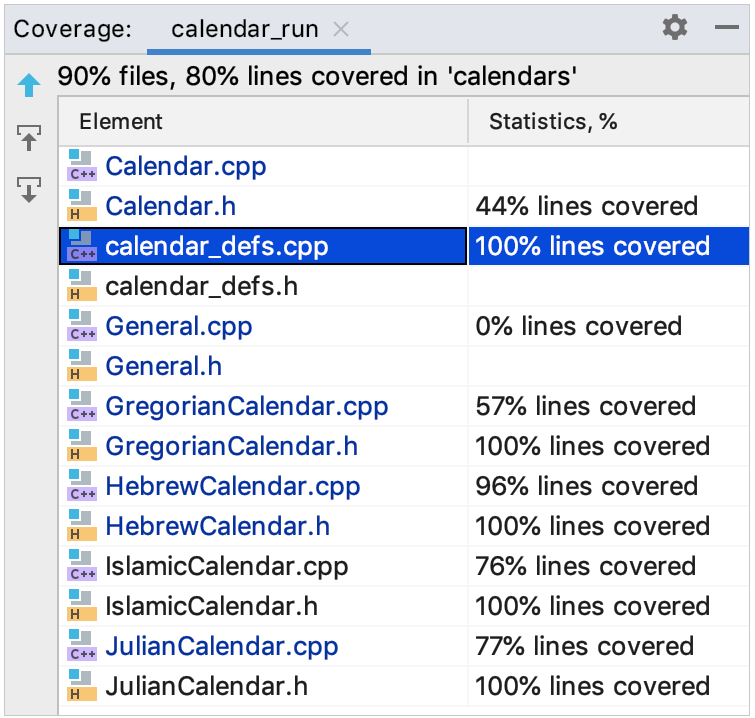
When coverage data is ready, the Coverage tool window opens up automatically. It shows the percentage of the files per folder and lines per file covered during the launch:

-
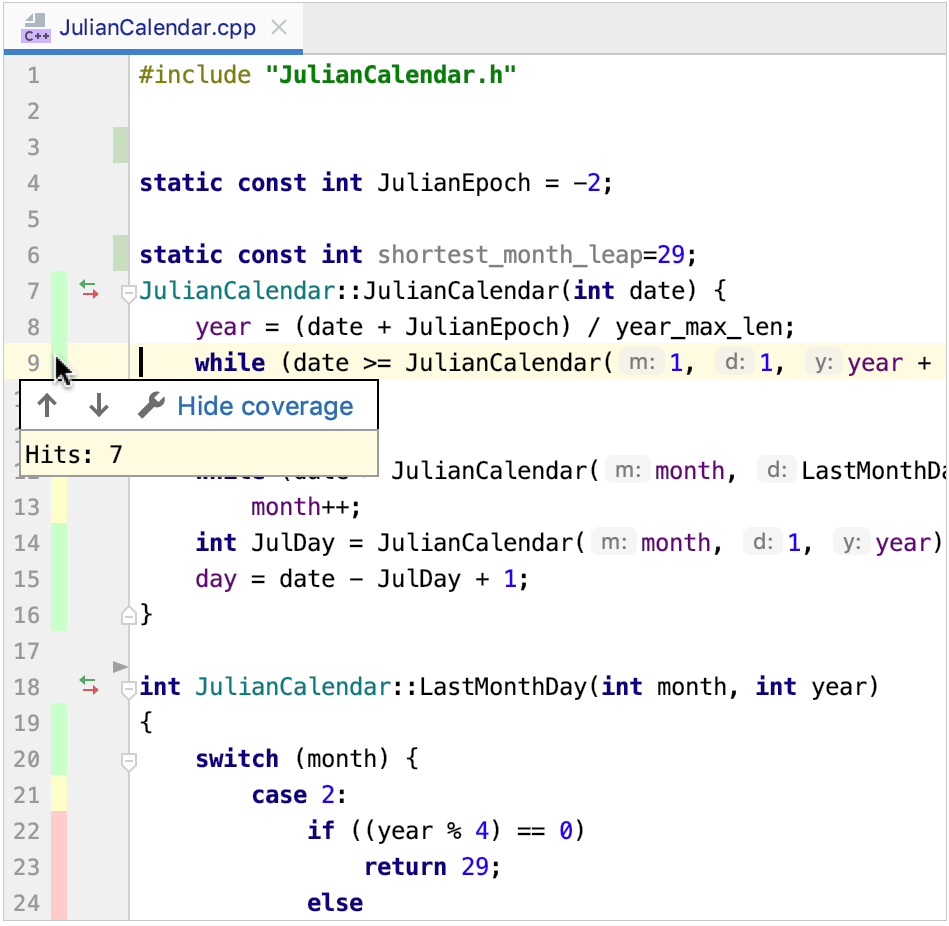
In any file, you can check the gutter indicator and click it next to a particular line to learn how many times it was hit:

A line executed fully is marked green. Yellow marker means that it was only partically executed.
To modify the colors of coverage highlighting, click
 or go to and expand the Line Coverage node.
 CLion also shows coverage statistics in the Project view:

Merging results from several runs
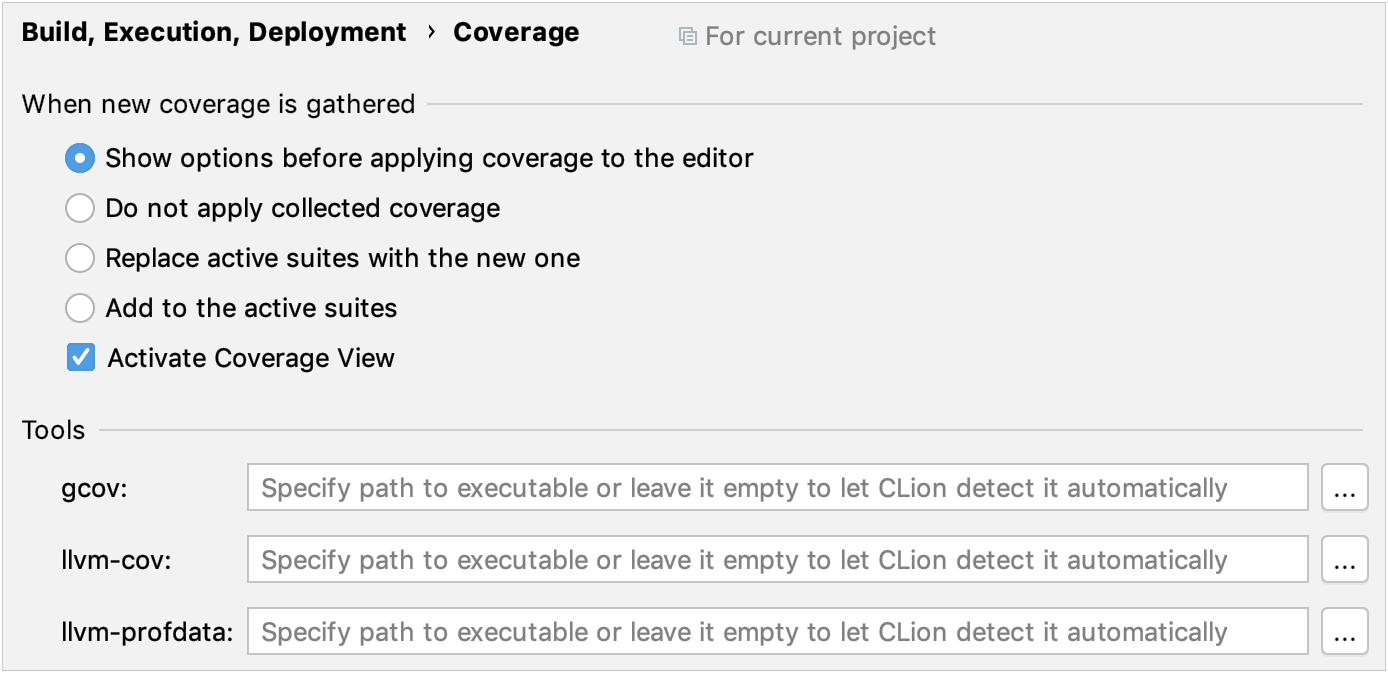
When you rerun coverage analysis, CLion prompts you to choose how you prefer the new results to be presented:

Add to active suites – new results will be added to the previously collected statistics.
Replace active suites – the already collected data will be overwritten.
Do not apply collected coverage data – new results will be ignored.
Configure the coverage settings
Code coverage settings are gathered in the : 
In the Tools section, you can provide custom paths to gcov / llvm-cov / llvm-profdata. By default, CLion takes the paths from the PATH environment varible.
Record branch coverage data - with this option enabled, the compiler-generated branches of code will be taken into account when collecting coverage data. It means that if a code line was expanded by the compiler into a block of several branches, some of which have not been executed (for example, in the case of handling an exception), that line will be marked as partially covered.
Troubleshooting and current limitations
If you get empty coverage reports, check whether your compiler version matches the version of gcov / llvm-cov tool (default or custom) that you are using. Keep this in mind when changing compilers or switching from one Windows toolchain to another.
Code coverage is not yet supported for the Remote toolchain (CPP-17709).