Embedded GDB Server
To debug on-chip with a GDB server, you need to create a special run/debug configuration. In CLion, you can quickly create configurations using the New Embedded Configuration wizard for the following GDB servers:
Segger J-Link GDB server
Qemu as a GDB server
st-util (open-source GDB server for ST-LINK debug probes)
ST-LINK_gdbserver (a part of STM32CubeIDE)
You can also create a run/debug configuration for any other debug probe software that complies with the GDB server protocol. To do this, add a new Embedded GDB Server configuration from the Run/Debug Configurations dialog. For more information, refer to Adjust the Embedded GDB Server configuration.
Before you start
Configure a cross-compiler toolchain.
Make sure the selected GDB server is installed on your machine. There is no need to launch it manually: the configuration will run the GDB server automatically when you start a debug session.
Create an Embedded GDB Server configuration
Select the action in the main menu.
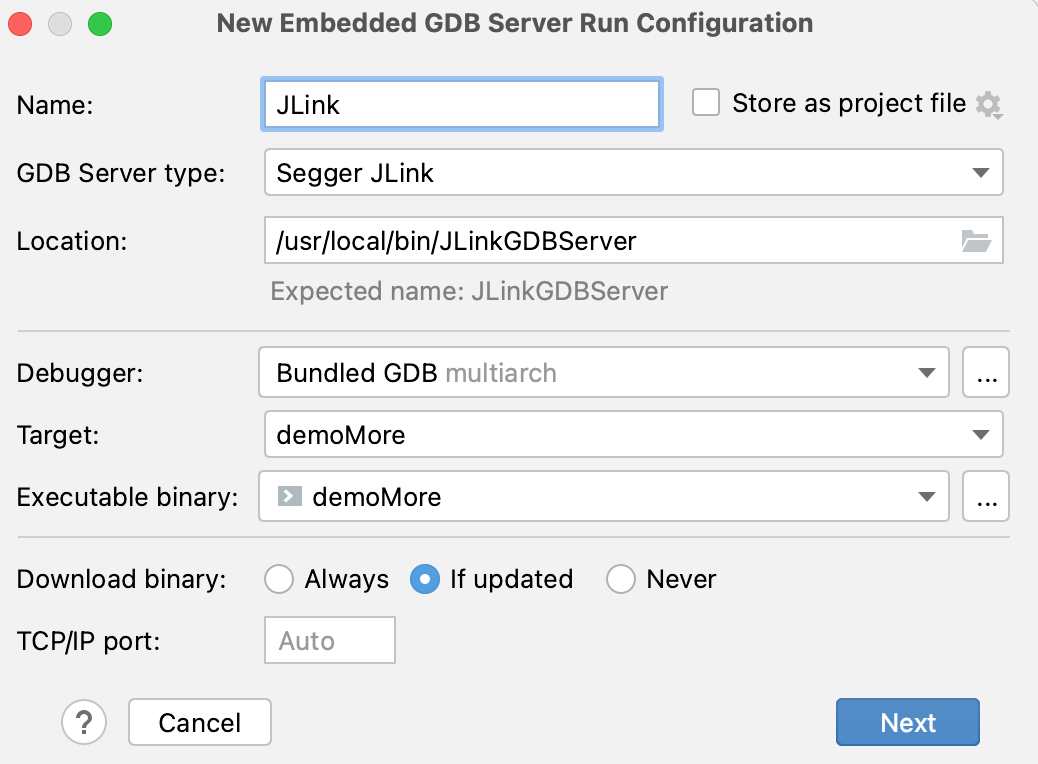
In the wizard that opens, set up the following:

GDB Server type: select the type of the GDB server. CLion will automatically predefine necessary arguments for this server.
Location: specify the full path to the binary that will be used as a GDB server.
Debugger: select the GDB debugger, which will run on the CLion's side and connect to the remote GDB server. Use either the bundled GDB or your custom GDB binary.
Target and Executable binary: select the target to be built and the executable binary that will be downloaded to the device.
Download executable: specify when to download the executable binary to the target device:
Always: every time you start a debug session.
If updated: only upon the changes in the binary.
None: skip downloading.
TCP/IP port: explicitly specify a port for the GDB server or leave this field empty to use a random one.
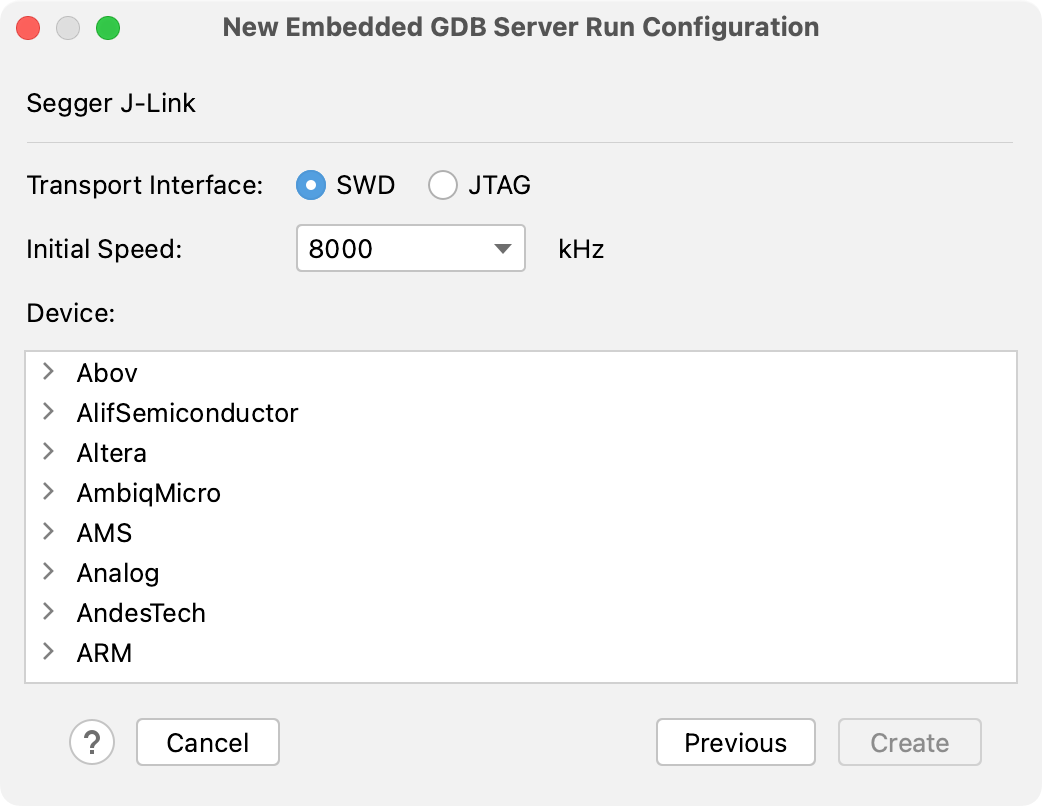
Click Next. On the next wizard page, you can adjust the settings specific to the selected GDB server type. For example, for the Segger JLink server, you can select a transport interface type, initial speed, and a device:

Click Create. A new run/debug configuration for an embedded GDB server will be created with the necessary arguments for the specified server. See the next procedure on how to adjust it.
Adjust the Embedded GDB Server configuration
Go to and select the configuration that you want to edit.
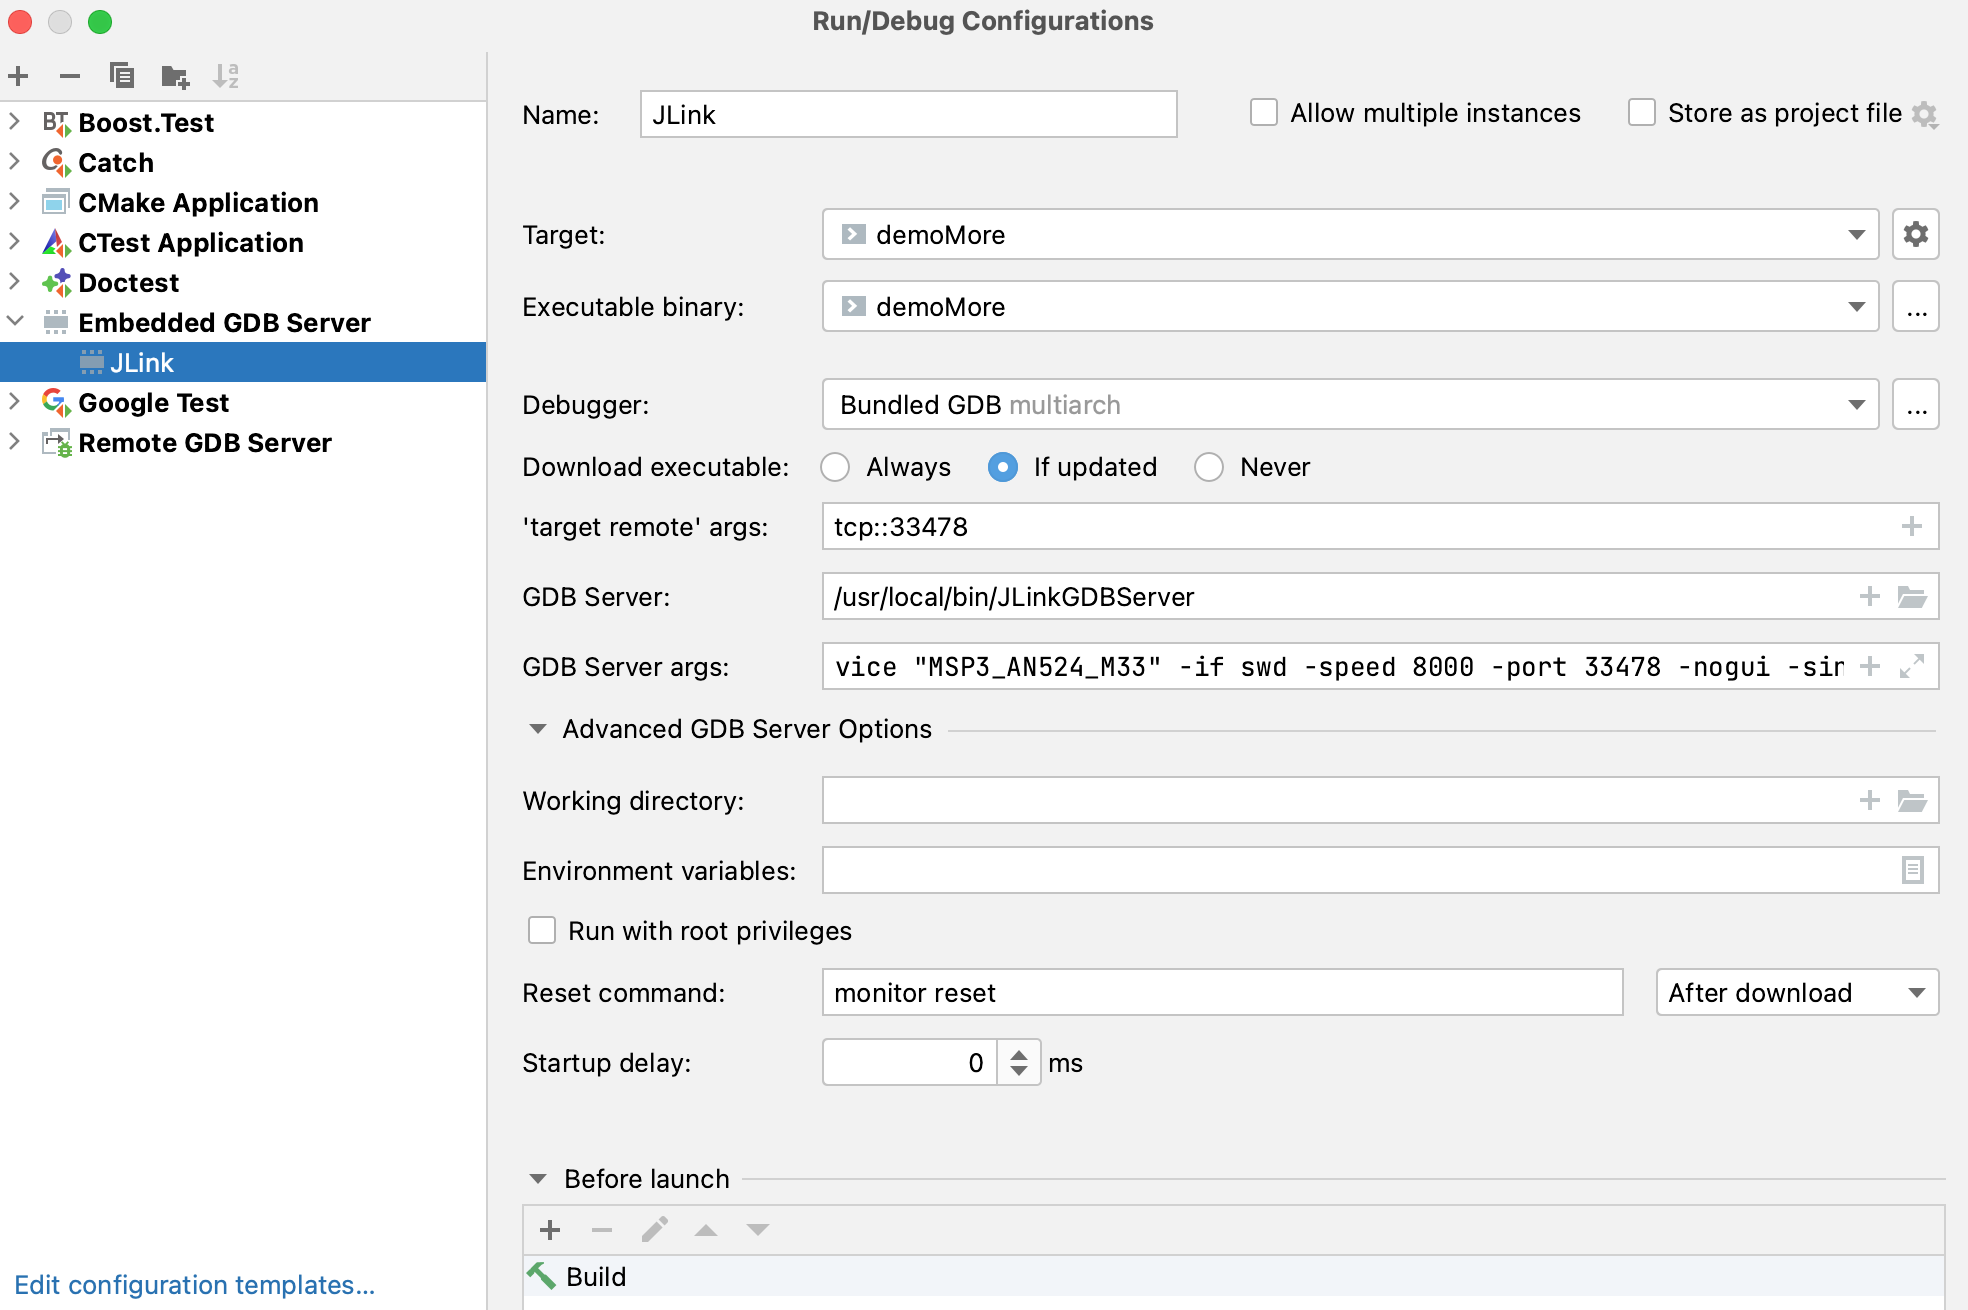
From here, you can configure the following settings:

Debugger: select the GDB debugger, which will run on the CLion's side and connect to the remote GDB server. Use either the bundled GDB or your custom GDB binary.
Target and Executable binary: select the target to be built and the executable binary that will be downloaded to the device.
Download executable: specify when to download the executable binary to the target device:
Always: every time you start a debug session.
If updated: only upon the changes in the binary.
None: skip downloading.
'target remote' args: provide the medium to carry debugging packets (serial line or an IP network using TCP or UDP). For more information about connecting to a remote target, refer to gdb documentation.
GDB Server: specify the binary to be used as a GDB server.
GDB Server args: provide the GDB server-specific arguments (for example, port number or board config file).
: by default, this command is sent after flashing the MCU and also when you press
during a debug session. It usually starts with monitor, and the rest of the line is passed to the GDB server directly.
Note that most GDB servers support several reset commands (refer to your vendor-specific documentation). Reset can be performed at different stages: Before or After flashing MCU ROM or writing to RAM, Always (both before and after), or Never.

: the amount of time CLion will wait after starting the GDB server before attempting to connect.
Debug an Embedded GDB Server configuration
When you Debug this configuration, CLion performs a sequence of steps:
Start GDB server with the specified environment.
Wait until the configured startup delay time passes.
Start GDB client and connect to the GDB server.
Upload the binary as specified by the Download option in the configuration settings.
Start the debug session.
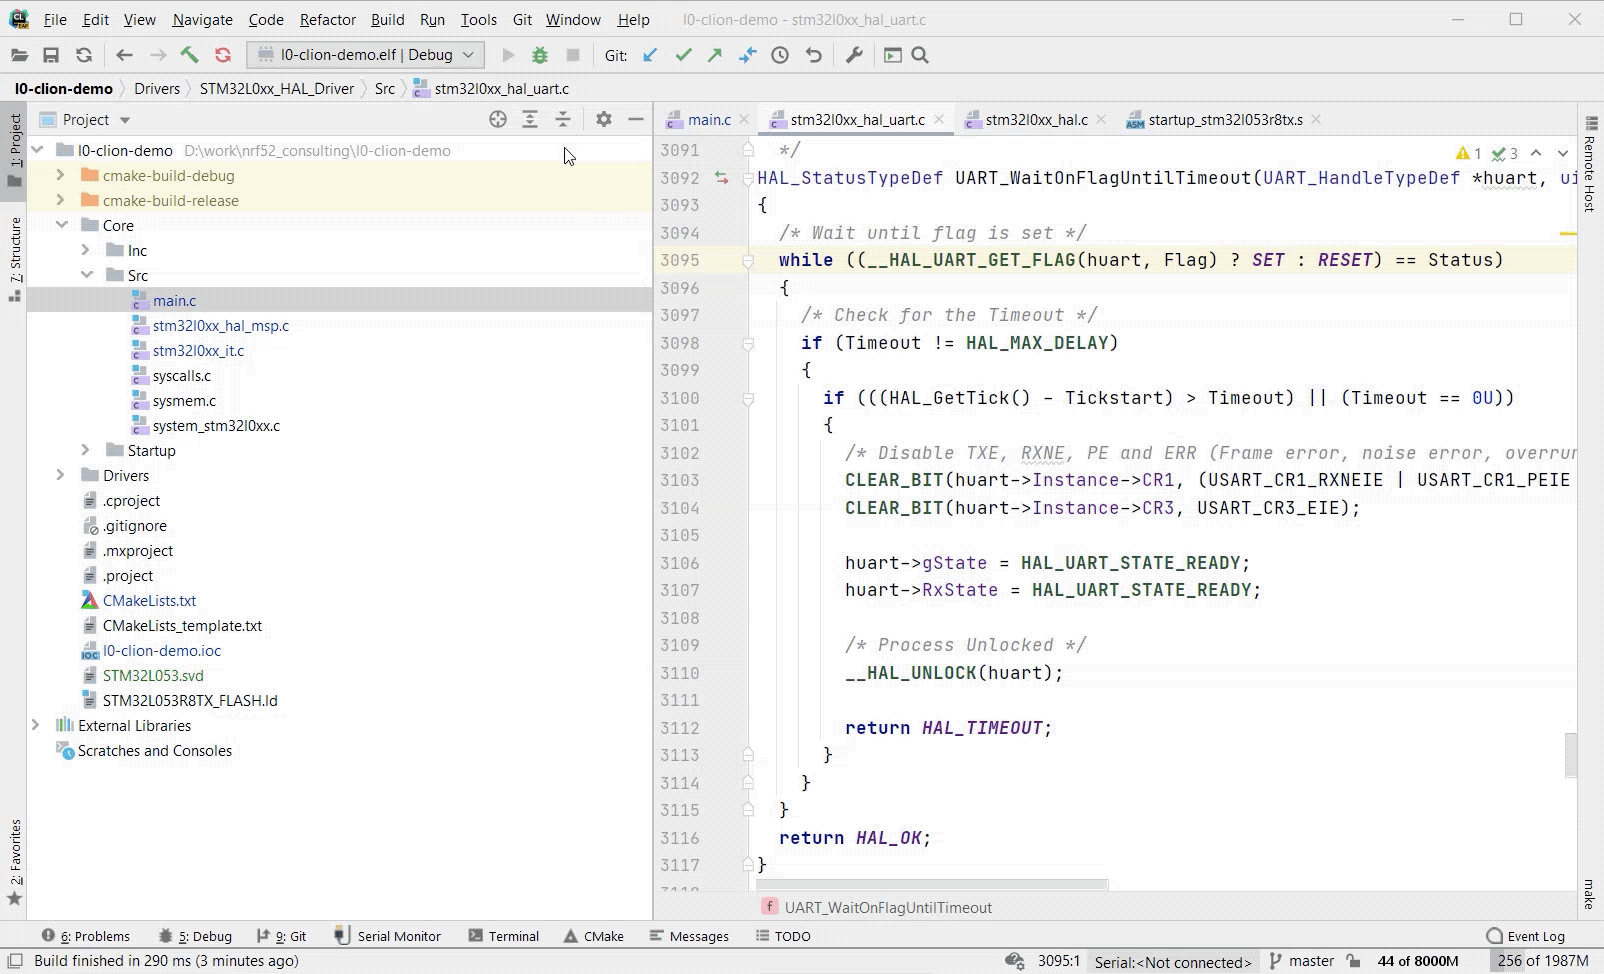
Now your firmware running on-chip can be debugged using the entire set of CLion debug features, including Memory view, multi-threaded RTOS debug, and the Peripherals tab showing peripheral registers and bits.

Notice the
button on the left-hand bar of the Debugger tool window. When pressed, it sends the chip reset command specified in the Reset command field of the configuration settings.
Set up the PEmicro GDB server
Download PEmicro GDB Server for ARM devices - Eclipse Plugin (registration required).
Unzip the downloaded archive to a temporary folder.
Unzip the plugins/com.pemicro.debug.gdbjtag.pne_<version>.jar file into a desired installation folder.
Use the \win32\pegdbserver_console.exe, osx/pegdbserver_console, or lin/pegdbserver_console file from that folder as a GDB Server binary, depending on your operating system.