Profiler
With CLion's CPU profiler integration, you can analyze the metrics of performance collected for your application (both kernel and user's code). The profiler is available on Linux and macOS, and the implementation is based on the Perf and DTrace tools respectfully.
Perf and DTrace use sampling at a fixed rate to interrupt the application and collect program counter and stack traces, which are then translated into profiling reports. Such reports can be long and difficult to analyze, so CLion provides visualization for the profiler's output data.
Prerequisites
Install the Perf tool for your particular kernel release.
Use
uname -rto find out the exact version, and then install the corresponding linux-tools package. For example:$ uname -r 4.15.0-36-generic $ sudo apt-get install linux-tools-4.15.0-36-genericAdjust kernel options
perf_event_paranoid - controls the use of the performance events data by non-root users.
Set the value to be less than 2 to let the profiler collect performance information without root privileges:
sudo sh -c 'echo 1 >/proc/sys/kernel/perf_event_paranoid'You can find the description of possible values in the kernel documentation. Usually,
1or0is enough for the profiler to run and collect data. However, if you get empty profiling results (the No profiler data message), your system setup might require-1- the least secure option, which allows using all performance events by all users.kptr_restrict - sets restrictions on exposing kernel addresses.
To have kernel symbols properly resolved, disable the protection offered by kptr_restrict by setting its value to 0:
sudo sh -c 'echo 0 >/proc/sys/kernel/kptr_restrict'
By default, these changes affect your current OS session only. To keep the settings across system reboots, run:
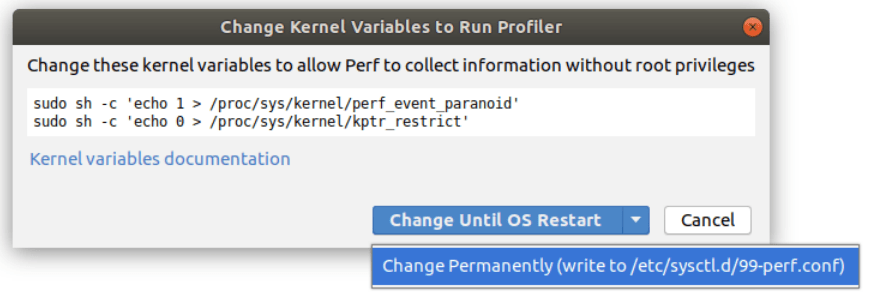
sudo sh -c 'echo kernel.perf_event_paranoid=1 >> /etc/sysctl.d/99-perf.conf' sudo sh -c 'echo kernel.kptr_restrict=0 >> /etc/sysctl.d/99-perf.conf' sudo sh -c 'sysctl --system'Upon the first launch of the profiler, CLion checks whether kernel variables are already set up and suggests the necessary changes:
The only required tool is DTrace, which is most likely installed by default on your macOS. Check it by calling the
dtracecommand in the terminal.
CLion automatically detects the Perf or DTrace executable in case its location is included in the PATH environment variable. You can also set the path manually in .
CPU profiling
Prepare the build
The profiler relies on debug information to provide meaningful output data and navigation, so Debug configurations are preferable to be used for profiling.
Compiler optimizations, such as inlining, can influence profiling results. To make sure none of the frames are missing due to inlining, set the optimization level to
-O0in your CMakeLists.txt:set(CMAKE_C_FLAGS "${CMAKE_C_FLAGS} -O0") set(CMAKE_CXX_FLAGS "${CMAKE_CXX_FLAGS} -O0")Also, compilers can use the frame pointer register as a general-purpose register for optimization purposes, which may lead to broken stack traces. On Linux, the profiler implementation does not depend on this, but on macOS, we recommend setting the
-fno-omit-frame-pointercompilation flag for gcc and both-fno-omit-frame-pointerand-mno-omit-leaf-frame-pointerfor clang.
Configure sampling frequency
The default sampling rate value is rather high, which might require a lot of disk space for long-running programs.
If required, you can change the profiler's sampling frequency in .

When choosing a sampling rate, mind other timer-driven activities that may be scheduled in your system. As an example, the default value is set to 99 Hertz instead of 100 Hertz to avoid lockstep sampling with other possible activity with a sampling frequency of 100Hz.
Set the Perf output directory (Linux)
By default, the output of Perf is placed into /tmp, which can have limited capacity. In case it gets full during profiling, the program terminates with an error. To avoid this, you can configure another directory to be used for profiling output in .

Run the profiler
Use one of the following options:
Select a run configuration from the list on the toolbar and click
or call from the main menu:

Alternatively, select
Profile from the left gutter menu of a program entry point or a function that you want to profile:

You can also attach the profiler to a running process (call ):
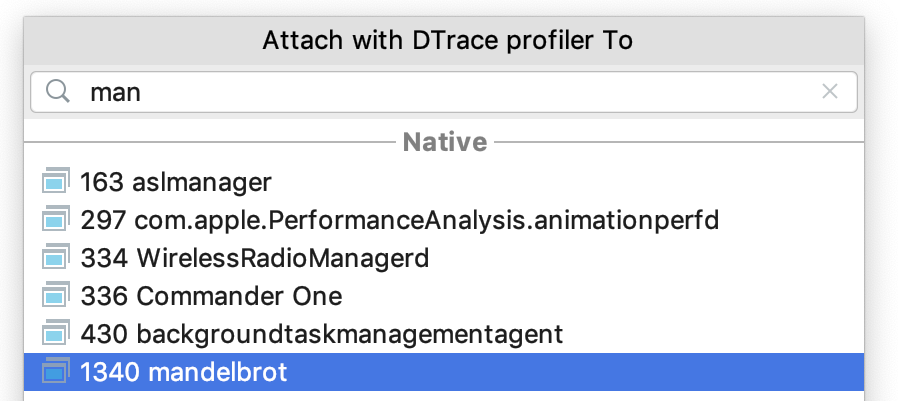
When you launch profiling, CLion notifies you if the profiler is attached successfully.
After the application stops, and the profiling data is ready, CLion shows a balloon with a link to the CPU Profiler tool window (also accessible from the main menu ):

To stop the profiler prior to stopping the application, use the Stop button in the Profiler tool window.
Read the profiling report
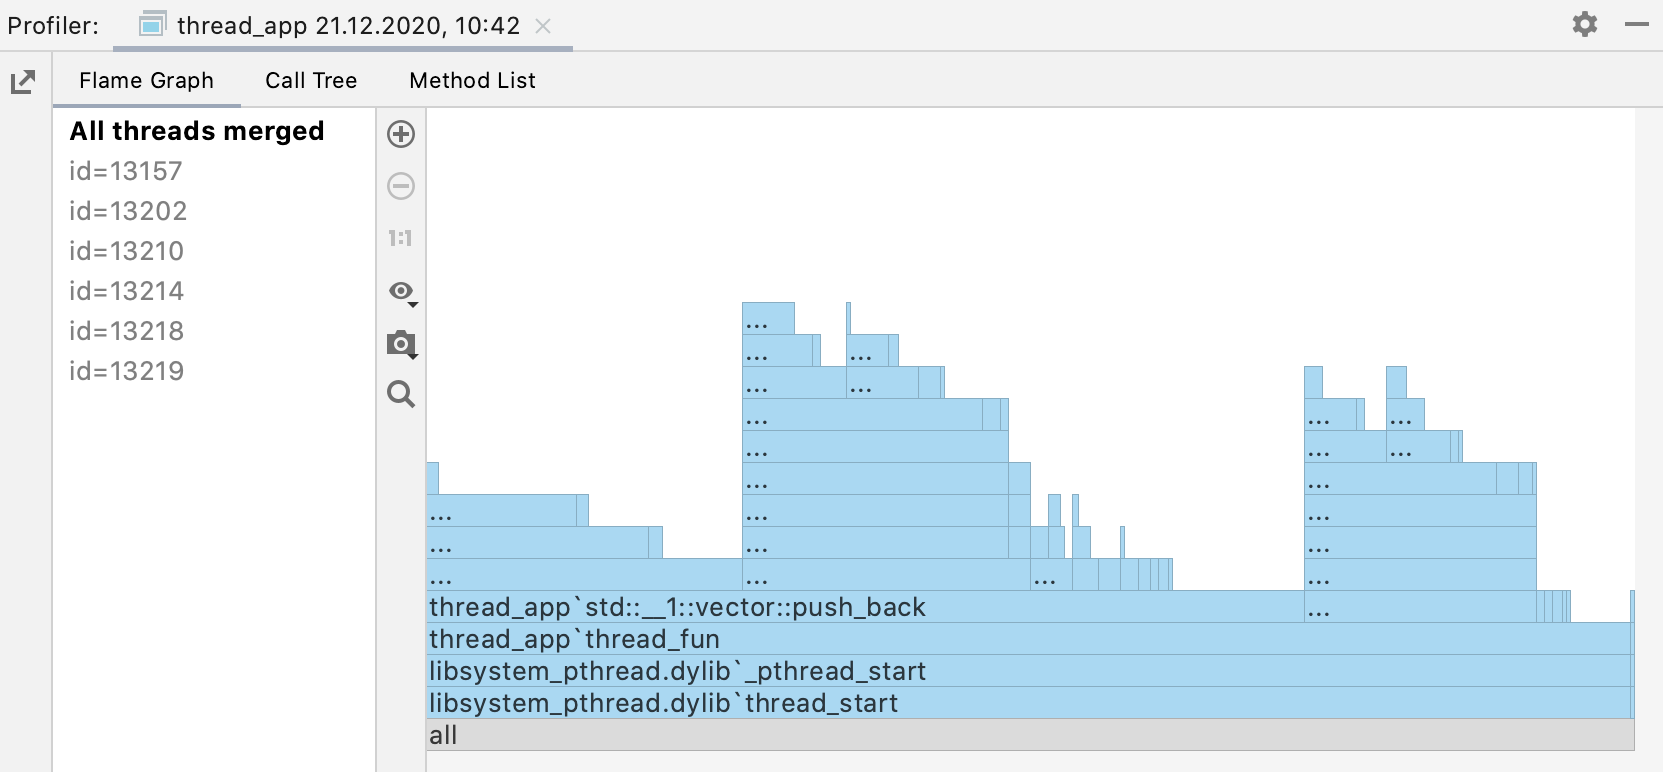
In the CPU Profiler tool window, you can see the collected data presented in three tabs: Flame Graph, Call Tree, and Method List. The left-hand part lists the application threads and All threads merged. On Linux, CLion shows meaningful thread names if they were set in the program, and on macOS thread names are shown as id-s.
Navigate the report
The Profiler tool window allows you to jump between the tabs while staying focused on a specific function.
Right-click the necessary function and select another view in which you want to open it:
Locate the selected function in another tab (for example, Focus on method in Method List for a Flame Graph block).
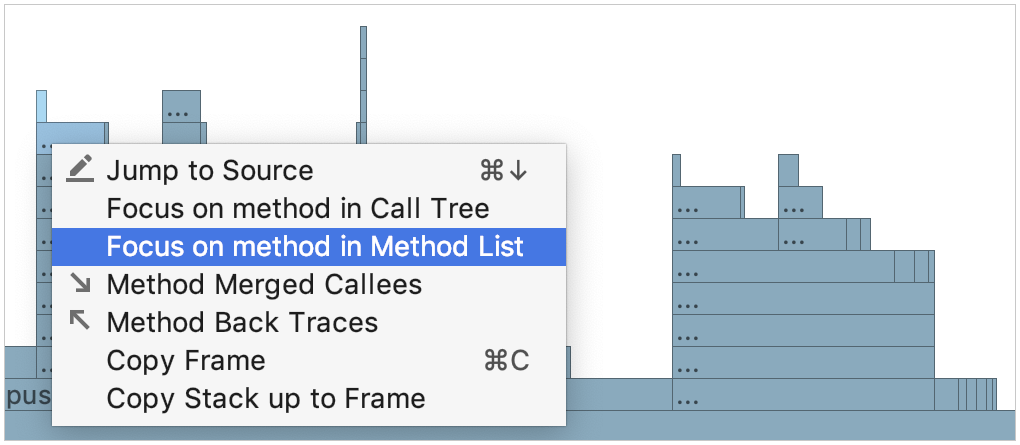
Navigate to the source code (Jump to Source).
Copy frame information to clipboard; only the frame name (Copy Frame) or the sequence of frame names from the stack bottom up to the selected frame (Copy Stack up to Frame).
Flame Graph
Raw profiling data collected by Perf or DTrace is a call tree summary. Flame Graphs visualize it as a collection of stack traces: the rectangles stand for frames of the call stack, ordered by width.
Each block represents a function in the stack (a stack frame). The width of each block corresponds to the function’s CPU time used. On the Y-axis, there is a stack depth going from bottom up. The X-axis shows the stack profile sorted from the most resource-consuming functions to the least consuming ones.
When reading the flame graph, focus on the widest blocks. These blocks are the functions most presented in the profile. You can start from the bottom and move up, following the code flow from parent to child functions, or use the opposite direction to explore the top blocks that show the functions running directly on the CPU.
Show details in tooltips
Hover over a block to display a tooltip:
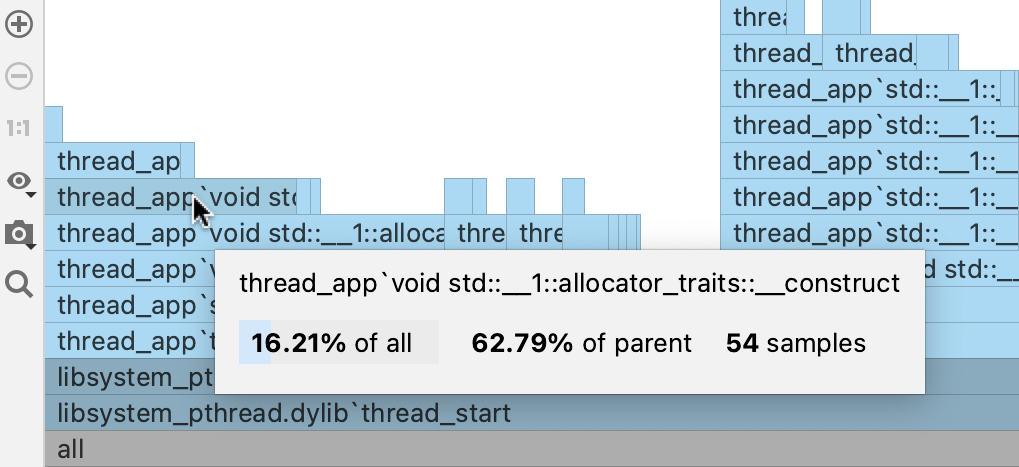
The tooltips show the fully qualified function name, the percentage of the parent sample time, and the percentage of total sample time.
Zoom the graph
Use the
and
options to zoom the graph.
To focus on a specific function, double-click the corresponding block on the graph.
To restore the original size of the graph, click 1:1.
Search the graph
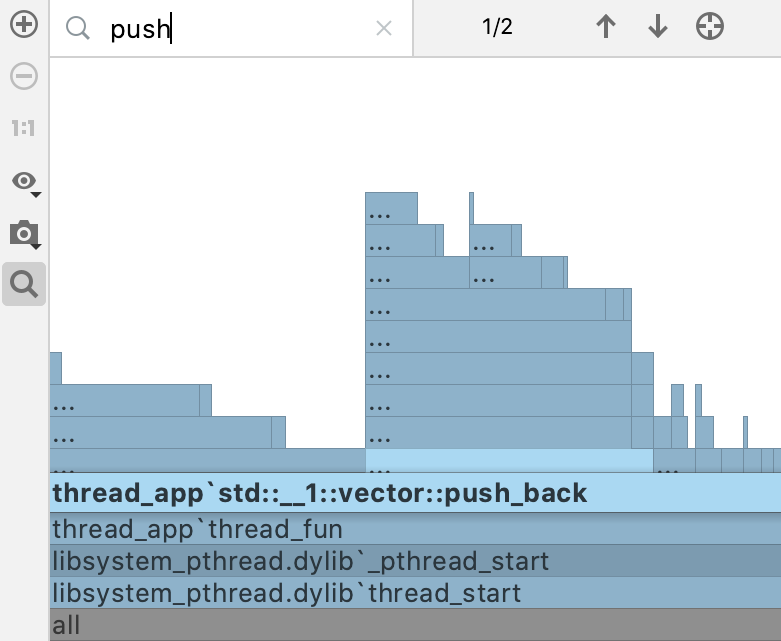
If you want to locate a specific function on the graph, start typing its name. The graph highlights all blocks with the names matching your search request.
Use
and
for fast navigation between search results. You can also search either in the whole graph or just in a specific subtree.
Capture the graph
You can capture and export the graph separately from other data in the report.
Click
and select Copy to Clipboard or click Save to export the graph as an image in the .png format.
Call Tree
The Call Tree tab represents information about a program’s call stacks that were sampled during profiling. The top-level All threads merged option shows all threads merged together into a single tree. There's also a top-down call tree for each thread.

For each function, the tab shows the following information:
Functions' names
Percentage of total sample time or parent's sample time
The total sample count
Recursive calls
Collapse recursive calls
A complex application that has multiple recursive functions may be very difficult to analyze. In a regular Call Tree view, recursive calls are displayed as they are called – one after another, which in case of complex call stacks with multiple recursive calls leads to almost infinite stack scrolling.
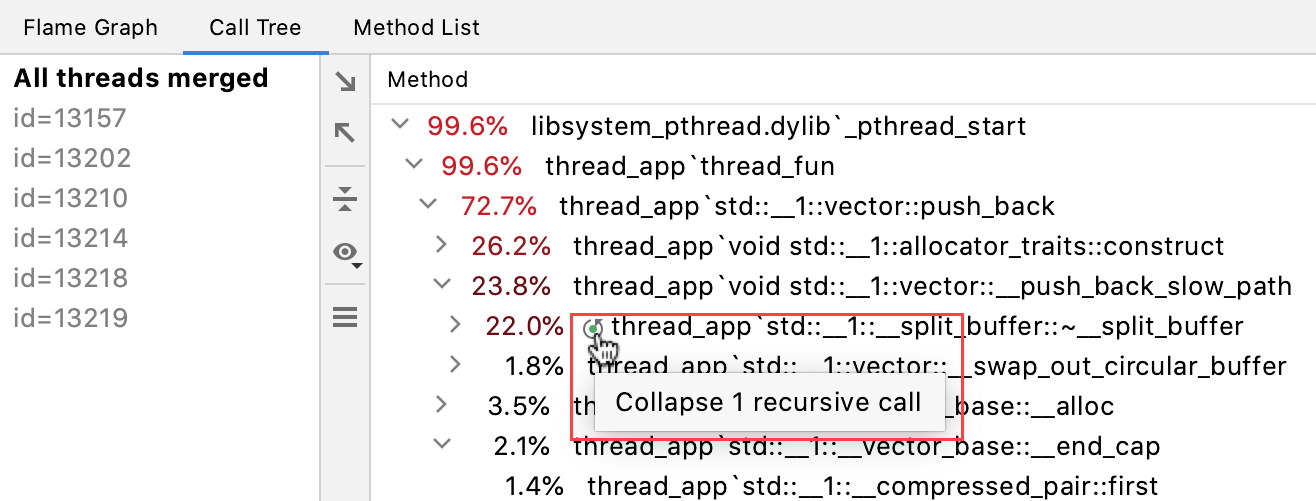
CLion detects a recursion when the same function is called higher up in the call stack. In this case, the subtree is taken out of the call tree and then attached back to the first invocation of that function. This way you can bypass recursion and focus on functions that consume most of the resources and calls that they make.
Collapsing recursive calls allows you to see the total amount of time spent in these calls as if there was no recursion.

Folded recursive calls are marked with the icon on the Call Tree tab. Click it to open the recursive call tree in a separate tab. You can preview the number of merged stacks in a tooltip.
What-if: focus on specific functions
CLion allows you to examine specific functions in the Call Tree: you can exclude particular functions or other way around, focus only on the functions in which you are interested at the moment.
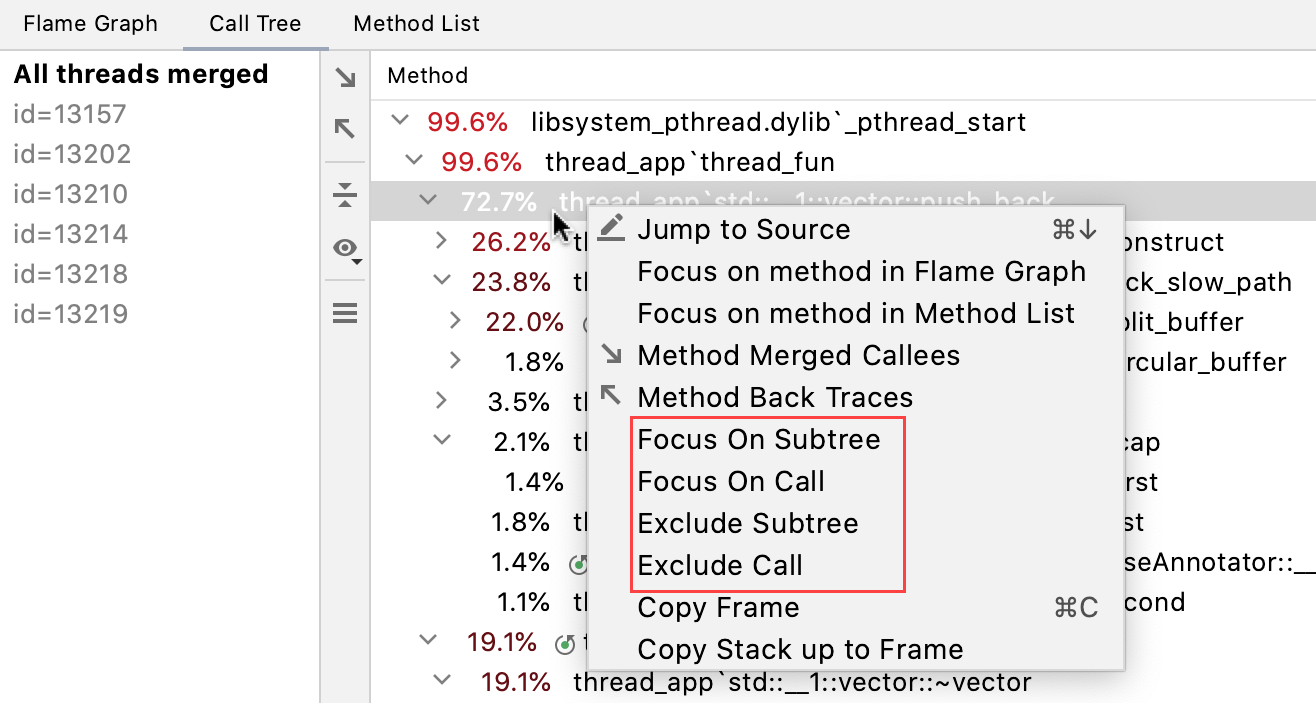
Right-click the necessary function on the Call Tree tab and select one of the following options to open the results in a dedicated tab:
Focus on Subtree: show only the selected function call. Parent function sample time counter shows only the time spent in the selected subtree.
Focus on Call: show the selected function and the functions that call it. When this option is enabled, every time frame shows only the time spent in the selected function.
Exclude Subtree: ignore the selected function call.
Exclude Call: ignore all calls to the selected function.
Filter calls
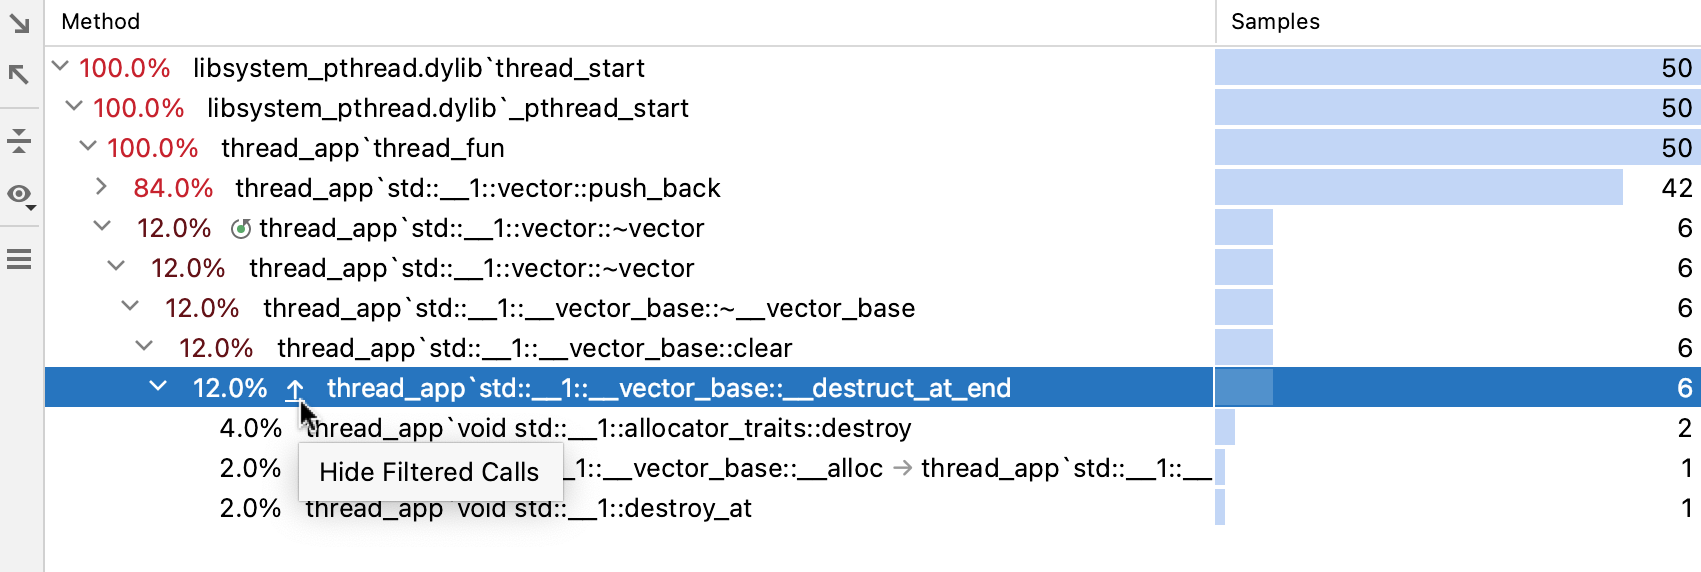
You can collapse/expand frames in the Call Tree. This is useful, for example, when you want to hide library classes or classes from specific frameworks and focus on the application code.
Use the up and down arrows in the tree to hide or show calls:
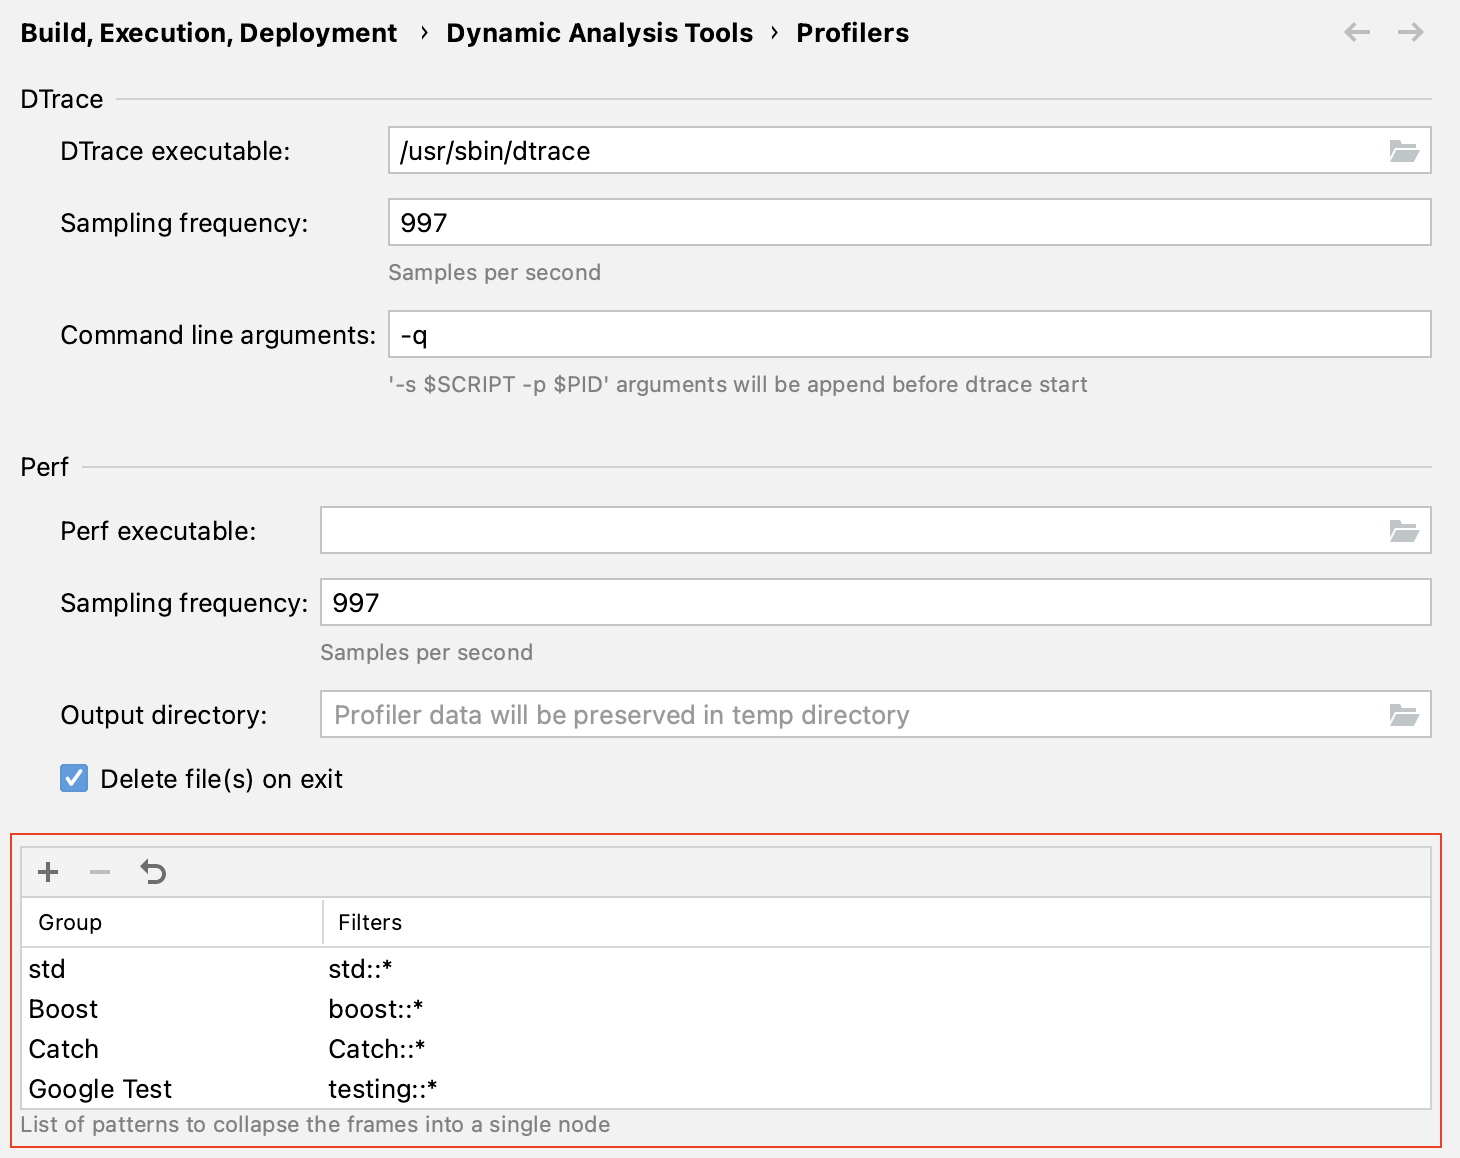
You can review and adjust the list of patterns used to collapse the Call Tree frames in :
Method List
The Method List collects all functions in the profiled data and sorts them by cumulative sample time.
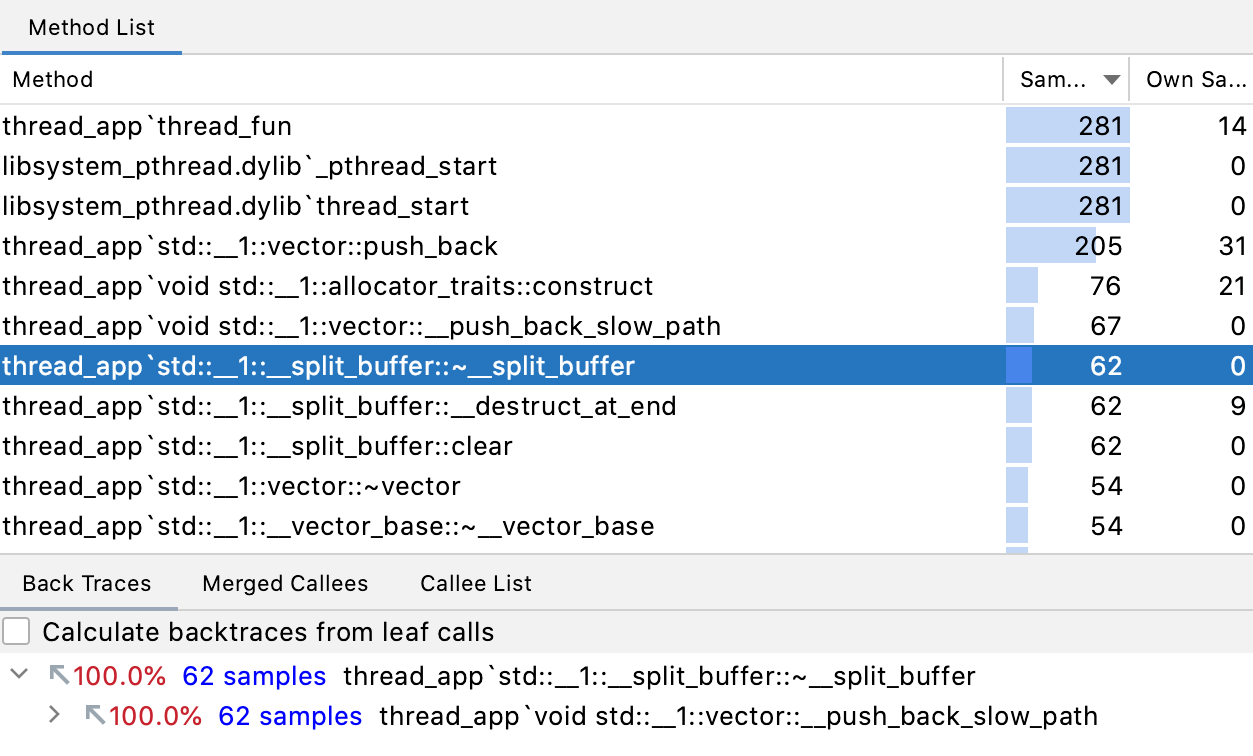
In the Samples column, you see the total number of samples for each function. The Own Samples column shows the number of those samples where the stack trace ends on the current function (not on its callees). The Own Samples values may be helpful when examining long-running functions that don't call other functions.
For each function from the list, you can view Back Traces and Merged Callees.
Export and import profiler results
In CLion, you can export/import profiling results on all platforms. This is especially useful when profiling on a remote or embedded target and then importing the results locally.
Export profiling results
Click
on the left frame of the Profiler tool window ().
In the dialog that opens, name the file, specify the folder in which you want to save it, and click Save.
The results are exported into a .collapsed file. This file includes call traces in the format used by the FlameGraph script. The format is standardized and presents the collection of call stacks, where each line is a semicolon-separated list of frames followed by a counter.
Import profiling results
Select from the main menu.
Choose a new file or one of the recently opened ones.