Debugger console
During a debug session, you can access the GDB/LLDB console directly from CLion: in the Debug tool window, open the Debugger tab, and then open the tab marked with ![]() .
. 
This tab shows the debugger's output/error stream and lets you run GDB/LLDB commands.
Useful shortcuts
| Ctrl+Shift+F10 | Quick switch to the debugger console (only available during a debug session). In case the Debug tool window is hidden, this action opens it and focuses on the debugger console tab. |
| Ctrl+Space or Tab | Invokes command completion provided by GDB or LLDB, respectfully. 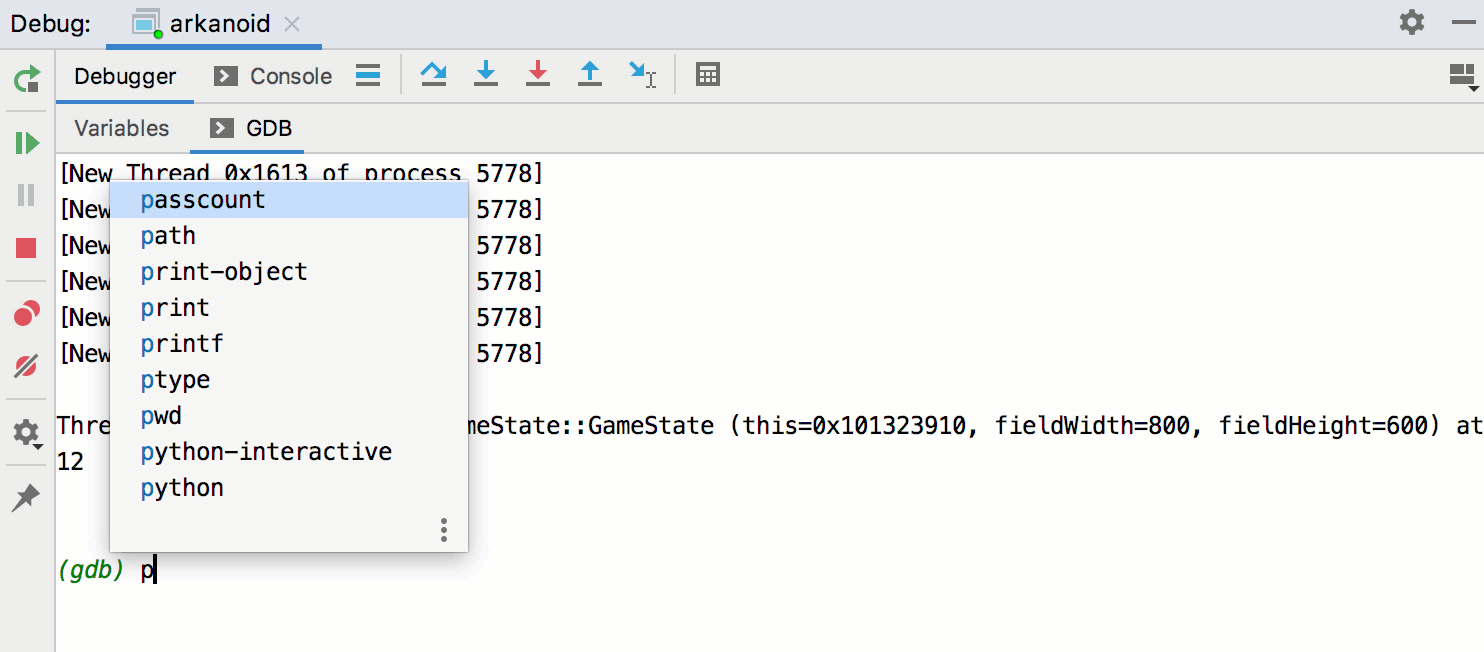 |
Last modified: 19 August 2020