Performance tuning tips
This article gives a summary of helpful techniques that you can use to improve CLion performance on large-scale projects.
Increase memory heap
Enable memory indicators
You can check whether performance slowdowns are caused by low heap memory by monitoring two indicators in the bottom right corner of the status bar: the general Memory Indicator and the Clangd Memory Usage indicator.

Both indicators can be switched on/off from the status bar menu available on right click:

Increase heap in the Change Memory Settings dialog
Select from the main menu.
In the dialog that opens, set a higher memory heap value in the Maximum Heap Size field.
Click Save and Restart.
Increase memory heap from Toolbox
You can also change the heap size from the Toolbox app:
In Toolbox, select your CLion version and click the screw nut button on the right.
From the menu that opens, select Settings:

Go to the Configuration section and set a new value in the Maximum heap size field:

Restart CLion.
Adjust -Xmx
Another option to increase memory heap is to modify the corresponding JVM option, -Xmx:
Go to - this action will create a copy of the .vmoptions file in the IDE config directory and open it in the editor.
Set
-Xmxto a higher value. For example,-Xmx4096mfor 4 GB value instead of the default 2 GB.Restart CLion.
CLion also warns you if the amount of the free heap memory is less than 5% of the maximum heap size: 
Click Configure to edit -Xmx in the Memory Settings dialog: 
Change the memory value allocated for Clangd
Select from the main menu and search for Registry.
In the Registry dialog, start typing clion.clangd.max.memory.
Set the desired value and close the dialog.

Speed up code analysis
Tune analysis for a file
On-the-fly code analysis is one of the most performance-consuming processes in CLion. To lighten it up, you can configure the highlighting level for the currently opened file: none, errors only, or all problems. Use inspection widget in upper-right corner of the editor: 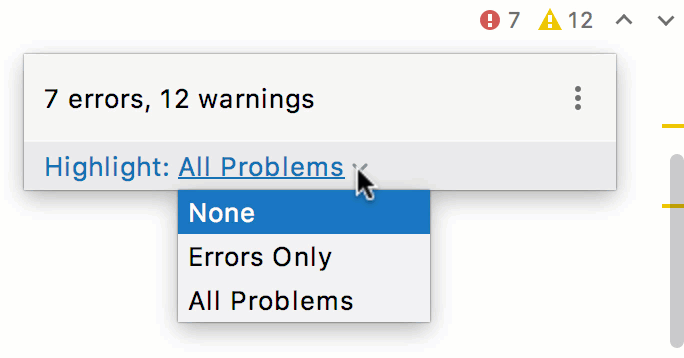
Toggle Power Save mode
As an alternative to configuring individual checks or files one by one, try Power Save Mode. It disables all inspections and other highly-consuming background tasks for the entire IDE.
To enable Power Save Mode call .
Check the Clangd-based engine
CLion incorporates a complementary Clangd-based language engine which is enabled by default. Currently, it works for error/warning annotation, certain navigation tasks, code formatting via ClangFormat, and code highlighting with quick-fixes.
In most cases, Clangd-based engine works faster than the built-in one (and sometimes provides more accurate results). However, it is not used for all operations. For example, Clangd provides the location for a quick-fix, while the fix itself is performed by the CLion’s own engine. Or, Find Usages employs Clangd to search through the files currently opened in the editor and the CLion’s own engine for all other usages.
We recommend you take Clangd engine specifics into account when investigating performance issues. Use to experiment with the engine settings and see if they affect the performance on certain tasks.
Speed up indexing
Exclude directories and file types
By default, CLion indexes all the directories listed in CMakeLists.txt (sources and include_directories paths) for the purpose of correct resolve. Meanwhile, your project may contain folders with binaries, logs, or build artifacts, which do not affect CLion code insight. Also, indexing some folders can be too expensive due to their size or location. So it is reasonable to exclude such folders manually: right-click the directory in the project tree and choose Mark Directory as | Excluded. 
Since the symbols from the excluded files remain uncompleted for CLion, the following features are not available for such files: code completion and auto-import (except for the case when the excluded directory is marked with include_directories in CMakeLists.txt), code generation, Find in Files (except for the scope of the currently opened files), navigation, and refactorings.
Another way to eliminate files like logs or generated data from indexing is to exclude them by file type in : 
Work with smaller CMake sub-projects
The scope of files being parsed is determined by the loaded CMake script. So if your project is split into several subdirectories with self-contained CMakeLists.txt in each of them, you can load smaller sub-projects separately (for this, run Load CMake project on sub-CMakeLists.txt): 
Another alternative for the case when you need to explore only a part of a big project is to create a compilation database, reduce it to the part of interest, and then open as a project in CLion.
Eliminate heavy parsing with the _CLION_IDE__ macro
IDE freezes may happen during the parsing of intricate preprocessor macros. To eliminate such problematic definitions from your code, replace them with some dummy ones using the __CLION_IDE__ macro: 
This macro affects parsing only, and it is undefined when you build or run your code.
Disable unnecessary plugins
To increase the IDE performance, try disabling the plugins you don't need. You will always be able to turn them on again later.
For example, if you are using a particular testing framework, consider disabling the plugins for other testing frameworks supported in CLion.
Go to .
Browse the Installed tab and disable the unnecessary plugins:

You can also disable all manually installed plugins at once (the non-bundled ones) from the menu under
 :
:
Report performance problems
If you experience an IDE freeze or high CPU/memory usage, and the tips listed above do not help, please provide us with the IDE logs, thread dumps, and snapshots. See this instruction for details on how to retrieve and send them.