Agentic debugging
CLion exposes its debugger to external AI agents through the integrated MCP server. With the debugger tools connected, an agent such as Claude, Codex, or Junie can drive a CLion debug session on its own: start and stop it, manage breakpoints, step through code, inspect threads and variables, and evaluate expressions.
Instead of stepping through the code yourself, you describe the problem in natural language and let the agent collect the runtime evidence. This helps you locate issues that are hard to spot from the source code and logs alone, such as an incorrect value that appears only at run time.
Enable the Debugger MCP Toolset plugin
This functionality relies on the Debugger MCP Toolset plugin, which is bundled and enabled in CLion by default. If the relevant features are not available, make sure that you did not disable the plugin.
Press Ctrl+Alt+S to open settings and then select .
Open the Installed tab, find the Debugger MCP Toolset plugin, and select the checkbox next to the plugin name.
How the debugger reaches agents
CLion provides the debugger functions to agents in two ways:
The debugger tools are served over the MCP server together with the analysis, formatting, and other IDE tools. Their descriptions are part of the agent context at all times, even when you do not debug. The debugger tools are prefixed with
xdebug_. This option is available in CLion 2026.1.3 and later.- Router mode
The MCP server exposes one universal tool,
execute_tool, together with theclion-debuggerskill. The commands, parameters, and debugging scenarios live in the skill, and the agent loads them only when it needs the debugger. Because the debugger descriptions stay out of the agent context until then, router mode lowers token consumption. Router mode works with the GDB, LLDB, and DAP-based debuggers and is used by agents such as Claude Code and Codex. This option is available in CLion 2026.2 and later.
Connect an agent to the debugger
The debugger tools are served over the CLion MCP server, so a client gains access to them as soon as the server is enabled.
Enable the MCP server and set up your client as described in MCP Server.
Restart the client so that it picks up the CLion tools, including the debugger tools prefixed with
xdebug_.
You can review the exposed tools and turn individual tools on or off in the MCP Server settings.
Turn on router mode
In router mode, CLion keeps the debugger command descriptions out of the agent context until the agent needs them. The MCP server exposes one universal tool, execute_tool, and the agent loads the clion-debugger skill on demand. Router mode suits longer sessions, where the always-on tool descriptions take up context that the agent could spend on the task.
In the main menu, go to .
Select the Enable router-only mode checkbox. The debugger tools stay reachable through
execute_tool, and theclion-debuggerskill tells the agent when to use them. To turn router mode off, clear the checkbox.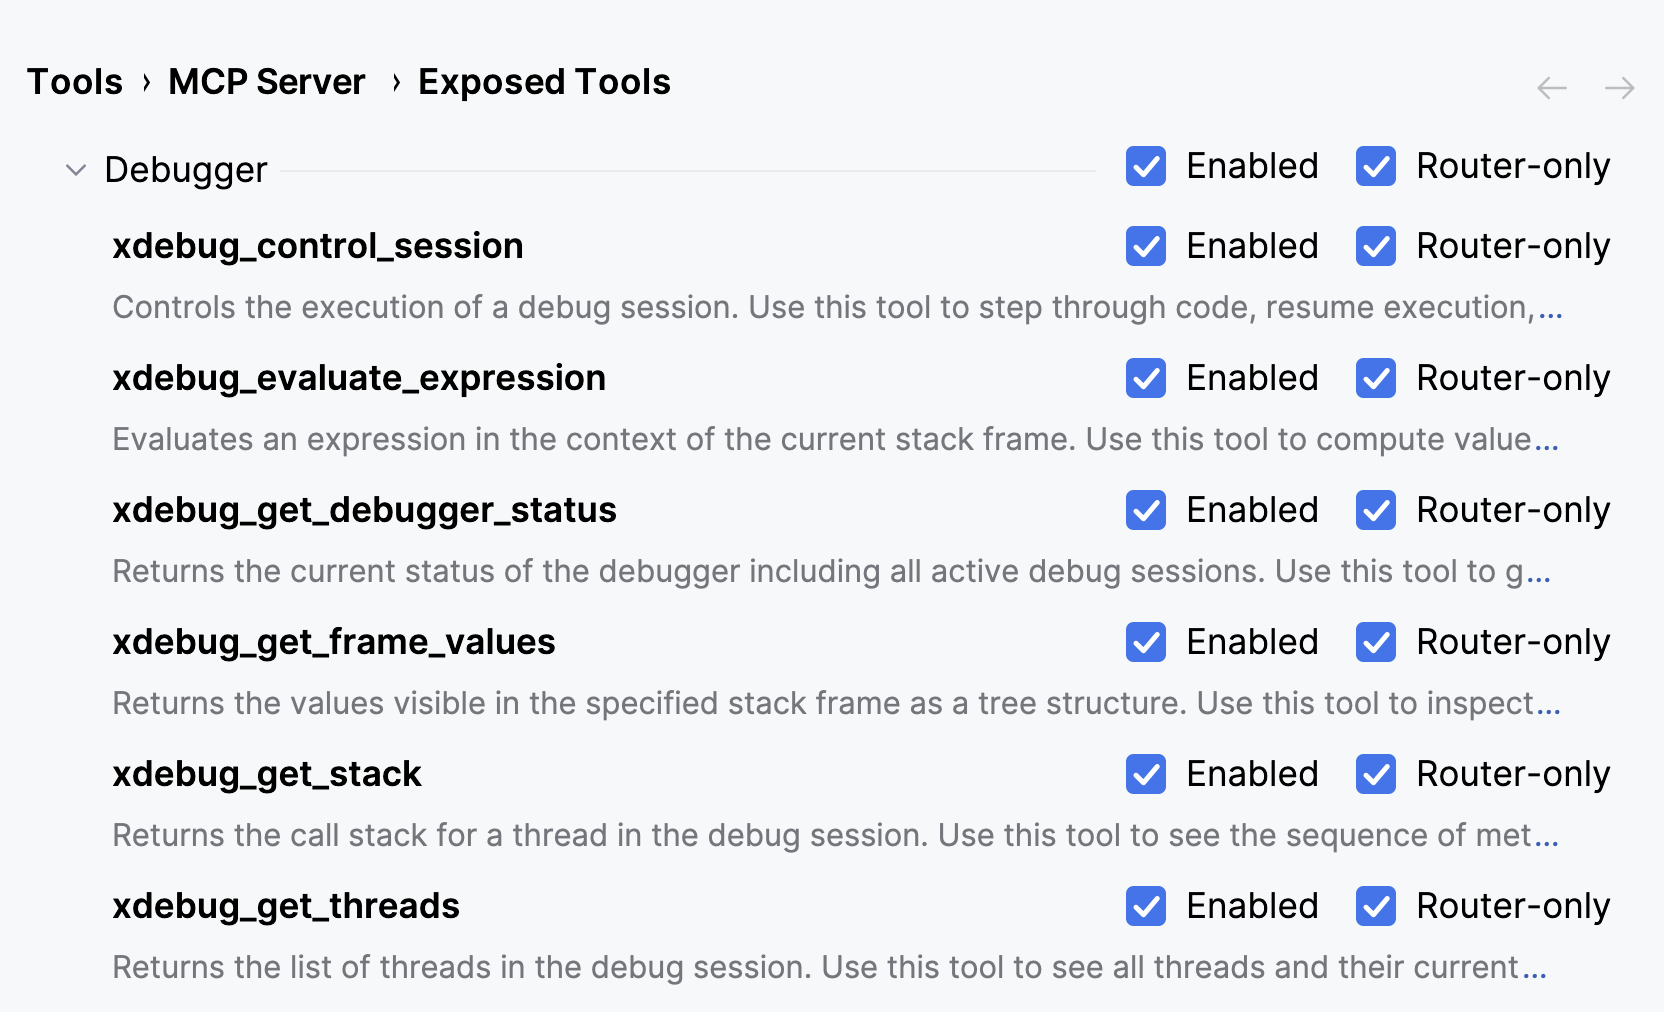
Install the debugger skill
To improve how external clients use the IDE's debugger tools, you can install a specific skill for them. This skill comes bundled with the IDE and guides an external client on when to apply the debugger tools.
To install the skill for an external client:
Go to .
Navigate to the Bundled skills section and locate the
clion-debuggerskill. It is enabled by default, but is available only to the agents inside the IDE.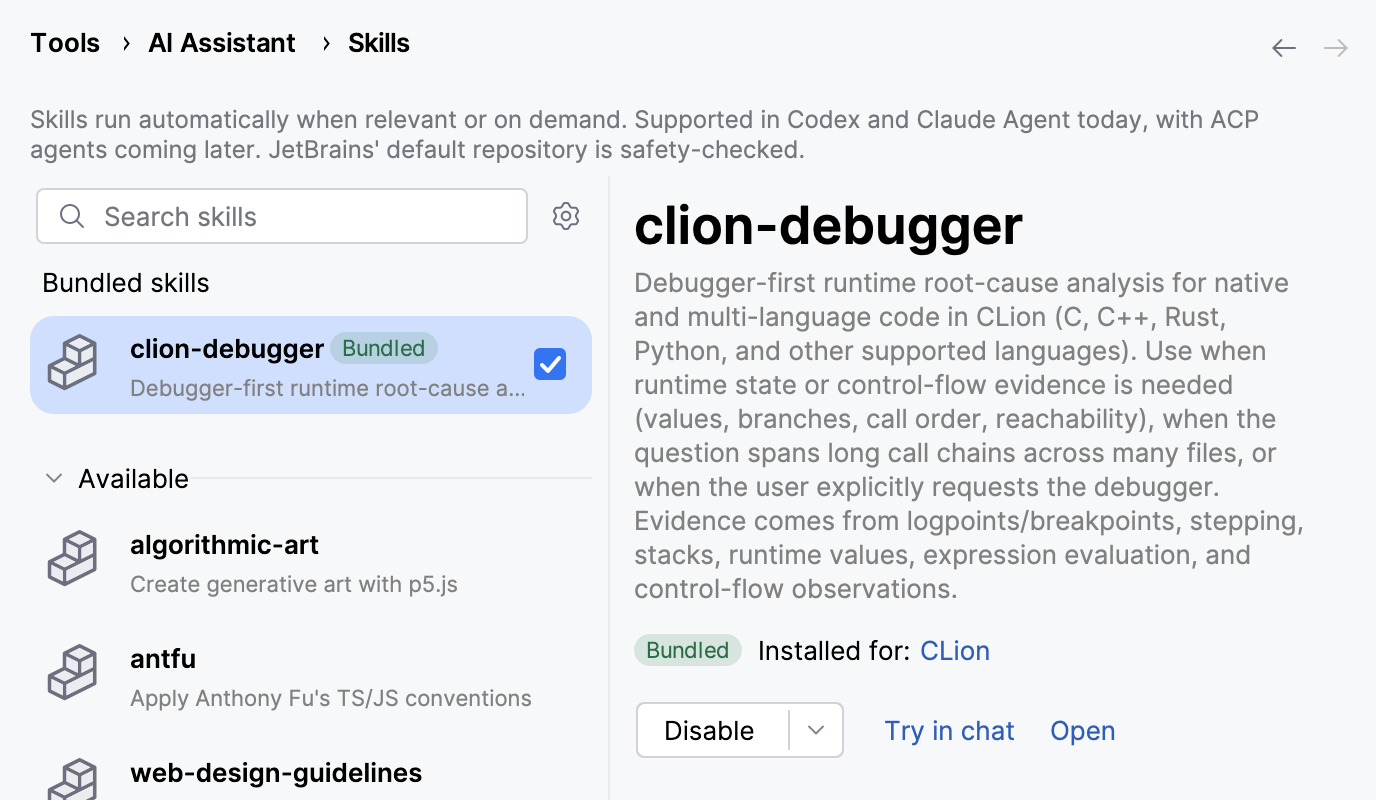
To use the skill in Claude Code or Codex outside the IDE, you need to install it for those clients explicitly. To do this, click
 and select Claude Agent (Global) or Codex (Global), depending on which client you want to use.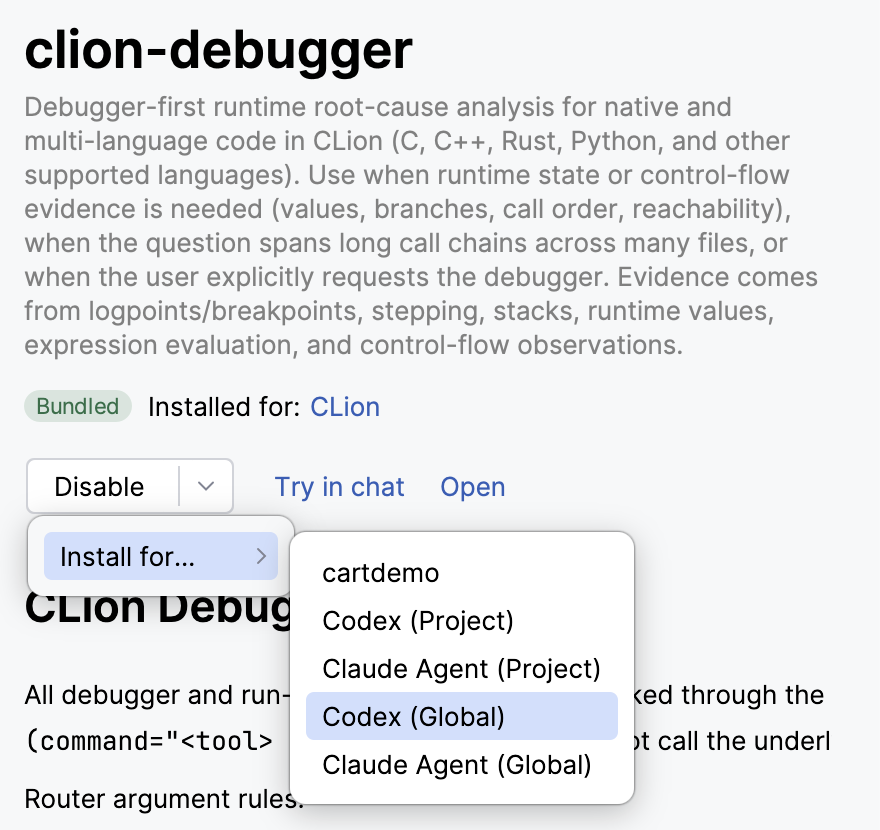
Depending on the target you select, the skill is installed into the following folders:
Claude Code:
%USERPROFILE%\.claude\skills\clion-debugger\
~/.claude/skills/clion-debugger/
~/.claude/skills/clion-debugger/
Codex:
%USERPROFILE%\.codex\skills\clion-debugger\
~/.codex/skills/clion-debugger/
~/.codex/skills/clion-debugger/
To invoke the skill in the external client, use /clion-debugger, or let it activate automatically when relevant.
What an agent can do
Through the debugger tools, an agent runs the same runtime investigation that you would perform manually:
Start a debug session for a run configuration or a source location, and check the status of running sessions (
xdebug_start_debugger_session,xdebug_get_debugger_status).List, set, and remove breakpoints, and run to a specific line (
xdebug_list_breakpoints,xdebug_set_breakpoint,xdebug_remove_breakpoint,xdebug_run_to_line).Control execution by stepping, resuming, pausing, or stopping the session (
xdebug_control_session).Read local variables, frame values, and nested fields, and evaluate or change expressions (
xdebug_get_frame_values,xdebug_get_value_by_path,xdebug_evaluate_expression,xdebug_set_variable).Inspect threads and their call stacks (
xdebug_get_threads,xdebug_get_stack).Read the CPU registers, the memory, and the machine instructions of a paused native session (
xdebug_get_registers,xdebug_read_memory,xdebug_disassemble).Decode the ARM Cortex-M fault status registers of a paused embedded session (
xdebug_get_fault_status). For details, refer to Debug ARM Cortex-M hard faults.
Debug your code with an agent
Open your project, then describe the problem to the agent and ask it to debug the code. For example:
The agent sets the breakpoints it needs, starts the debug session, and waits for the program to pause. When execution stops, it reads the call stack, the local variables, and the expressions it needs to test its hypothesis, and then reports what it finds.
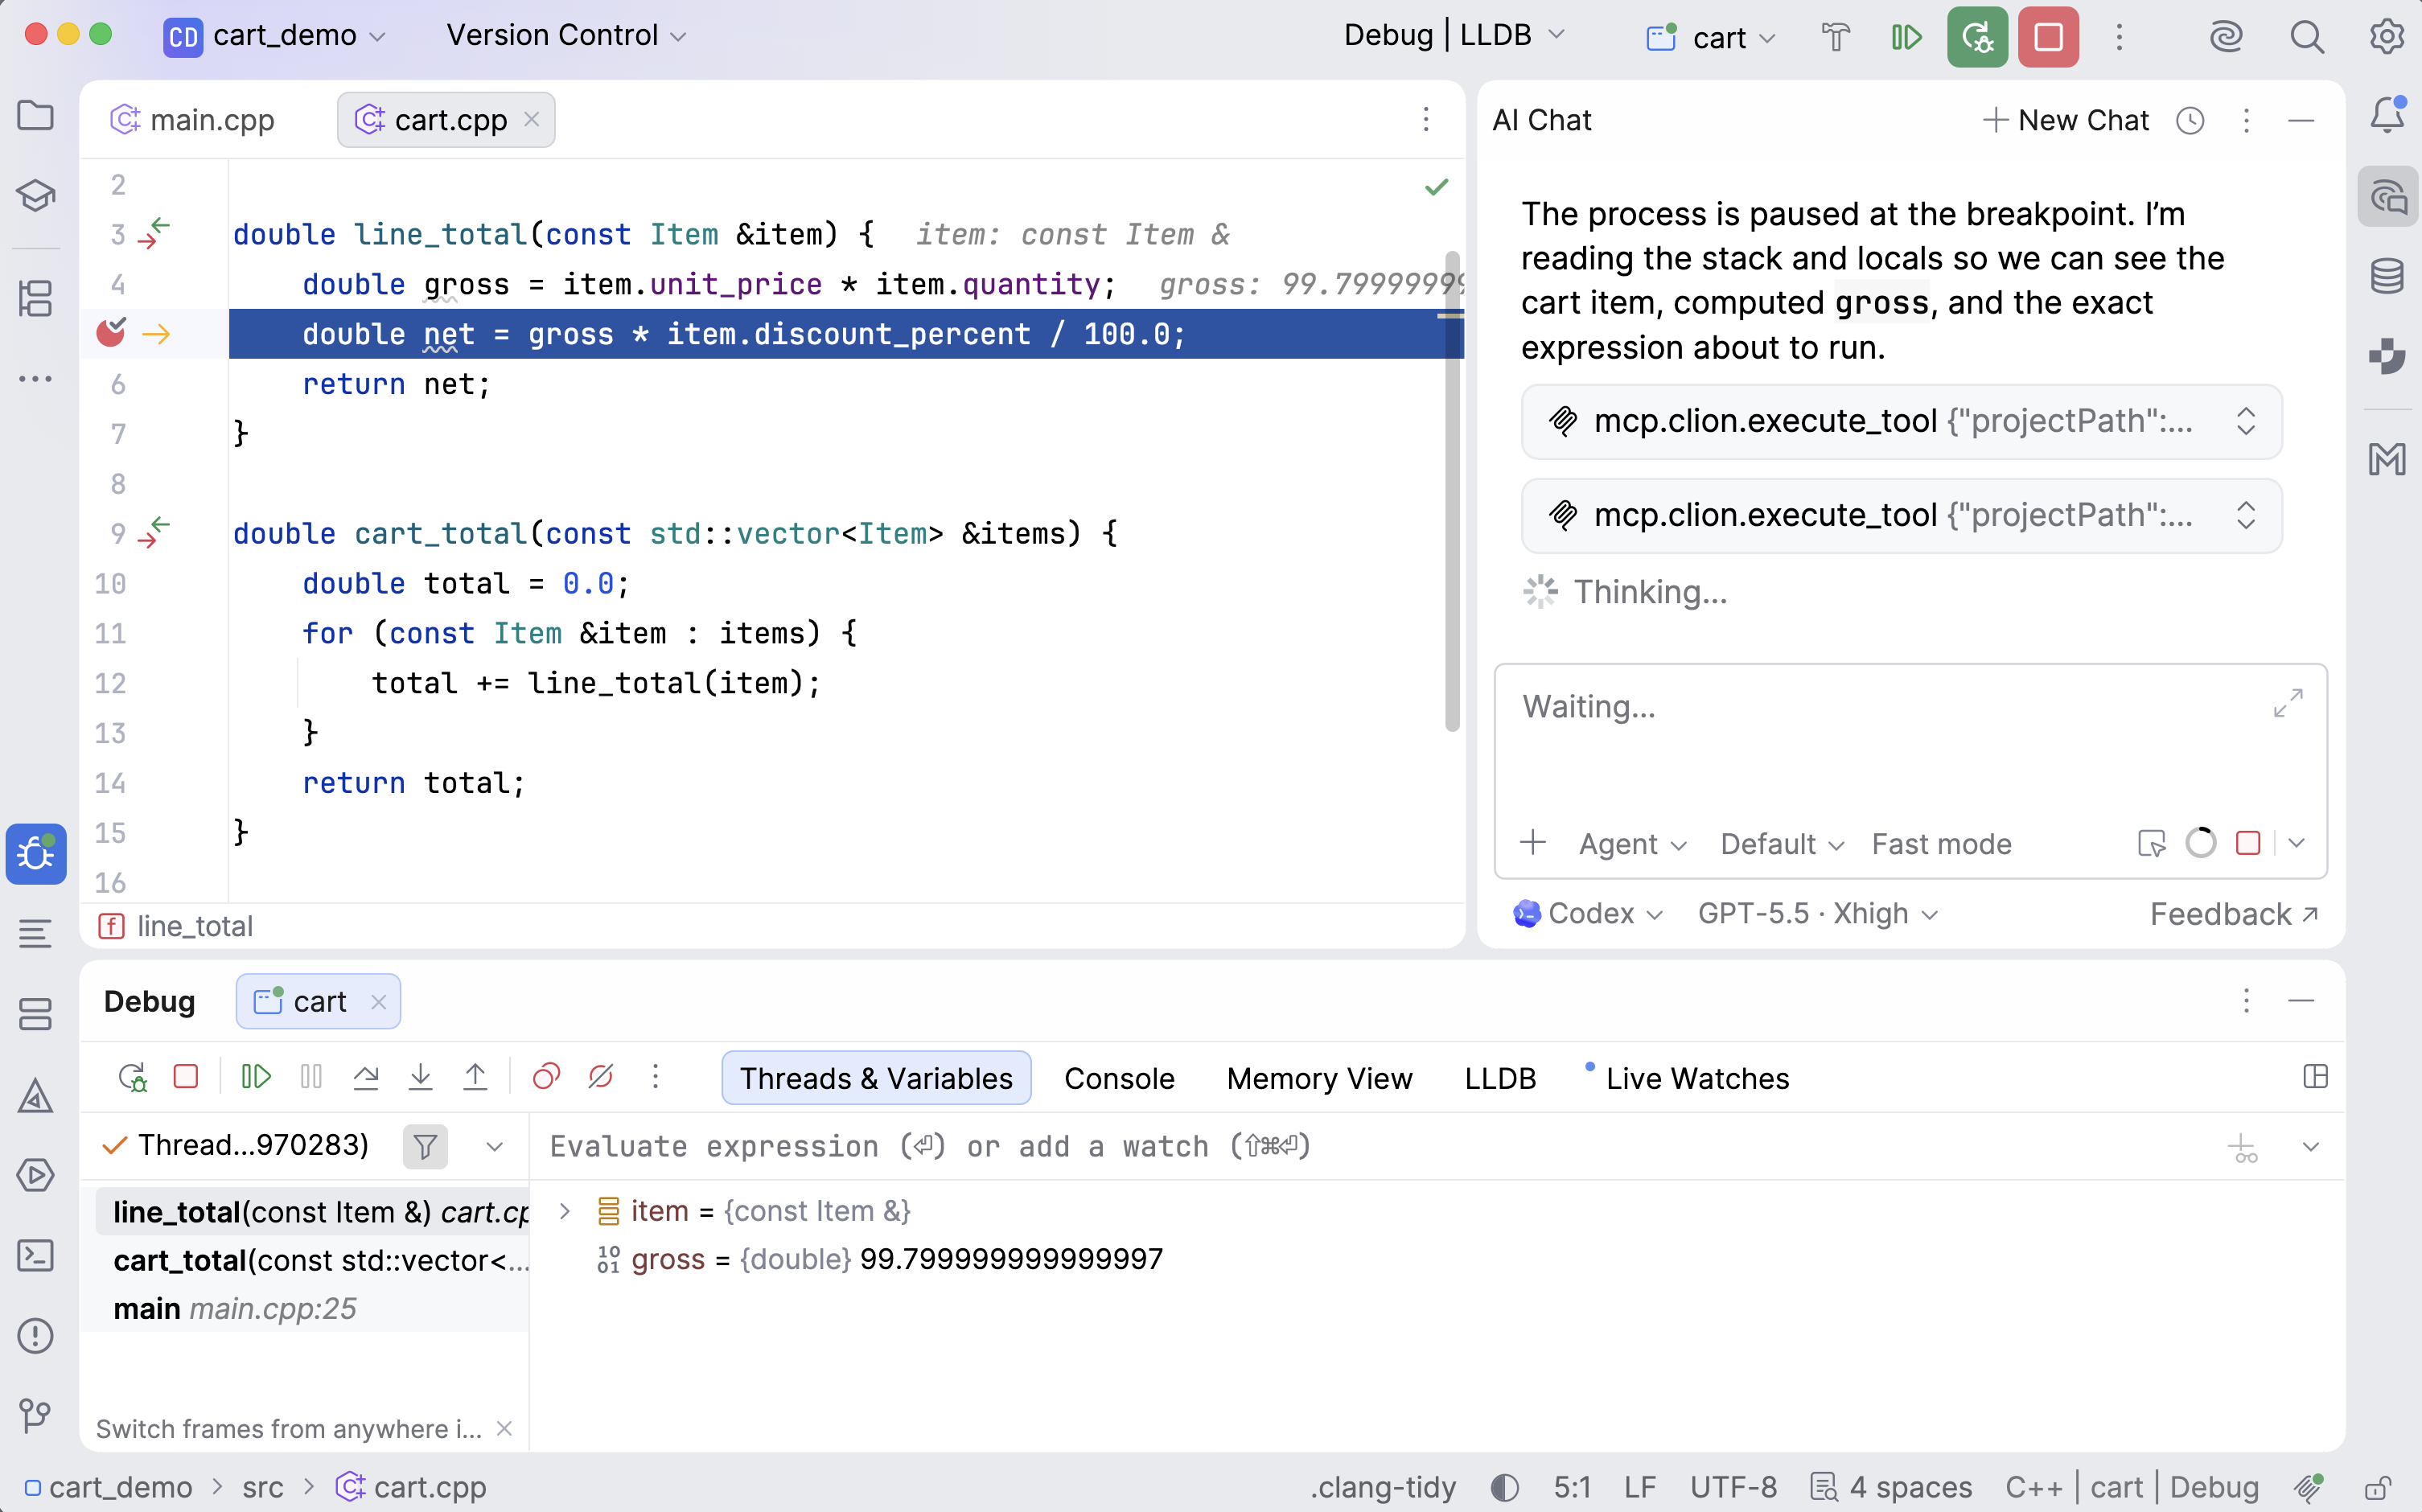
The agent controls the standard CLion debugger, so you can follow the session in the Debug tool window and take over at any point.
Debug ARM Cortex-M hard faults
A hard fault is an ARM Cortex-M CPU exception that the processor raises when an operation fails at a low level, for example, when the program accesses an invalid memory address. The fault handler captures the stacked registers and the fault status registers, but it halts execution without decoding them, so the processor reports that a fault happened and not why.
The bundled clion-embedded-hardfault skill turns that halt into an investigation. CLion decodes the fault data and hands it to the agent, which traces the faulting instruction back to your source code and reports what causes the fault.
What the agent receives
Instead of raw register dumps, CLion provides the agent with the following evidence:
The fault status registers, decoded into the fault conditions they report.
The exception frame that the hardware stacked at the moment of the fault, read before the running program overwrites it.
The peripheral registers behind the faulting memory-mapped access, decoded from the SVD description of your device.
The disassembly at the faulting address and the surrounding memory.
CLion builds this data from its own model of the memory map, the registers, and the instruction encoding, so the agent starts at the faulting address instead of reconstructing it from the program output. The data comes from the debugger, which makes the skill independent of the hardware vendor: it works with any tool you use for on-chip debugging, including ST-LINK, Segger J-Link, and Lauterbach TRACE32.
Find the cause of a hard fault
The skill works over the debugger tools, so enable the MCP server first as described in Connect an agent to the debugger. The skill itself is enabled by default in , in the Bundled skills section. To use it in a client outside the IDE, install it as described in Install the debugger skill.
Debug your target on-chip and let the program run until it stops in a fault handler.
Describe the problem to the agent in natural language, for example:
This firmware hard faults from time to time, probably on an invalid memory access. Find the cause and tell me how to fix it.The agent applies the skill on its own when the session stops in
HardFault_Handler,MemManage_Handler,BusFault_Handler, orUsageFault_Handler, or when the prompt mentions the CFSR, HFSR, MMFAR, or BFAR registers or the exception stack frame. If the agent overlooks the skill, name it in the prompt to make the task clearer:Use the clion-embedded-hardfault skill to find the cause of this fault.The agent reads the decoded fault data, inspects the memory and the disassembly, and traces the faulting instruction to the source code. It then reports where the bug is and how to repair it.
Apply the fix yourself, or ask the agent to apply it and to run the debug session again to check the result.
Limitations
Breakpoint errors and the output of logging breakpoints are reported only by JVM-based debuggers. With the C and C++ debugger, these event streams can stay empty even when a logging breakpoint is configured.
Evaluating
constexprexpressions during a debug session is not yet supported through the debugger tools.The hard fault debugging skill works with Claude Code and Codex both in the AI Chat tool window and in CLI mode. With GitHub Copilot, it works in CLI mode only.