Debugging
The debugger helps you to find errors in your code by investigating the runtime behavior of the code. With the debugger in DataGrip, you can go through the code line by line, step in and out of called routines, evaluate expressions, and watch variables as they change their values.
Debugging Oracle PL/SQL code
The debugger is based on the Oracle Probe that uses API of the DBMS_DEBUG package and should work on Oracle servers 9.0 and later.
In Oracle, you can debug the following program units (PL/SQL programs): anonymous blocks, packages, procedures, functions, and triggers.
Step 1. Create a PL/SQL object
Right-click the Oracle data source and select Open Console Ctrl+Shift+F10.
Type or paste your code in the console.
Click the Execute button
 or press Ctrl+Enter to run the procedure code.
As a result, you see a created object in the Database tool window ().

Step 2. Compile a PL/SQL object with the debug option
To enable debugging for a PL/SQL code, you need to compile it with the debug option. The process of compilation converts PL/SQL code to Pro*C, which is then compiled to Oracle shared libraries. The compilation helps the Oracle interpreter to process your code faster.
Right-click the PL/SQL object that you want to debug and select .
In the Recompile dialog, select With "debug" option.
Click OK.

Step 3. Debug PL/SQL program units
Debug PL/SQL procedures and functions through anonymous blocks
PL/SQL program units organize the code into blocks. A block without a name is an anonymous block. The anonymous block is not stored in the Oracle database. In the debugging process, you use the anonymous block to pass values for parameters.
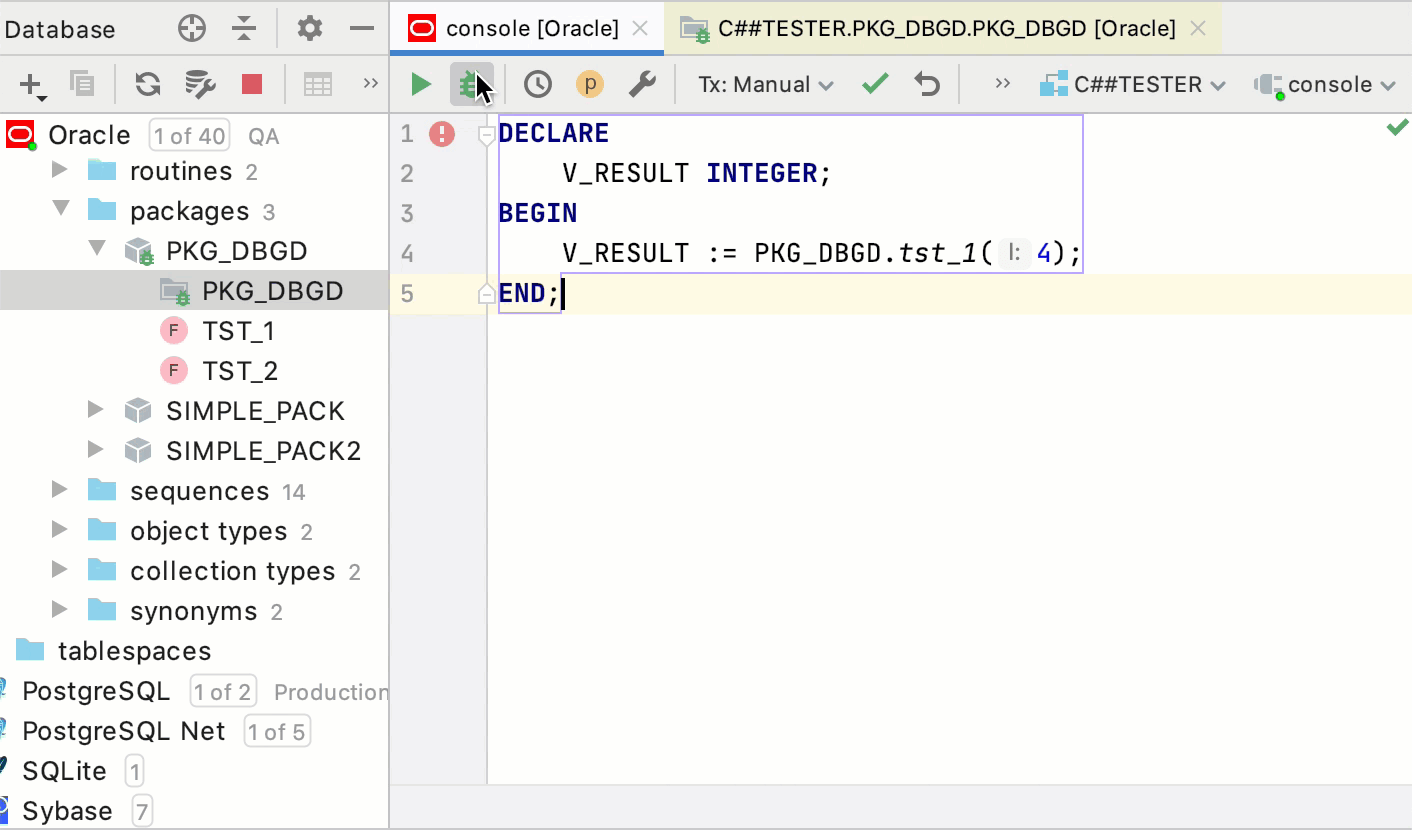
To debug procedures, packages, and functions, write an anonymous block that calls the necessary routine.
In the Database tool window (), double-click the PL/SQL object that you created and compiled for debugging.
Click the Run Procedure button
 . If the session is not selected, select a session from the drop-down list. For more information about managing sessions, see Managing connection sessions.
From the Execute Routine dialog, click the Open in console icon (
 ) to open the anonymous block in the Oracle console. Alternatively, you can copy and paste the anonymous block to the console manually.
Place breakpoints in the anonymous block and in the PL/SQL program object that is referenced in this anonymous block.
(Optional) Modify parameter values.
Click Debug.

Debug PL/SQL packages through anonymous blocks
A package is a schema object that groups logically related PL/SQL types, items, and subprograms.
Just like with procedures and functions, to debug a package, write the anonymous block that calls the necessary routine.
In the Database tool window (), double-click the package that you created and compiled for debugging.
Place breakpoints in the package.
Right-click the Oracle data source and select Open Console Ctrl+Shift+F10.
In the Oracle console, write an anonymous block that triggers the procedure.
Click Debug.
Debug PL/SQL triggers through queries
A trigger is a PL/SQL program unit that is automatically called by the DBMS when you issue INSERT, UPDATE or DELETE queries. Triggers are associated with a table and are called before or after you insert, update, or delete a data row. A table can have several triggers.
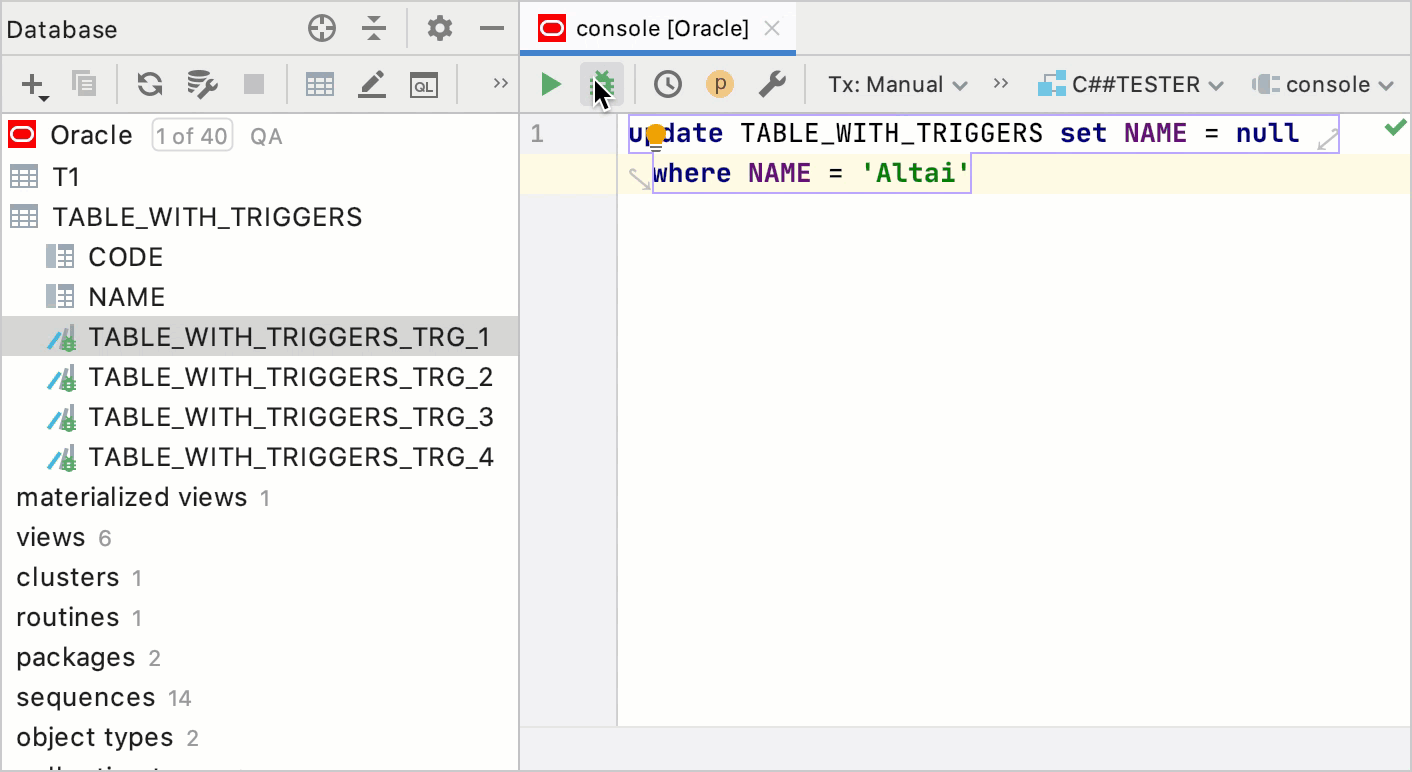
To debug a trigger, write an INSERT, UPDATE or DELETE query to a table or a view.
Right-click the Oracle data source and select Open Console Ctrl+Shift+F10.
Type a query in the console.
Place breakpoints in a trigger.
Click Debug.
Configuring debugger settings
In the Settings/Preferences dialog Ctrl+Alt+S, navigate to Build, Execution and Deployment | Debugger.
Useful debugger shortcuts
| Action | Hotkey |
|---|---|
| Toggle breakpoint | Ctrl+F8 |
| Resume program | F9 |
| Step over | F8 |
| Step into | F7 |
| Stop | Ctrl+F2 |
| View breakpoint details/all breakpoints | Ctrl+Shift+F8 |
| Debug code at caret | Shift+F9 |