Explore data in data editor
In DataGrip, you can explore the data contained in the databases you connect to. There can be cases when you need to explore that data without writing queries. The IDE's data editor has various features that help you with it.
In this tutorial, you will learn how to sort and filter column data locally and on the server side, how to reorder columns, work with selection, and so on. Additionally, the tutorial describes how to navigate between database table data by using foreign keys, visualize data with charts, and also explore single cell values.
Filter data
In data editor, you can search through your data by filtering it one of the available ways. Your data can be filtered both on the client side and on the server side.
For more information about filtering data, refer to the Filter data topic.
Client side
On the client side, you can filter your table data using text search and local filter. No additional queries are sent to the server.
Text search
To use text search, in the data editor tab, press Ctrl+F and start typing the value. DataGrip will highlight all occurrences. To filter your table by the value, select the Filter rows checkbox in the text search tab.
Local filter
To use local filter, click the local filter icon
 in the column header and select the values you want to filter.
Server side
To filter on the server side, you can either apply quick filters from a context menu of a cell or type a WHERE clause in a dedicated field under the toolbar.
Context menu of a cell
To use quick filters in a cell's context menu, right-click a cell and navigate to Filter by. In the submenu, select the filter you want to apply. DataGrip will send a new
SELECTstatement with the filter you selected and then display the result in the grid. You can find the query log in the Services tool window.WHEREclauseTo filter your table data using a
WHEREclause, type it in the WHERE field under the toolbar and press Enter. DataGrip will send a newSELECTstatement with yourWHEREclause and display the result in the grid.For example, to filter all the values of
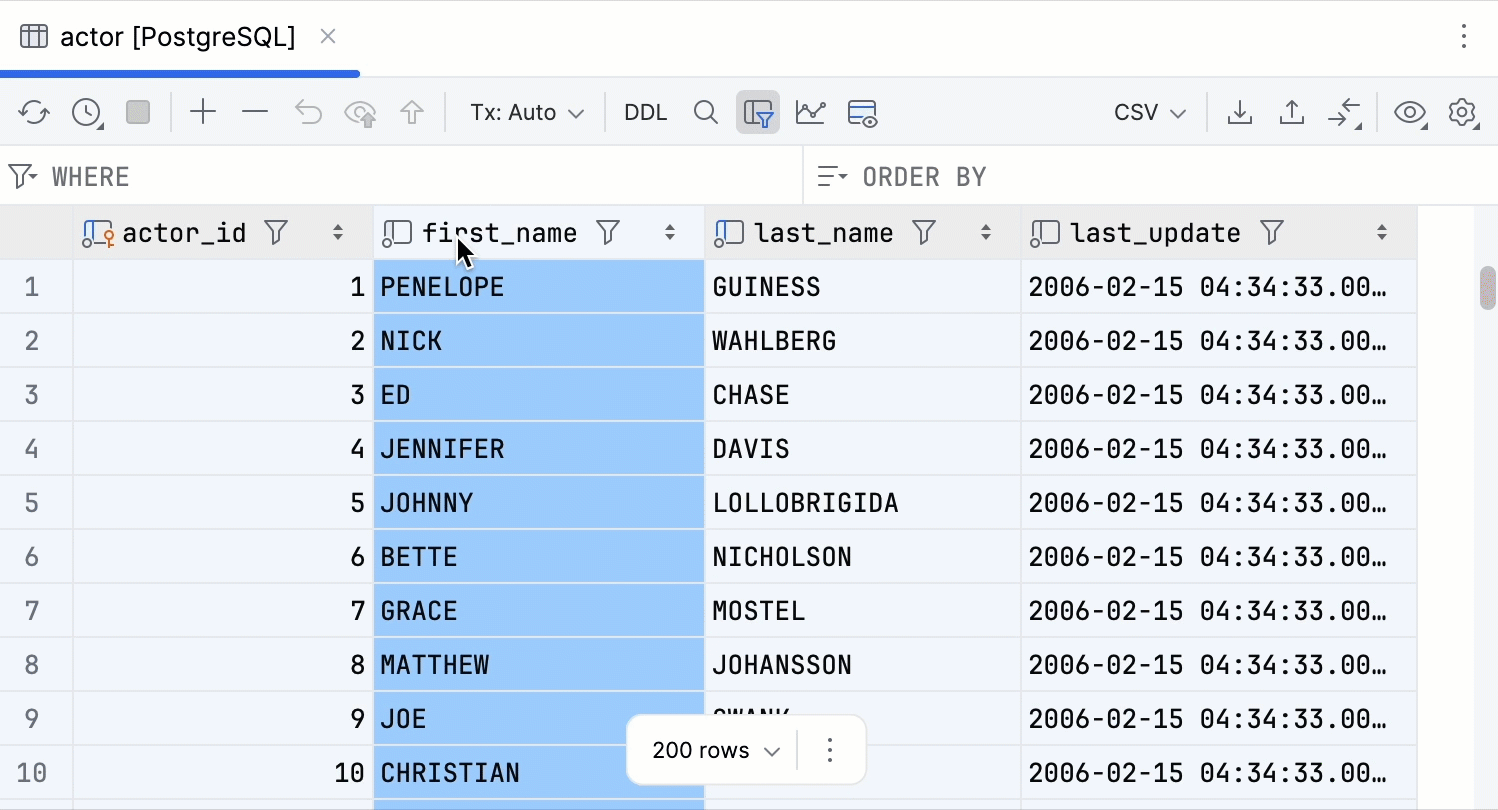
first_namecolumn that begin withJO, enterfirst_name LIKE 'JO%'and press Enter.
Sort data
In DataGrip, you can sort your table data by either clicking the column header or by writing a SORT BY clause in a dedicated field under the toolbar.
For more information about sorting data, refer to the Sort data topic.
Column header
To sort column data, click the arrow icons in the column header.
Depending on your preferences and setup, sorting can be done on the client side or on the sever side. To switch between the two modes, click
 Show Options Menu in the upper-right corner of data editor and toggle the Sort via ORDER BY option.
Consider the following video. First, DataGrip performs server side sorting by sending queries and displaying the query result in the grid. Once the Sort via ORDER BY option is disabled, sorting is done on the client side.
ORDER BYclauseTo sort your data using a
ORDER BYclause, type it in the ORDER BY field under the toolbar and press Enter. DataGrip will send a newSELECTstatement with your query and display the result in the grid.
Compare data
Data editor lets you compare data from two different grids. They can be two database objects of the same type or of different types. The IDE shows the grids in a Diff Viewer highlighting the differences.
For more information about comparing grid data, refer to the Compare data topic.
To compare the data of two database objects, do the following:
Double-click the database objects in Database Explorer to open them in data editor.
Select either one of them to view.
On the toolbar, click
 Compare Data and select the other database object's grid from the Data Grid dropdown.
DataGrip will open a Diff Viewer with the contents of both grids.
When comparing, you can set a maximum number of differences that are allowed between two result sets.
Visualize data with charts
DataGrip lets you visualize your data using charts. You can build plots, change their type, set different column values as X and Y axes, and so on.
For more information about charts, refer to the Visualize data chapter.
For example, you need to plot two charts: one for the name column values and the other for the geo column values of the charts_demo database table. To do this, follow these steps:
Click
 Show Chart on the toolbar.
In the chart area that opens, DataGrip displays the chart in a default Bar type. You can explore the values by hovering over them in the chart.
To change the chart type, click
 Show Series Settings on the right-side toolbar.
At the top of the Series Settings settings area that opens, select the preferred chart type by clicking its icon. In this tutorial, it is
 Line.
Line.The chart will change its type.
To add one more chart, click Add new series at the bottom of the chart area.
DataGrip will open settings for a new chart.
For the second chart, select the
geocolumn as the X axis and thepointscolumn as the Y axis. Select Scatter as the chart type.
To export the chart as a PNG file, click
 Export as PNG on the right toolbar, navigate to the preferred location, and click OK.
Explore single cell values
Values in Value editor
DataGrip lets you view and edit cell values in a dedicated Value editor. To open Value editor, right-click a cell and click Open in Value Editor. The editor opens on the right side of the main window.
For more information about Value editor, refer to the Data editor and viewer topic.

Aggregated values
In DataGrip, you can view aggregate values of multiple cells. To do this, select the cells, right-click the selection, and select Show Aggregate View.

The IDE opens the list of aggregated values on the right side of the main window. For DataGrip to display aggregated values for a different set of cells, select and deselect the cells.
You can use the built-in aggregator scripts and also create your own. Once you create a new one and store it in a dedicated directory, DataGrip adds your custom script to the list and displays the value among other ones.
For more information about data aggregator scripts and how to add a custom one, refer to the View data topic.
View single record information
To view the data of a single record, use the data editor's single record view. You can open it by right-clicking any cell and selecting ![]() Show Record View. The view opens in a dedicated pane on the right side of the main window.
Show Record View. The view opens in a dedicated pane on the right side of the main window.
For more information about single record view, refer to the View data topic.

Navigation by foreign keys
In data editor, all values with foreign keys are links. You can navigate to the related data of a selected cell by either clicking a quick actions toolbar button or using the cell's context menu.
Quick action
Select a cell and click
 Related Rows on the quick actions toolbar that appears.
Context menu of a cell
Right-click a row or cell in a table and select .
For more information about navigating between rows, refer to the Rows topic.
Extend selection
When editing data, you can select a whole column or row to copy it by extending a selection. You can also shrink the selection back. To do this, use the Extend Selection Ctrl+W and Shrink Selection Ctrl+Shift+W actions.
Select a cell.
To extend selection, press Ctrl+W:
To select the column that contains the cell, press once.
To select the row that contains the cell, press twice.
To select the whole grid, press three times.
To shrink selection, press Ctrl+Shift+W.
Additionally, you can select a whole column by clicking its header.
Transpose grid
Data editor can rotate the table data from rows to columns and from columns to rows. In the transposed view, the rows and columns are interchanged. To transpose your grid, click ![]() View as and select Transpose.
View as and select Transpose.
For more information about viewing options, refer to the View data topic.