The IDE does not respond
When DataGrip does not respond, consider creating a thread dump file. A dump file must be created at the moment when the IDE does not respond and include the thread stack. Recording several thread dumps with 1-2 seconds interval might be useful for the problem analysis.
After you have created a dump thread file, archive it, and upload it to share with the JetBrains support team. Read upload instructions in the Upload snapshots section.
You can create thread dumps by using the following options:
Using jstack
The jstack command-line utility prints Java stack traces of Java threads. The utility is provided with the JDK installation and can be found in the JAVA_HOME\bin directory.
Ensure that the utility has the same JDK version as DataGrip. For example, the 64-bit JDK distribution of the utility will not work for the IDE that runs under the 32-bit JDK distribution. To check the JDK version, press Ctrl+Shift+A, type About, and press Enter.

Create thread dumps by using jstack
Open the command prompt.
List Java processes that run on your system with their command-line options. Type the following command and press Enter.
jps -mvRun jstack with the IDE process identifier (PID). Type the following command and press Enter.
jstack -l <PID> > dump.txtThis command prints the thread dump into a file.

Automatic thread dumps
DataGrip runs a thread that detects when UI does not respond for a certain time and writes automatic thread dumps into the log directory. To find the log directory, click . You will find several folders with the name like threadDumps-freeze-20201215-083634-DB-211.3076. Zip these folders and attach them to your ticket.
Thread dump from the console
Depending on your operating system, you can create a thread dump without the jstack utility.
macOS
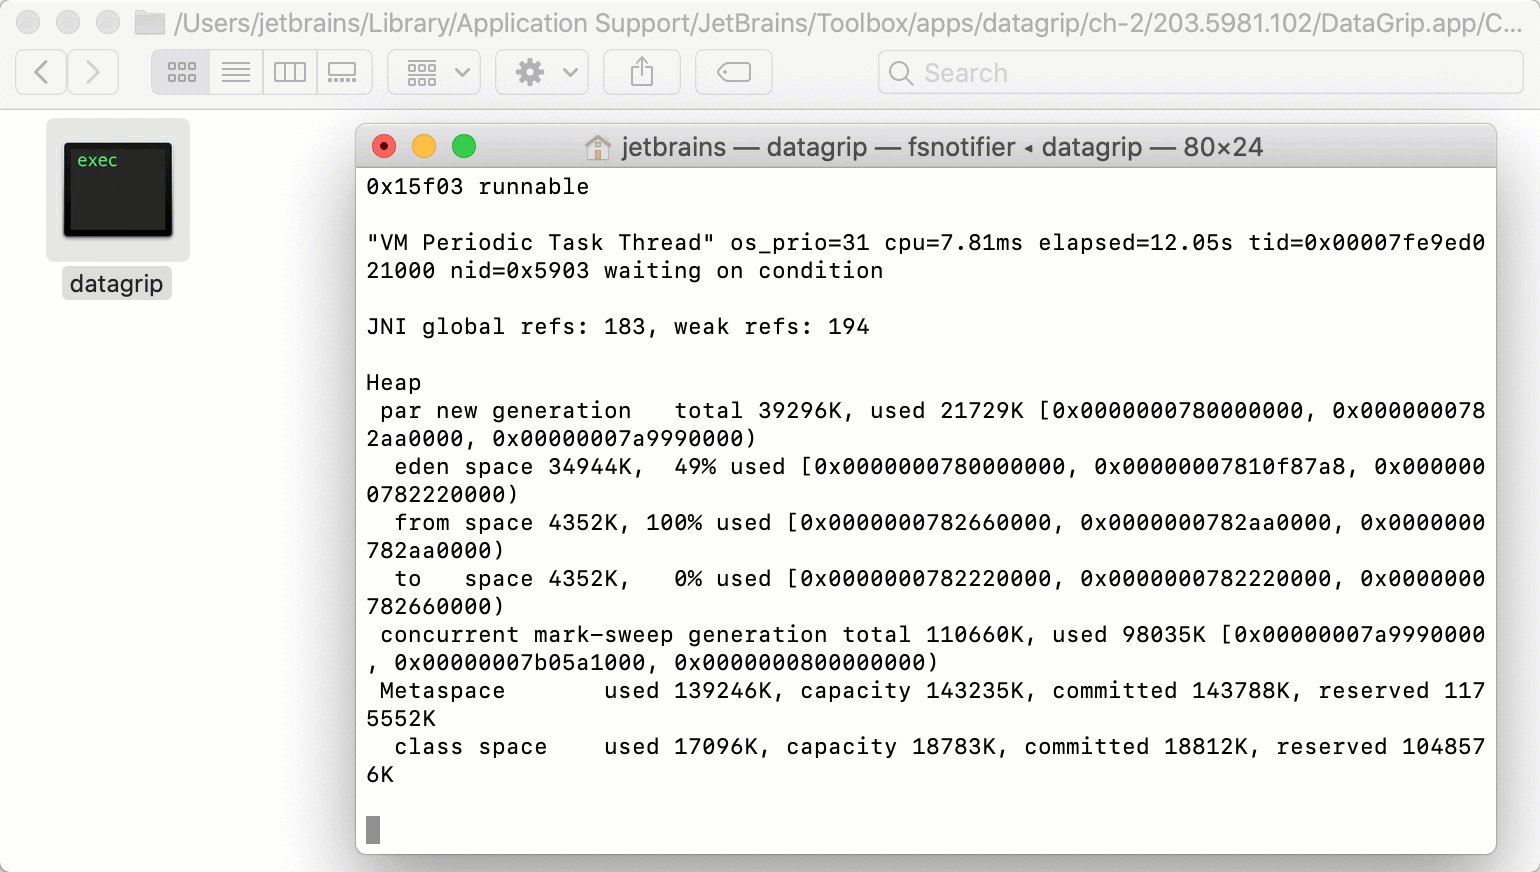
Navigate to the datagrip file in IDE_HOME/DataGrip.app/Contents/MacOS/.
Depending on how you installed your IDE, IDE_HOME might differ. For a standalone installation, IDE_HOME is as follows: /Applications/. For an installation via JetBrains Toolbox App, use the following steps to find IDE_HOME through the application:
Open the Toolbox App, click the vertical ellipsis icon (
 ) for the relevant IDE instance and select Settings.
On the Settings tab, navigate to and click Show.
In the opened file browser window, right-click DataGrip.app to access the context menu and select Show Package Contents.
Right-click the datagrip file and select .
Press ⌃ \. The terminal will print a thread dump. To complete the process, press ⌃ C.
Microsoft Windows
Open the command prompt.
By using the
cdcommand, navigate to the datagrip.bat file in the bin directory inside your IDE installation directory.Depending on how you installed your IDE, the installation directory might differ. For a standalone installation, the installation directory is as follows: C:\Program Files\JetBrains\DataGrip <version_number>\. For an installation via JetBrains Toolbox App, use the following steps to find the installation directory through the application:
Open the Toolbox App, click the vertical ellipsis icon (
) for the relevant IDE instance and select Settings.On the Settings tab, navigate to and click Show.
In the opened file browser window, right-click DataGrip.app to access the context menu and select Show Package Contents.
Run the datagrip.bat file.
datagrip.bat > output.txtPress Ctrl+Break. The terminal will print a thread dump. To complete the process, press Ctrl+C.
Unix
Run the datagrip.sh file in the bin directory inside your IDE installation directory.
Depending on how you installed your IDE, the installation directory might differ. For a standalone installation, the installation directory might be any directory that you have chosen. For an installation via JetBrains Toolbox App, use the following steps to find the installation directory through the application:
Open the Toolbox App, click the vertical ellipsis icon (
) for the relevant IDE instance and select Settings.On the Settings tab, navigate to and click Show.
In the opened file browser window, right-click DataGrip.app to access the context menu and select Show Package Contents.
By using a process manager (for example,
ps,htop,jps), get the process ID (PID).Run the following command or send the SIGQUIT signal to the process. A thread dump will be printed in the terminal window.
