Run and debug Jupyter notebook code cells
You can execute the code of the notebook cells in many ways using the icons on the notebook toolbar and cell toolbars, commands of the code cell context menu (right-click the code cell to open it), and the Run commands of the main menu. Note that when you work with local notebooks, you don’t need to launch any Jupyter server in advance: just execute any cell and the server will be launched.

Run code cells
Use the following smart shortcuts to quickly run the code cells:
Ctrl+Enter: Runs the current cell.
Shift+Enter: Runs the current cell and select the cell below it.
When executing one cell at a time, mind code dependencies. For example, the second cell in the code fragment uses the variables defined in the first cell. So, if you modify the
Nvalue, the changes will be reflected in the scatter chart only after the first cell gets executed.In case of any errors, expand the Traceback node to preview the complete error message.

To execute all code cells in your notebook, click
 on the notebook toolbar or press Ctrl + Shift + Alt + Enter.
When you stop the server and change the server or kernel, you have to execute all cells with dependencies again, because execution results are valid for the current server session only.
View variables
When you execute a cell, the Variables tab of the Jupyter server tool window opens automatically.

You can click the link to the right of the variable to preview its values in the tabular form:

Note that Variables tab will appear each time you execute a cell, so if, by some reasons, you need to close it permanently, deselect the corresponding option in the project settings ( ).
In addition to previewing values of the variables in the Variables tab, you can watch the values of the variable usages in the editor. Note that variable assignments are not shown.
To enable this option, select Show inline values in the editor in project .

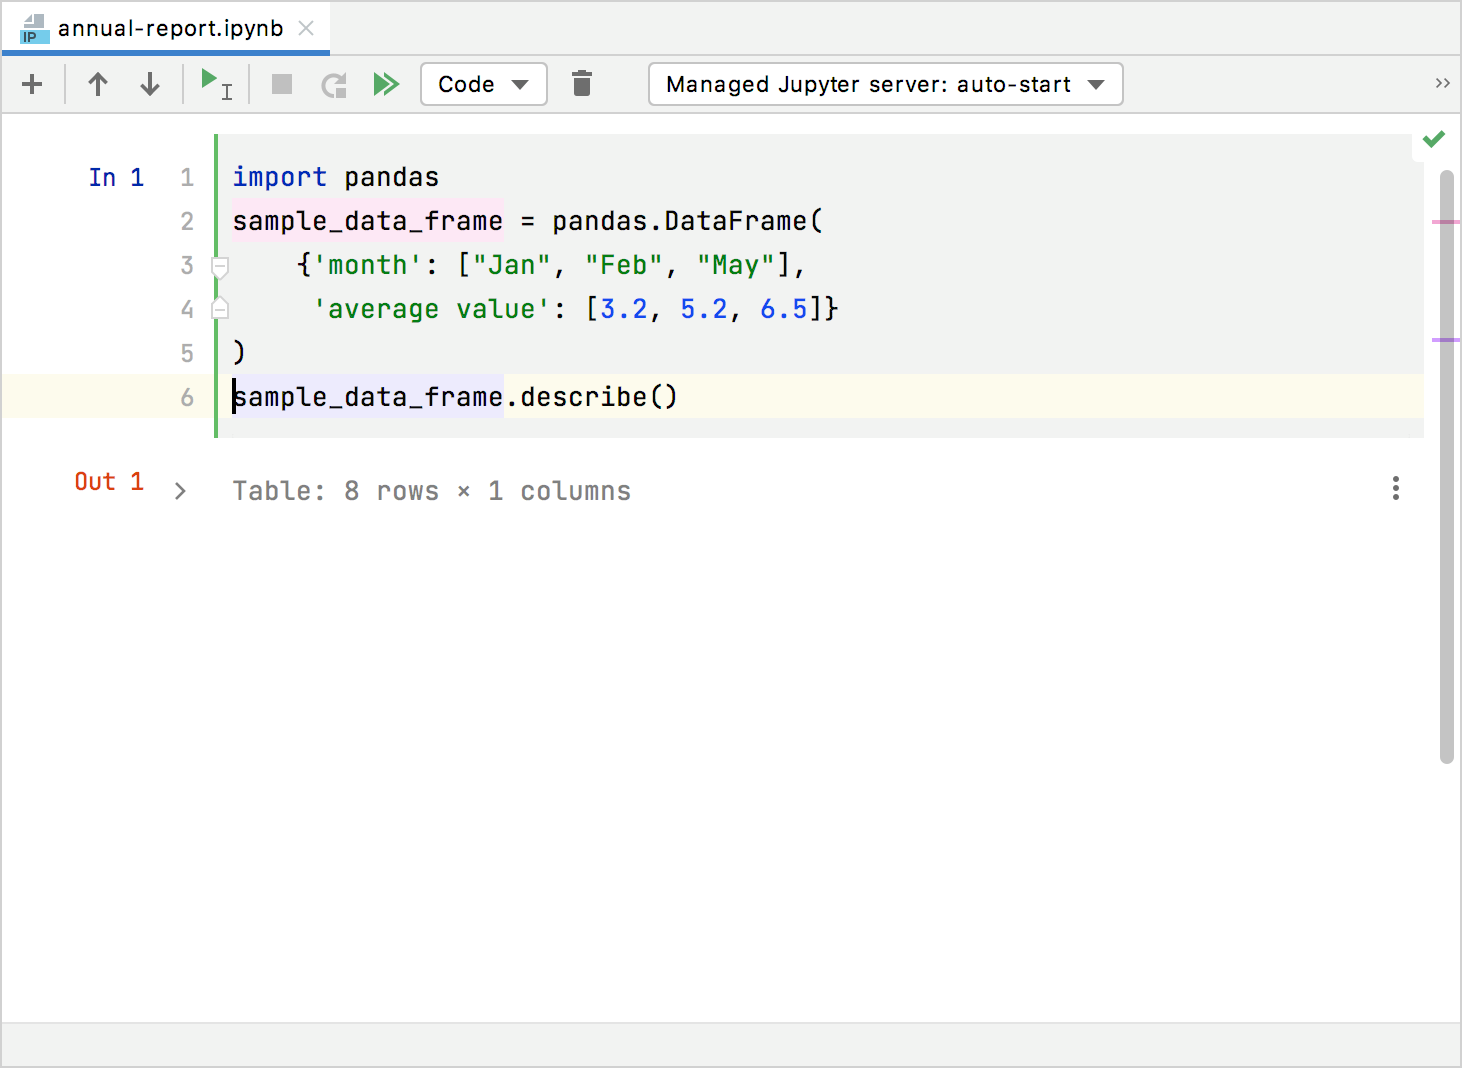
Once you’ve executed the cell, its output is shown below the code. You can save the results or clear the output.
Process output
If your notebook cell involves any code that plots charts, you can invert the plotted image for better readability. Select the Invert images in dark themes checkbox on the Jupyter page in the project Settings/Preferences (Ctrl+Alt+S) and restart the editor to apply the changes.
When any data frames are built, you can preview them in the tabular form. To open a data frame in an editor tab, right-click the cell output and select menu item. Alternatively, click the View as DataFrame link in the Variable view.

You can copy the selected fragment or all cells of the table. To save the output in the *.csv format, select the menu item form the context menu and specify a filename. By default, the table is saved in output.csv.
You can sort data in a column by clicking its header. You can also copy a column header or all headers of the table to the clipboard. Just right-click any table header to get the context menu and select the target command.

Similarly, you can preview a numpy array in a separate tab when clicking the View as array link in the Variables view.

Click an arrow nearby a cell counter to expand and collapse the cell output.
JetBrains DataSpell provides the full-functional Jupyter Notebook Debugger.
Debug code in Jupyter notebook
Set the breakpoints in the selected cell and press Alt + Shift + Enter for Windows or ⌥⇧↩ for macOS. Alternatively, you can click the
 icon, and select Debug Cell.
The Jupyter Notebook Debugger tool window opens.

Use the stepping toolbar to choose on which line you want to stop next and switch to the Debugger tab to preview the variable values:

Debugging is performed within a single code cell. However, if your code cell calls a function from any cell that has been already debugged, you can step into it. The related breakpoints will also work. Note that the cell with the function must be debugged not just executed.
Similarly, you can step into a function called from a Python file that is located in the same project.
Proceed with the debugging steps to complete the execution of the cell.

With JetBrains DataSpell you can always quickly preview reference documentation for a particular variable, type, or argument.
Preview reference documentation
To view reference information for any element of a particular code cell, place the caret within the target code cell and type
? <type/variable/argument>. (in this example, you will preview documentation forplt.scatter). Note that a code element should be accessible within the code cell.Execute the cell. The Introspection tab opens in the Jupyter tool window.

Preview reference documentation in the Introspection tab.
Note that the Introspection tab shows documentation for the latest requested code element. Even though you proceed with executing other code cells, restart the server, or delete the line with your request, this information will be shown.
Stepping toolbar
| Item | Tooltip and Shortcut | Description |
|---|---|---|
| Show Execution Point Alt+F10 | Click this button to highlight the current execution point in the editor and show the corresponding stack frame in the Frames pane. | |
| Step Over F8 | Click this button to execute the program until the next line in the current method or file, skipping the methods referenced at the current execution point (if any). If the current line is the last one in the method, execution steps to the line executed right after this method. | |
| Step Into F7 | Click this button to have the debugger step into the method called at the current execution point. | |
| Force Step Into Alt+Shift+F7 | Click this button to have the debugger step into the method called in the current execution point even if this method is to be skipped. | |
| Step Into My Code Alt+Shift+F7 | Click this button to skip stepping into library sources and keep focused on your own code. | |
| Step Out Shift+F8 | Click this button to have the debugger step out of the current method, to the line executed right after it. | |
| Run to Cursor Alt+F9 | Click this button to resume program execution and pause until the execution point reaches the line at the current cursor location in the editor. No breakpoint is required. Actually, there is a temporary breakpoint set for the current line at the caret, which is removed once program execution is paused. Thus, if the caret is positioned at the line which has already been executed, the program will be just resumed for further execution, because there is no way to roll back to previous breakpoints. This action is especially useful when you have stepped deep into the methods sequence and need to step out of several methods at once. If there are breakpoints set for the lines that should be executed before bringing you to the specified line, the debugger will pause at the first encountered breakpoint. | |
| Evaluate Expression Alt+F8 | Click this button to evaluate expressions. |