Explore and navigate exception stack traces
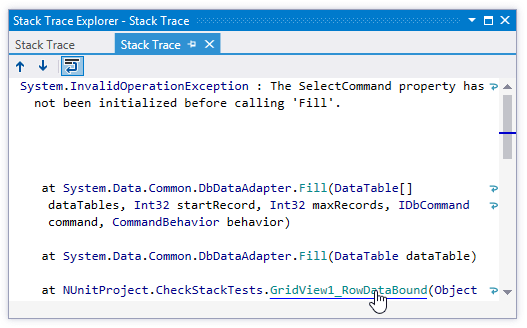
When you receive an external stack trace (for example, from a bug report), you can open it in the dedicated Stack Trace Explorer window and then navigate to code where the corresponding exception originated. In this window, you can click files, types, and methods to display them in the editor.
Navigate to code that caused an exception
Copy exception stack trace to the clipboard.
Press Control+Shift+E or choose from the main menu.
The Stack Trace Explorer window opens displaying the exception stack trace from the clipboard in a new tab.
Study the stack trace and click highlighted items to open the corresponding code in the code viewer.
If you prefer to wrap long lines in the stack trace, use the corresponding toolbar button
.png)

Stack Trace Explorer window toolbar controls
Control | Name | Description |
|---|---|---|
| Previous/Next | Navigate to the previous/next item and scrolls through the source code accordingly. |
| Toggle wrapping of words | Allows you to enable or disable wrapping of long lines in the sack trace. |
Window tabs
When stack traces open in the window, they are displayed in new tabs, which show up on the left. The previously open tabs move to the right if the width of the window allows, otherwise they unload themselves saving memory - but you can always restore them by clicking the arrow that appears to the right of the tabs and clicking the required tab:

To prevent a tab from unloading, click the pin icon ![]() next to the tab title.
next to the tab title.
This feature is inspired by and borrowed from JetBrains ReSharper, a developer productivity tool for Microsoft Visual Studio.