Navigate from Stack Trace to Exception
Control+Shift+E
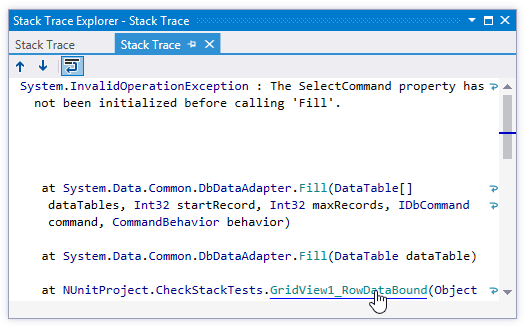
When you receive an external stack trace (for example, from a bug report), you can open it in the dedicated Stack Trace Explorer window and then navigate to code where the corresponding exception originated. In this window, you can click files, types, and methods to display them in the editor.
Navigate to code that caused an exception
Copy exception stack trace to the clipboard.
In the main menu, choose , or press Control+Shift+E.
The Stack Trace Explorer window opens displaying the exception stack trace from the clipboard in a new tab.
Study the stack trace and click highlighted items to display the corresponding code in the editor.If you prefer to wrap long lines in the stack trace, use the corresponding toolbar button


This feature is inspired by and borrowed from JetBrains ReSharper, a developer productivity tool for Microsoft Visual Studio.