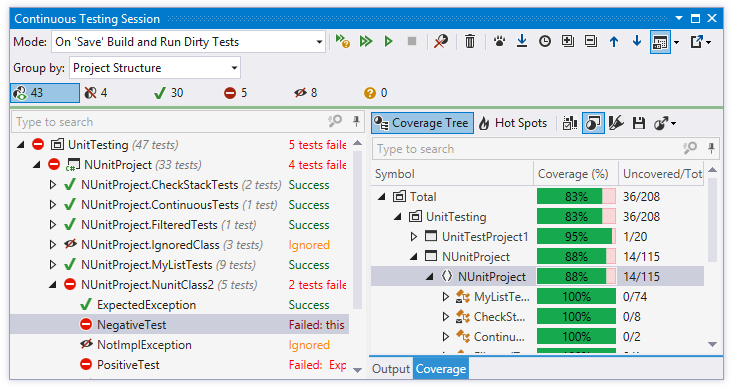
Continuous Testing Session window
This window lets you control continuous testing.

Status Bar and Progress Bar
The progress bar and the status bar under the toolbar display the current progress. On the status bar, you can see the total number of tests in the session as well as number of tests in different states. By default, tests in all states are shown, but you can change it by clicking on the corresponding icons. You can also Ctrl-click several icons to display tests in several different states.
| Control | Name | Description |
|---|---|---|
|
| Show In Scope / Out of Scope Tests |
These two icons work together as a switch to display either tests that are in or out of scope of continuous testing. You can use other status bar icons to apply additional filtering. To clear filtering and display all in scope / out of scope tests, deselect all other icons. |
|
| Show Only Passed Tests | Only show successful tests and hide all other tests. |
|
| Show Only Failed Tests | Only show failed tests and hide all other tests. |
|
| Show Only Ignored Tests | Only show ignored tests and hide all other tests. A test is ignored if it has the corresponding attribute, or if the whole category where it belongs is ignored. |
|
| Show Only Unknown Tests | Only show dirty tests. |
Toolbar Controls
| Control | Name | Description |
|---|---|---|
| Mode |
This selector lets you choose continuous testing mode. | |
|
| Run Dirty Tests |
Runs dirty tests. |
|
| Run All Shown Tests |
Runs all tests that are currently displayed in the window. |
|
| Run Unit Tests Ctrl+T,R | Runs selected tests. To select multiple texts, use the Ctrl key. |
|
| Stop Execution | Stops the current test session. |
|
| Exclude from /Include to Scope |
These buttons allow excluding selected items from
scope of continuous testing
(when in-scope tests
|
|
| Drop Results | Removes test execution results, i.e. makes all tests dirty. |
|
| Track Running Test | If this button is on, the selection in the list of tests is switched automatically to the test that is currently executing. |
|
| Auto Scroll Output When Running Test | This button enables the output pane to scroll when the test is running so that the end of the output is always visible. |
|
| Show Time | Allows you to show or hide execution time for each item in the test session. |
|
| Expand All/ Collapse All | Expands/collapses all nodes in the current tab. |
|
| Previous/ Next Shift+F8/F8 | Navigate to the previous/next item and scrolls through the source code accordingly. |
|
| Show Output Ctrl+P |
This selector allows you to open the Output and the Coverage panes and place them to the bottom or to the right of the window. The Output pane lets you analyze test results and navigate from a failed test's output to the code lines that originated the assertion or exception, all with a single click.
The
Coverage
pane displays the code coverage tree or the
hot spots view
and provides the same controls and functions as
Coverage Results Browser Window, plus the
Show coverage for selected tests
|
|
| Export | Click this button to export the data currently displayed in the window in text format, or use the drop-down selector to export the data in XML or HTML format. The Export Data dialog box that appears, will help you to save the data to a file or copy it to the clipboard. |
|
| Show Stack Trace in a new Window Ctrl+Shift+Alt+E | Opens the output of the currently selected test in a new tab of the Stack Trace Explorer Window. |