Debugging Covering Tests
Once you have coverage data, you can use dotCover to quickly analyze the cause of failed tests:
Examining stack trace
To see the stack trace of a failed test
- Open the snapshot that you want to analyze in the Coverage Results Browser window or in the Coverage area of the Unit Test Sessions window/ Continuous Testing Session window .
- Select the desired test.
- Select the Output tab on the right part of the window.
Note that there is a faster way of doing this operation if you use code coverage highlighting.
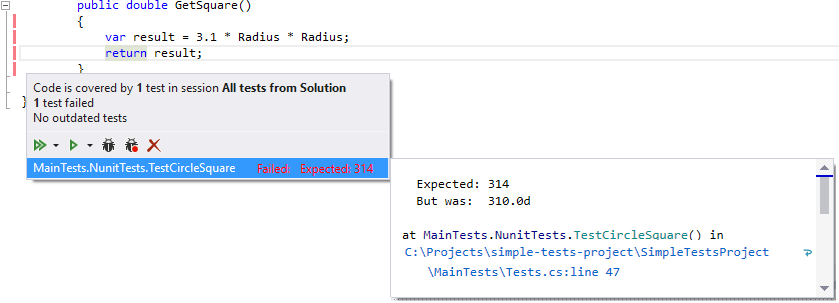
To see the stack trace of a failed test (if highlighting is enabled)
- In Visual Studio editor, find the line of code that leads to a failed test.
- Click on the highlighting marker in the left gutter.
- In the list, select the desired test.
- Click the arrow that stands after the test name.

Debugging tests
If the code coverage highlighting is enabled, you can quickly set a breakpoint on a particular line and run debugging.
To set a breakpoint and run debugging
- In Visual Studio editor, find the line of code that leads to a failed test.
- Click on the highlighting marker in the left gutter.
- In the list, select the desired test.
- Click the
 button.
Last modified: 24 August 2017