Introduction
JetBrains dotCover is a .NET unit test runner and code coverage tool. dotCover lets us analyze how much of our .NET application code is actually being tested. By measuring method calls during unit tests or when running the application manually, dotCover shows us which statements were covered and which were not.
To quickly get started with dotCover, please refer to How to Get Started.
What is code coverage?
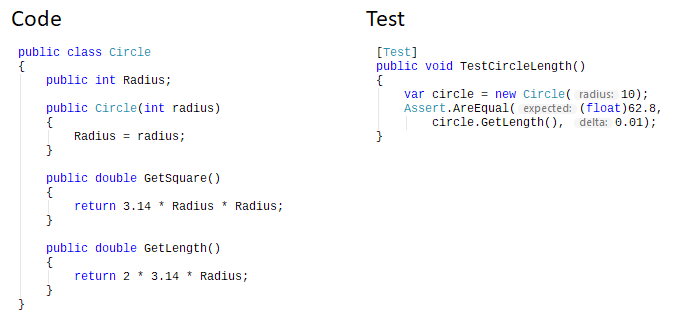
In unit testing, code coverage is a measure that describes how many lines of your code are executed while automated tests are running. Consider the example below: 
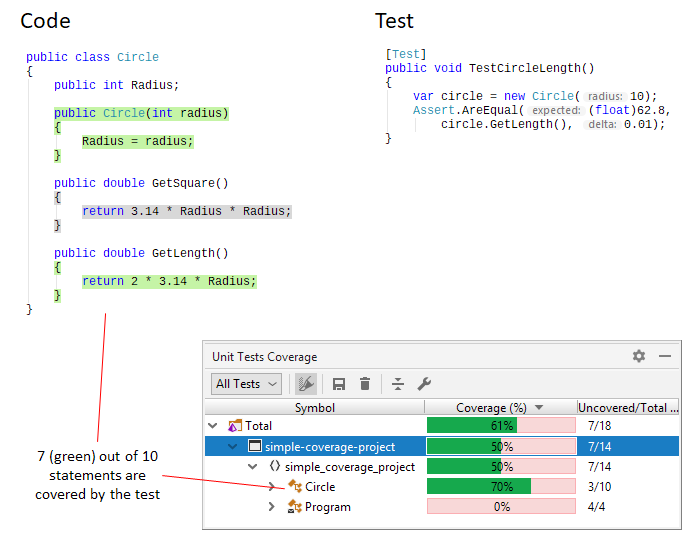
After you run the TestCircleLength() test with enabled coverage analysis, dotCover will show you how much of the source code the test covers: 
Is it only for unit tests?
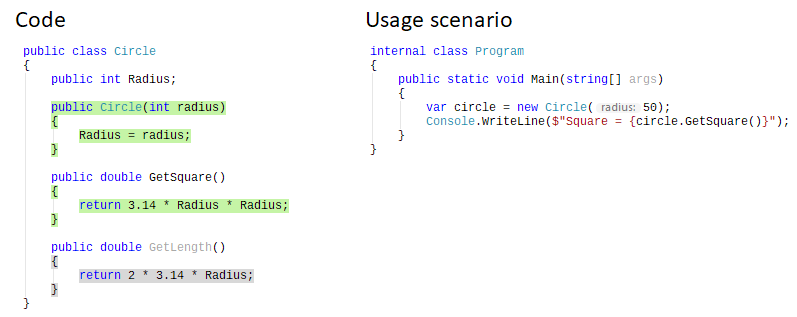
No, along with unit tests, there is a so-called 'application coverage analysis'. During this analysis, you run your application under the dotCover control and go through particular usage scenarios. The main purpose here is to understand what parts of the code are called during a particular scenario and what parts are not reached. 
How can you run dotCover?
The way you run dotCover may vary depending on your needs:
If you are a developer, who needs to analyze unit tests coverage from time to time, the best way is to use dotCover integrated in Microsoft Visual Studio or JetBrains Rider. Note that if you employ TDD (test-driven development) or just want to get coverage metric almost instantly right after you change the code, consider using continuous testing.
If you want to perform application coverage analysis on your local machine, consider running dotCover as a standalone application.
If you want to run coverage analysis on a remote server, then use the dotCover command line tool.
If you want to make coverage analysis a part of your continuous integration (CI) builds, you can run dotCover on a CI server, e.g. JetBrains TeamCity, or any other CI server.
Why code coverage matters
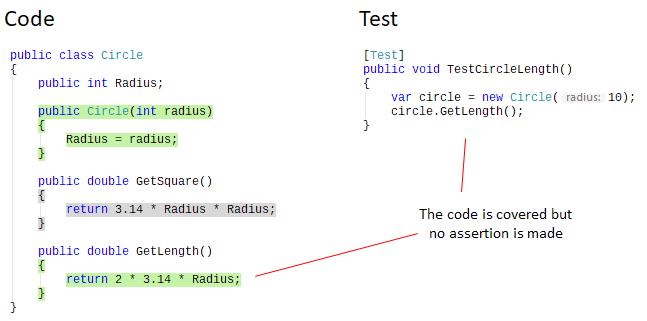
The main purpose of dotCover is risk identification and code quality assurance. The more code is covered by tests, the safer it is to make changes without breaking something. Many software companies make a certain code coverage value a requirement that must be fulfilled before the product release. At the same time, it is worth noting that code coverage shows how much testing you are doing but not how well you are doing it. 