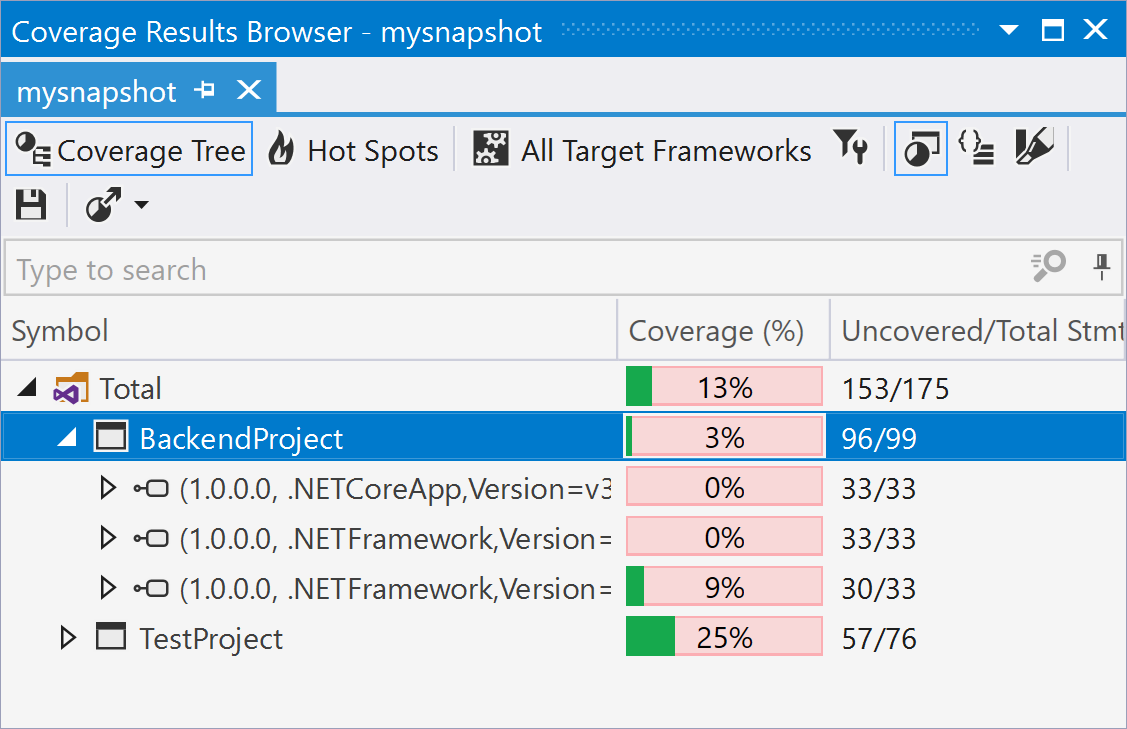
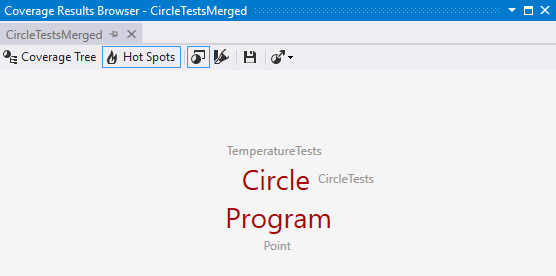
Coverage Results Browser window
In Visual Studio:
Control+Alt+K B
In dotCover standalone application:
Control+Alt+K B
This window allows exploring coverage snapshots obtained during an application coverage run or opened from a file. You can browse multiple snapshots in several tabs.
Each snapshot can be presented in two views, which you can toggle with the buttons in the right of the toolbar:
Coverage Tree
In this view, all code items are grouped in a tree structure and you can study the coverage of each code item.

In the Coverage column, dotCover uses three colors to display the coverage status:
Green — the percentage of covered statements within the node.
Red — the percentage of uncovered statements within the node.
Grey — the nodes not covered during the test run as they do not have executable code statements.
Hot Spots
In this view, you can quickly see the potential risk areas within the snapshot. To learn more, see Detect Hot Spots.

Toolbar Controls
| Control | Name | Description |
|---|---|---|
| Coverage Tree | Toggles the Coverage Tree view. | |
| Hot Spots | Toggles the Hot Spots view. For more information, see Detect Hot Spots. | |
| Match coverage results with current project structure | If this button is turned on, dotCover displays only assemblies that are included in the current solution. For more information, see Match Coverage Snapshot with Project Structure. | |
| All Target Frameworks | Filters coverage results based on the selected target framework. This list is shown only if your project targets multiple frameworks. | |
| Highlight code | Toggles highlighting of the code in the editor for the current coverage snapshot. For more information, see Visualize Code Coverage. | |
| Flatten Namespaces | Toggles between flat and tree namespace representation. In the flat mode, all namespaces including child namespaces are shown in a flat list (on the same level). | |
| | Save coverage snapshot as | Saves the current snapshot to a .dcvr file. For more information, see Save and Open Coverage Snapshot. |
| | Drop coverage results | Removes the existing coverage results. |
| Export coverage reports | Allows you to export the test coverage report to one of the selected formats: HTML, XML, JSON, and XML for NDepend. For more information, see Export Coverage Results |
The context menu in this window includes commands:
Exclude selected nodes
Exclude all nodes except selected
Exclude selected node and create coverage filter
These commands are rather self-explanatory; they allow excluding nodes from coverage snapshot presentation.
